Making Sense of Manufacturing Data
Jon Kepa Gerrikagoitia, Gorka Unamuno and Anne Sanz
IK4-IDEKO, Arriaga Industrialdea 2, Elgoibar, Spain
Keywords: Industry 4.0, Smart Manufacturing, Digital Factory, Big Data Analytics, Data Science.
Abstract: A fast and successful digitation of the industry is meant to be a key issue for Europe in order to maintain its
leading role. The new industrial revolution will be based on data as raw material, where the digital economy
will merge as a real economy. The challenges for a “hard” sector where traditionally the “soft” has not been
considered as an asset are evident and notorious. In this paper IK4-IDEKO, as part of a machine tool builder
group, DANOBATGROUP, provides a vision of the challenge and the approach for the solution, supported
by results of the current work.
1 INTRODUCTION
The new industrial revolution, nowadays called
Industry 4.0, pursues the adoption of Cyber Physical
Systems (CPS) to enable the creation of a real-time,
precise, reliable, monitoring system able to feed
analytics solutions to support the automation, the
control, and the improvement of the implemented
business processes. With respect to the current
solutions, pervasiveness of the Internet of Things
together with the ability to manage and process
bigger amount of data in real-time, makes the
Industry 4.0 a paradigm that can bring a lot of
advantages in the Factories of the Future: e.g., more
detailed control of processes and ability to quickly
react to internal and external changes.
The Industrial Internet is an internet of things,
machines, computers and people, enabling industrial
operations using advanced data analytics for
transformational business outcomes. There are many
interconnected systems deployed today that combine
hardware, software and networking capabilities to
sense and control the physical world.
With the development of the IIoT and
connectivity and the cloud computing infrastructures
provided as a service, a huge amount of data comes
up in order to boost new business models supported
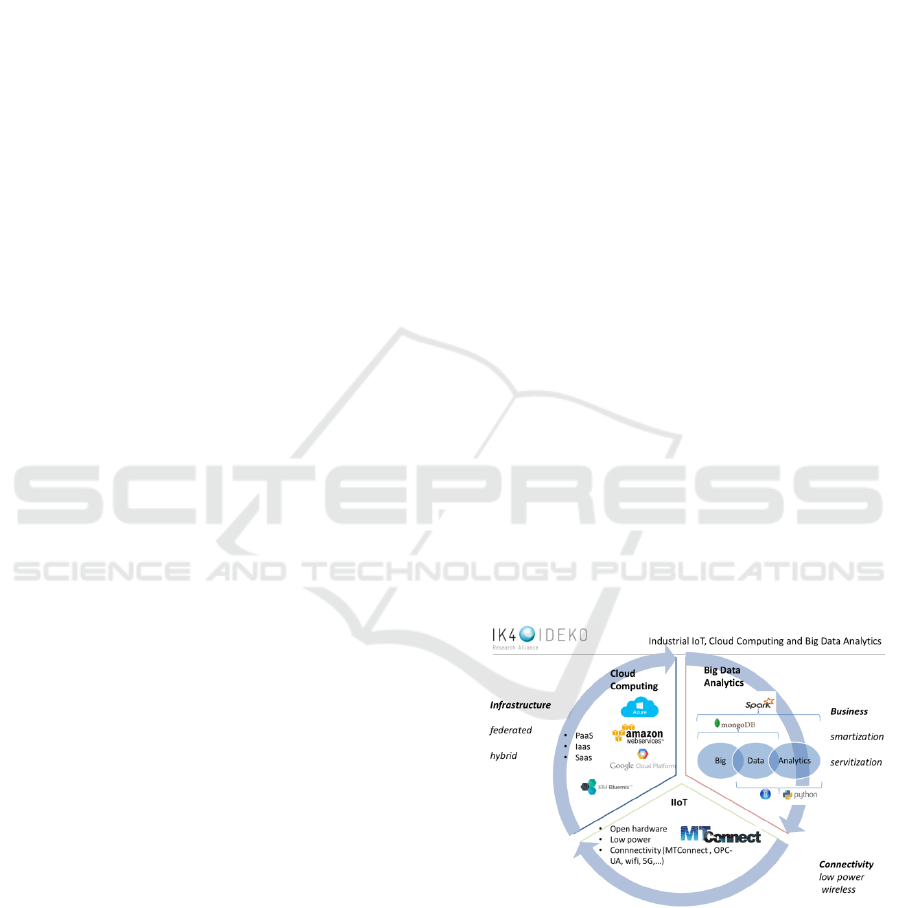
in the data analytics. Figure 1 shows the three main
pillars of innovation and transformation in
manufacturing based on IT. The connectivity
capabilities provided by the development in IIoT,
supported more and more in standards like
MTConnect or OPC-UA are a straightforward way
to listen to industrial devices, that are becoming
energy efficient and accessible wireless. In a
parallel way, the Platform as a Service and the cloud
computing models are offering ubiquitous storage
and computational resources, federated and hybrid
topologies, for the IIoT data. This data will be
converted in value, if we are able to benefit from Big
Data Analytics, creating business models based in
smart services. The loop with the IIoT is closed in
the extent that smart services can be implemented as
actuators with intelligent CPSs.
Figure 1: IIot, Cloud Computing and Big Data Analytics.
So far, there is actually a real world, represented
by the automation pyramid, where there are different
levels: sensors and embedded systems, cyber-
physical components, machines, production lines
and factories. This real world has a twofold
representation in the data realm, represented as a
virtual world (Figure 2).
590
Gerrikagoitia, J., Unamuno, G. and Sanz, A.
Making Sense of Manufacturing Data.
DOI: 10.5220/0005999005900594
In Proceedings of the 13th International Conference on Informatics in Control, Automation and Robotics (ICINCO 2016) - Volume 2, pages 590-594
ISBN: 978-989-758-198-4
Copyright
c
2016 by SCITEPRESS – Science and Technology Publications, Lda. All r ights reserved
In this sense, the Industrial Internet embodies the
concept of “data factory”, where data is produced,
moved, exchanged, transformed, processed,
elaborated and visualized in the virtual world, where
the digital domain takes its shape to take data into
action and value.
Figure 2: Real and virtual world in manufacturing.
This way, data becomes a real asset even for
industrial organizations and decision makers are
starting to be sensitive to this new paradigm in
which the big data analytics and data science open
new opportunities based on “smartization” and
“servitization”.
2 THE PROBLEM
Manufacturing firms not only seek manufacturing
technique innovations but are also beginning to
focus on added value services and new business
models, creating a fuzzy boundary between
manufacturing industry and service industry.
Servitization was proposed by Vandermerve and
Rada in 1988 (Vandermerwe and Rada, 1989). They
emphasized the concept of customer focus;
combining products, services, support, and
knowledge are the most important elements.
Furthermore, the authors also asserted that not only
service industries, but also manufacturing industries
should focus on innovative value added service
development in order to quickly enhance their core
competencies. Baines defined manufacturing
servitization as innovation of organizational
capabilities and processes, from product sales to
integrated product services (Baines et al, 2009).
Servitization is defined as the strategic innovation of
an organization’s capabilities and processes to shift
from selling products, to selling an integrated
product and service offering that delivers value in
use, i.e. a Product-Service System (Martinez et al.,
2010).
The concept of a Product Service-System (PSS)
is a special case of servitization. Mont defines PSS
as a system of products, services, supporting
networks, and infrastructure that is designed to be
competitive, satisfy customers' needs, and have a
lower environmental impact than traditional business
models (Mont, 2004). In the PSS business model,
industries develop products with value-added
services, instead of a single product itself, and
provide their customers with services that are
needed. In this relationship, the market goal of
manufacturers is not one-time product selling, but
continuous profit from customers by total service
solution, which can satisfy unmet customers’ needs.
For a best viewing experience the used font must be
Times New Roman, on a Macintosh use the font
named times, except on special occasions, such as
program code (Section 2.3.7).
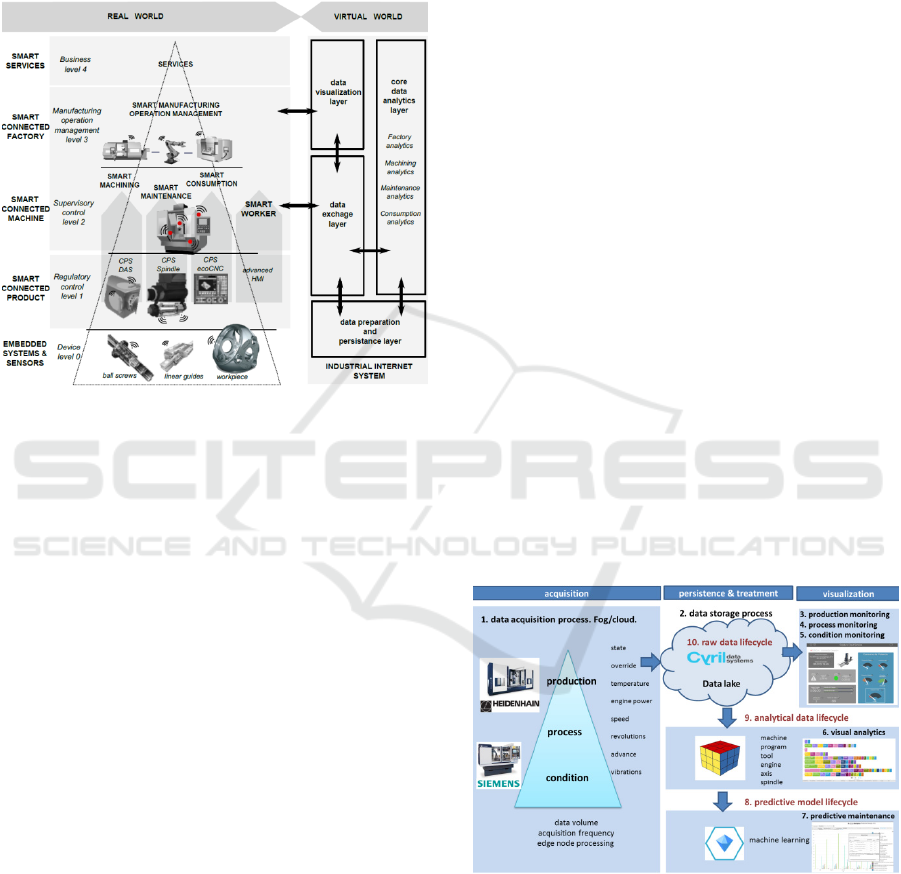
3 PHILOSOPHY
In order to address the explained challenges IK4-
IDEKO has defined a data management framework
shown Figure 3.
Figure 3: Data management architecture.
The three main layers of data acquisition, data
persistence and visualization have to be designed
having in mind that data is a raw material provided
by machines.
Making Sense of Manufacturing Data
591

3.1 Data Acquisition Layer
The data acquisition layer is responsible of the
observation, gathering and delivering of the
variables of the machine to the persistence layer.
The general solution provided by IK4-IDEKO is
a device and software built jointly with Cyril data
systems (www.cyril.es) that is able to connect via
Ethernet to different types of machines, read data
and sends them to the cloud. This data gathering
device can connect to diverse numeric controls as
Heidenhain, Fanuc or Siemens, or even a data
gathering sensors.
Once the device is connected to a machine, a
web management tool can be used to remotely
configure the device, define the signals or variables
that will be read from the machine etc (Figure 4). In
this case, the memory address map of the PLC will
be used to match the real world with its
corresponding virtual counterpart. Moreover, the
sampling or data gathering frequency has to be
defined, in that sense, the concept of group of
capture has been defined, in order to read and
transmit together the set of variables that have the
same observation frequency.
Figure 4: Remote configuration of PLC variables.
The commonly available variables of a machine
tool are obtained through the numeric control and
the programmable logic controller (PLC). These
components manage a wide set of variables that can
be categorized in the following groups: state, alarms,
speed, temperature, power, revolutions per minute,
advance,… All these variables are related to the
machine or to specific components as engine, axis,
spindle, tool,…
Other useful variables that can be obtained are
related to the interaction of the worker with the
machine as the different types of overrides,
modifying the programmed operation behaviour,
interruption of the cycle of the machine etc.
Although the numeric control is the main data
acquisition device, there are other variables, for
example the ones related to dynamics, like
vibrations that have to be obtained using specific
sensors. This way, the monitoring of the machine
implies the monitoring of a numeric control, PLC
and sensors, depending on the observational
requirements.
3.2 Data Persistence Layer
The management, transformation and treatment of
the data is the most important stage in a data-driven
approach in order to make sense of a myriad of
variables (temperature, speed, override, power,
revolutions, vibrations,… ) obtained from cnc/plc
and a set of sensors.
The data persistence layer is divided in two parts.
First, a data lake model is the general repository
where the data from the different groups of capture
and sensors is stored and tagged using metadata in
order to provide data lifecycle and management
capabilities. A NoSQL document oriented
MongoDB database is used for this purpose.
The second part of the persistence layer is an
analytical database based on a data mart model. The
initial implementation relies on a PostgreSQL
relational database management system with three
datamarts: production, process and condition.
The whole set variables of a machine can be
grouped conceptually in production, process or
condition data. The production variables focused in
the state of the machine and closely related to the
concept of availability. Process variables provide
information about the machining process through
speed, temperature, power, revolutions,…process
and production can be used to approach the overall
equipment efficiency of the machine in a great
extent. The third group of condition monitoring
variables, besides cnc variables, vibration, noise, and
temperature measurements are often used as key
indicators to provide health information about the
machine and help detect machine faults early, which
prevents unexpected failure and costly repair.
The dimensional model of the data warehousing
conceptual framework has been used because the
observed variables make more sense once they are
organized and combined with dimensions, like
machine, program, tool, engine, spindle…
3.3 Data Visualization Layer
The visualization layer is divided in two parts.
The first one is machine monitoring. The
information is shown in real time, the monitoring
can be about production (state, alarms), process
(current machining process) and condition (health
and symptoms).
ICINCO 2016 - 13th International Conference on Informatics in Control, Automation and Robotics
592
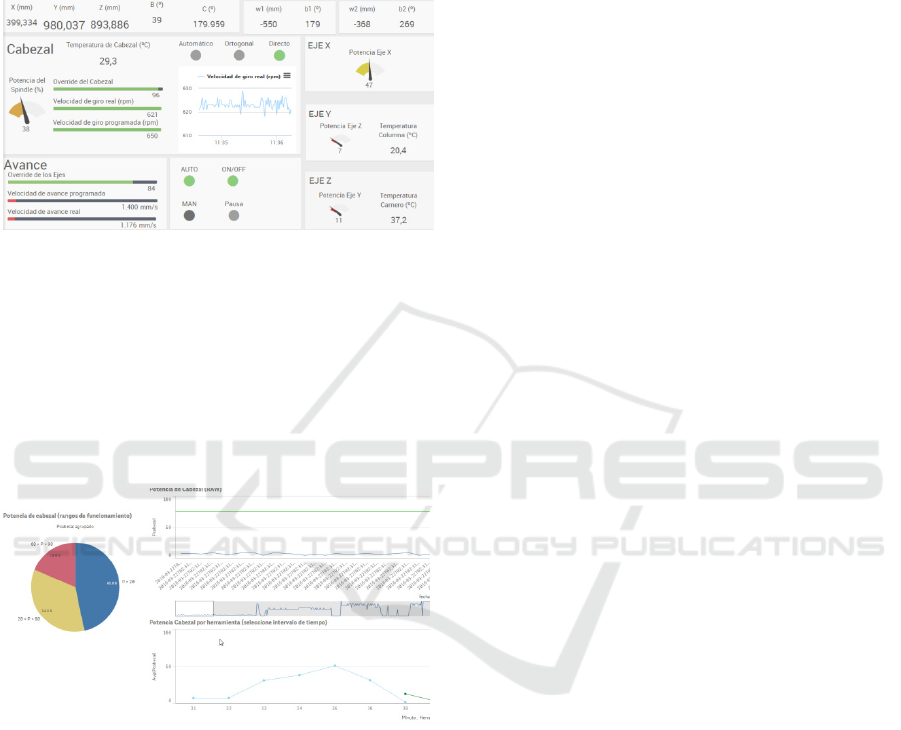
For this purpose, IK4-IDEKO´s strategy is based
in a web interface generator, a toolbox with different
visualization widgets is available and ad-hoc
windows can be designed by the end users. A
process monitoring interface is displayed in Figure
5.
Figure 5: Process monitoring.
For this scenario, the data lake provides the real
time stream data to be presented via web.
The second part of visualization is focused in
visual analytics and insights in order to enhance the
EDA (exploratory data analysis) and communication
tasks of the data scientists. For this purpose third
party tools are used, mainly RStudio, Watson
Analytics and Qliksense (Figure 6).
Figure 6: EDA using third party tools.
The data marts are the data source used in the
case of the exploratory data analysis visualization
and machine learning modelling for production,
process or condition data.
4 CONCLUSIONS
The digitization of the industry in order to boost and
benefit from digital opportunities requires a mid-
term transformational roadmap. Nevertheless, to
move forward in that way, certain steps have to be
done in the right direction. There are key enabling
technologies such as IIoT connectivity, cloud
computing and big data analytics as drivers for
making sense of manufacturing data. This paper
shows the way that IK4-IDEKO is approaching the
challenge of digitizing the manufacturing industry.
If data is the raw material of the new industrial
revolution, the data science in manufacturing is what
definitely will help to make sense of manufacturing
data. A machine-centric data-driven approach that
benefits from IIoT, cloud computing, Big Data and
visualization technologies and empowers the role of
the data scientist in manufacturing.
The consumption, use and creation of innovative
digital services is being leveraged by the this new
role that is gaining prominence in organizations: the
data scientist. Data scientists are the people who
understand how to fish out answers to important
business questions from today’s tsunami of
unstructured information (Davenport and Patil,
2010). As companies rush to capitalize on the
potential of big data, the largest constraint many face
is the scarcity of this special talent. What kind of
person does all this? What abilities make a data
scientist successful? The data scientist can be
understood as a hybrid of data hacker, analyst,
communicator, and trusted adviser. An extremely
powerful combination. As this multidisciplinary role
is difficult to get in a single professional, IK4-
IDEKO has created a Data Science in Manufacturing
Team with the vision and ambition to become a
reference group in this new knowledge area.
Computer scientist, electronics, mechatronics,
experts in industrial automation, dynamics and
control, production systems, machining processes,
… related skills put together to find a story in a data
set and provide a coherent narrative about a key data
insight with the idea to convert data in value and an
eventual business exploitation model.
ACKNOWLEDGEMENTS
ELKARTEK, Basque Government Research
Program
REFERENCES
Erol, S. (2016). Strategic guidance towards Industry 4.0, a
three-stage process model.
Briefing Industry 4.0. Digitalisation for productivity and
growth. (2015). ch-en-manufacturing-industry-4-0-
24102014. (n.d.).
Chen, M., Mao, S., & Liu, Y. (2014). Big Data: A Survey,
Making Sense of Manufacturing Data
593

171–209. http://doi.org/10.1007/s11036-013-0489-0.
Lee, J., Kao, H. A., & Yang, S. (2014). Service innovation
and smart analytics for Industry 4.0 and big data
environment. Procedia CIRP, 16, 3–8.
http://doi.org/10.1016/j.procir.2014.02.001.
F., Chen P., Deng J., Wan, D., Zhang, A. V., Vasilakos X.,
Rong. (2015). Data mining for the internet of things:
Literature review and challenges. International
Journal of Distributed Sensor Networks, 2015(i).
http://doi.org/10.1155/2015/431047.
Vandermerwe, S., & Rada, J. (1989). Servitization of
business: adding value by adding services. European
Management Journal, 6(4), 314-324.
Baines, T. S., Lightfoot, H. W., Benedettini, O., & Kay, J.
M. (2009). The servitization of manufacturing: a
review of literature and reflection on future challenges.
Journal of Manufacturing Technology Management,
20(5), 547-567.
Martinez, V., Bastl, M., Kingston, J., & Evans, S. (2010).
Challenges in transforming manufacturing
organisations into product-service providers. Journal
of Manufacturing Technology Management, 21(4),
449-469.
Mont, O. (2004). Product-service systems: panacea or
myth?. Lund University.
Davenport, T. H., & Patil, D. J. (2012). Data Scientist.
Harvard Business Review, (October), 70–76.
ICINCO 2016 - 13th International Conference on Informatics in Control, Automation and Robotics
594
