
An Implementation of a QoE Evaluation Technique Including Business
Model Parameters
Diego Rivera
1
, Ana R. Cavalli
1
, Natalia Kushik
1
and Wissam Mallouli
2
1
SAMOVAR, T
´
el
´
ecom SudParis, CNRS, Universit
´
e Paris-Saclay, 9 rue Charles Fourier 91011, EVRY, France
2
Montimage, Paris, France
Keywords:
Quality of Experience (QoE), Business Model, QoE Evaluation, Extended Finite State Machine (EFSM).
Abstract:
The expansion of Internet-based services has increased the need to ensure a good quality on them. In this con-
text, a preliminary work we developed exposes a Quality of Experience (QoE) evaluation framework based
on the mathematical formalism of EFSMs, which includes business-related variables into the prediction anal-
ysis. In this paper, we present an implementation of this QoE evaluation framework using the Montimage
Monitoring Tool (MMT). The implementation presented in this paper is based on three main algorithms: (1)
generation of the traces of a given length of the EFSM-based OTT model, (2) computation of the QoE for
each trace using a suitable QoE model, and (3) computation of the number of configurations reachable from
the initial state of the EFSM. We use this implementation to calculate the amount of configurations captured
by the model of a real OTT service, analyzing how this value varies with respect to the depth (trace length) of
the analysis and which is the distribution of the QoE values of the computed configurations. This information
will enable the service provider to characterize the QoE of all possible scenarios and to introduce changes if
required, in order to maximize the revenues provided by the chosen business model and the QoE of end-users.
1 INTRODUCTION
With the expansion of Internet as an effective media
to transport data, new types of services have found a
business opportunity. In this sense, the Internet-based
services arose as a competitive alternative to the tradi-
tional telecommunication services commonly offered
(and distributed) by the major actors of the telecom-
munication market. A particular example of them are
the multimedia services. New companies in the mar-
ket, such as Skype or Netflix, have proposed a new
offer with more competitive prices in comparison to
the ones offered by traditional telcos. This business
strategy has led them to gain an important portion of
the market in a short time.
This last fact can be explained mainly by the use
of Internet as the main distribution method for their
services, excluding the network operators from any
revenues of these services. This is the main feature
that defines what an Over-The-Top Service (OTT) is,
i.e. services offered using Internet as the distribution
platform, but without involving the network operators
in the business. It is important to remark that the use
of Internet to distribute content allows an easy and
fast deployment of the service. In addition, it presents
the advantage of avoiding the costs of building and
managing the distribution network, but it introduces
other difficulties to the distribution process.
The Internet was conceived as a best effort net-
work, meaning that the delivery of the data is not en-
sured. Some network protocols such as TCP try to
fix this, but they do not ensure any quality parame-
ters, typically required in multimedia services as, for
example, audio or video streamings.
In this paper
1
, we analyze the quality concept
starting from three points of view: the technical posi-
tion, related with the quality of the network itself; the
view of the user, which is more related to the qual-
ity level experienced and the fulfillment of his/her ex-
pectations; and finally, the view of the business in-
vestor, which is interested in the maximization of the
revenues. For each one of these actors, we use a par-
ticular quality concept that is integrated into the eval-
uation framework of a real OTT case study.
This work expands the previous research by in-
troducing an implementation of the Quality of Ex-
perience Evaluation Framework published in (Rivera
1
This work has been developed in the frame of the Celtic+
Project NOTTS http://projects.celticplus.eu/notts/
138
Rivera, D., Cavalli, A., Kushik, N. and Mallouli, W.
An Implementation of a QoE Evaluation Technique Including Business Model Parameters.
DOI: 10.5220/0006005001380145
In Proceedings of the 11th International Joint Conference on Software Technologies (ICSOFT 2016) - Volume 2: ICSOFT-PT, pages 138-145
ISBN: 978-989-758-194-6
Copyright
c
2016 by SCITEPRESS – Science and Technology Publications, Lda. All rights reserved

et al., 2015), which is based on the Extended Fi-
nite State Machines (EFSMs) mathematical formal-
ism. The implementation is based on the Montimage
Monitoring Tool (MMT) that allows modeling and
simulating the execution of EFSMs. This tool was
modified by introducing three algorithms: (1) the es-
timation of the l-equivalent of an EFSM and the traces
(paths) defined in this l-equivalent; (2) the calculation
of the QoE of each path by applying an appropriate
QoE evaluation model; and (3) the computation of the
number of configurations of the machine – namely
“user scenarios” – in order to analyze the effective-
ness of representing an OTT service as an EFSM.
The rest of the paper is structured as follows. Sec-
tion 2 contains the preliminaries, including a brief de-
scription of the QoE evaluation framework this work
is based on. Section 3 introduces the algorithms that
implement the QoE framework presented in the pre-
liminaries, being all of them implemented as an ex-
tension of the Montimage Monitoring Tool. Section 4
presents the analysis of a real case of study (the beIN
Sports Connect Service) including the results and the
discussion of the test. Finally, Section 5 presents the
conclusions of this work.
2 PRELIMINARIES
2.1 OTT Services
A formal definition of an Over-The Top Service
(OTT) was provided by Green et al., who defined it as
a “service that delivers value to the customers without
involving any carrier in the planning, selling, provi-
sioning or servicing of the offer and, of course, with-
out involving any traditional telco in the revenues of
these services” (Green et al., 2007). From this def-
inition, it is important to remark that three main ac-
tors involved in the whole scenario are: (1) the ser-
vice providers, who provide the content and make it
available to the customers via Internet; (2) the users
or customers, who are the target people that will con-
sume the content provided by the OTT provider; and
(3) the network operators (Internet Service Providers
– ISPs), who are the “third-party” companies that are
in charge of the technical administration of the net-
work and its commercialization. The latter are the
ones that provide the access to Internet to both the
OTT providers and the final customers.
Despite the ISPs are the only actors that are in
charge of conducting the content from the service
provider to an end-user, they do not take any part
of the revenues of the service. In addition, the OTT
traffic usually represents a huge load for the network
components, which raises the complexity of manag-
ing the network and, therefore, the maintenance costs.
This fact has led the ISPs to push the OTT providers to
share their revenues, even by imposing restrictions to
the OTT traffic, such as limiting the bandwidth avail-
able for these types of services.
2.2 Quality in Different Dimensions
Starting from its conception, Internet was designed as
a best-effort network, meaning that the delivery of the
data is not guaranteed for any service that uses this
network as the distribution mechanism. However, the
arrival of more complex services arose the issue of
ensuring a good level of quality, concept which defi-
nition depends on the point of view from which it is
being analyzed (Gozdecki et al., 2003).
The quality concept can be defined, as seen from
an engineer, as a set of measurable, technical param-
eters (Gozdecki et al., 2003). In this case, the concept
of Quality of Service (QoS) commonly refers to these
types of parameters that can be obtained by direct
measuring the network. This definition is aligned with
the main goals of this work, given that the framework
proposes a methodology to map these values into the
user experience of a given service. Typical examples
of these variables are the delay or packet loss, all of
them are usually easy to measure or monitor at any
point of the network.
Even when the given definition tries to widely
cover all the aspects of quality, it does not cover the
totality of possible dimensions of the quality concept.
As stated by the International Organization for Stan-
dardization (ISO), quality is defined as “(the) degree
to which an inherent characteristics (a distinguishing
feature) fulfills requirements (a need or expectation
that is stated, generally implied or obligatory)” (ISO,
2015). In this definition, the expectation is also a part
of the concept, thus it is important to consider the
quality definition from the point of view of the user
in order to have a broad, comprehensive conception.
This idea was captured by Le Callet et al. with
the definition of Quality of Experience (QoE) as “the
degree of delight or annoyance of the user of an appli-
cation or service. It results from the fulfillment of his
or her expectations with respect to the utility and/or
enjoyment of the application or service in the light
of the user’s personality and current state” (Le Cal-
let et al., 2013). This has become the most accepted
description of QoE since it captures the fact that the
experience of a service is a subjective opinion aligned
with user’s expectations. Based on this definition, we
will understand the QoE as the quality level subjec-
tively perceived by a user, which is related with the
An Implementation of a QoE Evaluation Technique Including Business Model Parameters
139

fulfillment of his/her expectations.
At this point, we have analyzed the quality defini-
tion given in (ISO, 2015) as seen from the engineer’s
and user’s point of view. However, it is also possible
to understand it from the point of view of the business.
This approach was formalized in (Van Moorsel, 2001)
with the definition of the Quality of Business (QoBiz)
as “all of the parameters that can be expressed in mon-
etary units”. In this study, Van Moorsel identifies a
direct relation between the QoE and QoBiz, based on
pricing schema of the service and the willingness to
pay of the customer (Van Moorsel, 2001). These rela-
tionships have been reaffirmed by Liao et al., stating
that customers make comparisons between the price
and their expectations with their previous experiences
with similar services (Liao et al., 2015). Having this
in mind, we will use this fact to consider the pric-
ing schema as the main QoBiz parameter of the QoE
analysis, in order to study how these types of busi-
ness decisions can influence the user’s expectations
and, therefore, the QoE.
2.3 Extended Finite State Machines
Multiple definitions of this concept have been given in
the literature, being most of them more related with
mathematical formalisms that go beyond the scope
of this work. In the context of this work, we will
use the following definition given in (Petrenko et al.,
2004). Given X (the set of inputs), Y (the set of out-
puts), R (the set of parameters) and V (the set of con-
text variables), we denote R
x
⊆ R the set of input pa-
rameters and D
R
x
the set of valuations (as vectors) of
these parameters for an input x ∈ X. Similarly, for
an output y ∈ Y we define the set of output parame-
ters and their valuations R
y
and D
R
y
. Finally, D
V
de-
notes a set of vectors of context variables valuations
v. Being this said, an Extended Finite State Machine
(EFSM) M over X, Y, R, V is a pair (S, V ) of a finite
set of states S and a finite set of transitions T be-
tween states in S, such that each transition t ∈ T is
a tuple (s, x, P, op, y, up, s
0
) where: s, s
0
∈ S are the ini-
tial and final state of the transition respectively; x ∈ X
is the input of the transition; y ∈ Y is the output of the
transition; P, op and up are functions defined over
input parameters and context variables in V , where
P : D
R
x
× D
V
→ {Tr ue, False} is the predicate of the
transition, op : D
R
x
×D
V
→ D
R
y
is the output parame-
ter function of the transition, and up : D
R
x
×D
V
→ D
V
is the context update function of the transition.
An example of an EFSM is presented in
Figure 1 where we can identify, for example,
the set of inputs X = {connect, option, lo-
gin
credentials, validate, user card data, “live”,
stop stream, “home button”}, the set of states
S = {Idle, Choosing subscription or login, wait-
ing for personal data, waiting for card data, ser-
vice ready, stream delivery, stop stream}, and,
for example, a transition t = (stream delivery,
NULL, ‘if(stream flag ==1)’,
/
0, stream data, f
1
,
stream delivery).
2.4 Business Model Aware QoE
Framework
As stated in the previous paragraphs, this paper aims
to integrate business-related parameters into the eval-
uation of the QoE. This new approach required the de-
velopment of a new QoE evaluation framework flexi-
ble enough to include such kind of new variables that
can influence the perceived quality of an OTT service.
The framework is used to analyze and calculate
the QoE of an OTT service. An EFSM is used to rep-
resent: the stages of the user-service interaction, the
inputs given to the service and the outputs to an end-
user. This constitutes the first step of the framework,
producing a preliminary model of the service that rep-
resents the functional and some non-functional re-
quirements of the service.
This preliminary model is then augmented in or-
der to include the quality parameters that will be an-
alyzed. This augmentation is done through introduc-
ing context variables in the machine representing the
quality parameters. To accomplish this step, it is re-
quired to provide: (1) the specification about how
these variables are measured and, (2) how and where
in the model their values are updated. This second
step finalizes with an augmented model, establishing
how the quality indicators are updated at each step.
Finally, the model can be used to analyze the QoE
of the service. To achieve this, one can calculate the
l-equivalent form of the model, which shows all the
possible end-user scenarios reachable from the initial
state to a fixed length l as branches of a tree-shaped
model. At each one of these branches it is possible to
apply a proper QoE model that correlates the values
of the context variables in order to obtain the value of
the QoE of the branch.
In this paper, we use this approach to model and
augment a real OTT service, namely beIN Sports
Connect. The augmented EFSM is shown in Figure 1.
Further details about how to obtain this model can be
found in (Rivera et al., 2015).
In the model used in this work, we consider three
groups of quality parameters: objective, subjective
and business-related parameters. With these variables
we aim to model the stream state of the service (the
video is being streamed or not), the confidence of the
ICSOFT-PT 2016 - 11th International Conference on Software Paradigm Trends
140
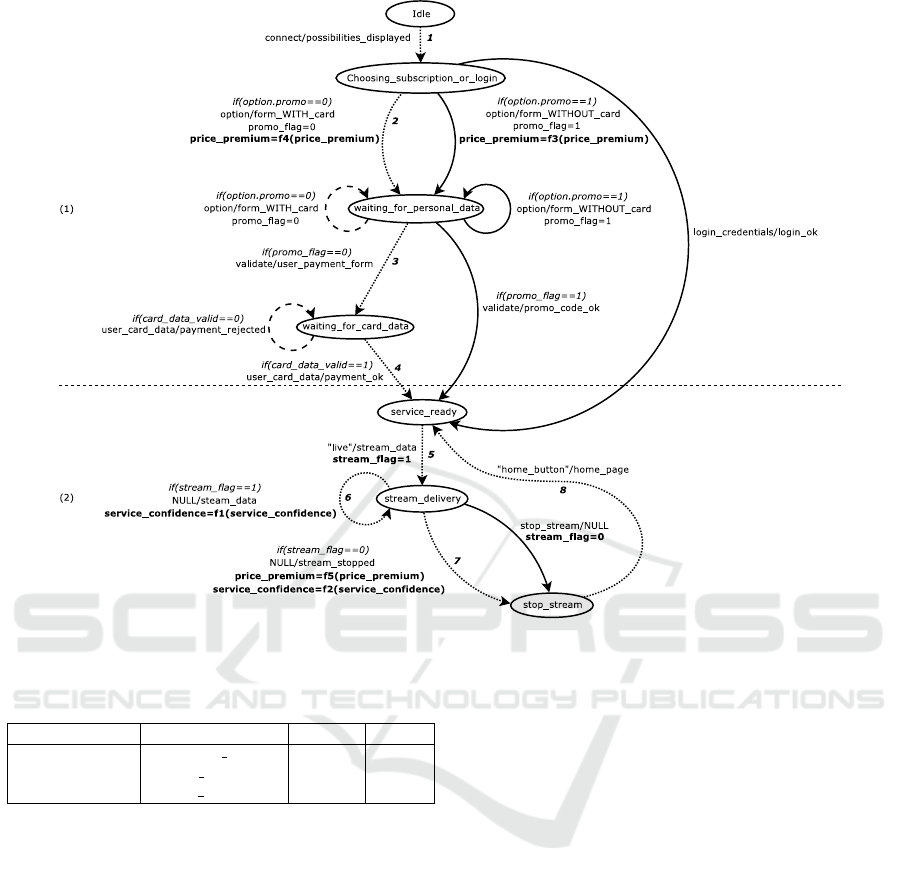
Figure 1: Augmented EFSM for beIN Sports Connect Service.
Table 1: Summary of the quality parameters/variables for
the beIN Sports Connect Service.
Parameter type Variable Name Values Weight
Objective stream flag {0, 1} 0.5
Subjective service confidence {0, 1, 2} 1.0
Business-related price premium {0, 1, 2} 1.0
user (the level of trust of the user with the service),
and the willingness to pay of the user (namely the
“loyalty” of the user with the service). For each one
of them, we consider a single discrete context variable
taking at most three values. In Table 1 we present a
summary of the quality parameters considered for the
beIN Sports Connect Service.
3 QoE FRAMEWORK
IMPLEMENTATION
The framework presented in the Section 2.4 was de-
signed to provide a mechanism to evaluate the QoE
using EFSMs while considering how the business as-
pects of the service impact the QoE value. The im-
plementation is formed by three main algorithms pre-
sented in the following sections.
3.1 QoE Evaluation Algorithms
3.1.1 Generation of the l-equivalent
As stated before, once the service is modeled as an
EFSM and augmented with quality parameters, one
can generate its l-equivalent form before starting any
further analysis. This process is performed by the ap-
plication of Algorithm 1.
This procedure analyzes recursively the provided
EFSM, traversing the graph using a Depth-First
Search (DFS) strategy. At each step, the algorithm
analyzes each transition of the actual state, determines
if the conditions for the transition stand, and uses the
updating functions to change the variable values for
the next step. The rest of the paths are calculated re-
cursively starting from the current state, updating the
length of the analysis and the context variable val-
ues. Finally, the obtained paths are augmented with
the data calculated for the current step, and the re-
sult is returned. In this algorithm, the base case is
reached when the procedure is called with a length of
0, returning the vector variable and the current state
reached.
An Implementation of a QoE Evaluation Technique Including Business Model Parameters
141

Algorithm 1: l-equivalent generation.
function BUILDPATHS(state, len, vars)
if len ≤ 0 then
return {(state, vars)}
end if
paths ← {}
for all t in transitions[state] do
step ← (state, vars)
stand ← true
for all cond in t.conditions do
stand ← stand && cond(vars)
end for
if !conditionsStand then
continue
end if
for all f in t.updateFunctions do
for all var in vars do
if var.name == f .name then
var.val ← f . f unc(var.val)
end if
end for
end for
lowPaths ← buildPaths(t.to, len − 1, vars)
for p in lowPaths do
paths ← paths ∪ {[p, step]}
end for
end for
return paths
end function
3.1.2 Computation of the QoE
Once the l-equivalent of the EFSM is derived, the next
step is to calculate the QoE for each trace. This is
completed by the procedure shown in Algorithm 2.
Algorithm 2: QoE Evaluation of the traces.
function EVALQOE(traces, qoeModel)
results ← {}
for all trace in traces do
tr
f
← []
for all s in trace do
qoeVal ← qoeModel(s.vars)
tr
f
← tr
f
∪ (s.state, s.vars, qoeVal)
end for
results ← results ∪ {tr
f
}
end for
return results
end function
The proposed method iterates over every path pre-
viously calculated, computing the QoE at each step of
the path using the given QoE model as a mathemati-
cal function. In our particular case, we use a linear
combination as such mathematical function. Finally,
this algorithm returns the set of all paths (the same in-
formation that was used as input) augmented with the
new information of the computed QoE.
Algorithms 1 and 2 can also be used in combi-
nation with active monitoring and DPI techniques.
In (Rivera and Cavalli, 2016), we present the design
of an MMT extension that identifies the actual stage
of the user-service interaction in the model and the ac-
tual set of values of the quality parameters. With this
information, it is possible to use both Algorithms 1
and 2 in order to predict the future scenarios for an
end-user and their corresponding QoE values.
3.2 Concrete Implementation
In order to analyze a real case study, it is required
to implement the algorithms presented below using a
tool that allows: (1) representing an OTT service as
an EFSM model and, (2) interact with the OTT flow
in order to extract the information about the values of
the quality parameters.
3.2.1 Montimage Monitoring Tool (MMT)
The MMT tool is an online monitoring solution that
provides real-time visibility of network traffic, ap-
plication communication, flows and usage levels. It
facilitates network security, performance monitoring
and operation troubleshooting. MMT rules engine
can correlate network and application events in order
to detect operational, security and performance inci-
dents or to generate new events.
MMT is composed of three complementary, but
independent, modules. First, MMT-Probe is the core
packet capture and extraction module. It analy-
ses network traffic using Deep Packet/Flow Inspec-
tion (DPI/DFI) techniques and also allows analyzing
any structured information generated by applications
(e.g., traces, logged messages, simulated events).
Second, MMT-Correlation is an analysis engine based
on formal properties that analyzes and correlates net-
work and application events to detect operational and
security incidents or derive new events. Third, MMT-
Reporting is a visualization application that allows
collecting and aggregating analysis reports to present
them via a graphical user interface.
3.2.2 Implementation Details
The architecture of the MMT tool described below
allowed us to take advantage of its DPI/DFI tech-
niques in order to perform an online analysis of the
OTT flow. The events generated by the MMT-Probe
module – which contain information about the OTT
ICSOFT-PT 2016 - 11th International Conference on Software Paradigm Trends
142

stream – are analyzed by the MMT-Correlation mod-
ule and the results are finally presented using the
MMT-Reporting module. Following this schema, our
implementation will take advantage of two main char-
acteristics of this architecture.
Firstly, the DPI capabilities of MMT-Probe will
allow recognizing the values of the quality parameters
and the actual stage of the user-service interaction.
This information will be useful to automatically pre-
dict future configurations of the machine and, there-
fore, future values of the QoE.
Secondly, the MMT-Correlation module has been
implemented using the Node.js technology (based on
the Javascript language), allowing a clear representa-
tion of the EFSM model using the Javascript format.
4 ANALYSIS OF AN OTT
SERVICE
As stated below, the augmentation of the service
model with discrete and finite quality parameters in-
troduces a maximum number of EFSM configura-
tions. However, the predicates on the transitions and
the initial values of the context variables set a limit on
the valid configurations for the OTT service. In order
to present the advantage of this feature, we empiri-
cally compute the amount of different configurations
contained in the model. Using this information it will
be possible to characterize each reachable configura-
tion and its QoE value, showing a distribution of the
QoE values in all the possible configurations.
4.1 Computation of the Total Number
of Configurations of the Model
As mentioned before, we will use the configurations
captured in the EFSM in order to analyze the OTT
service. For this goal, each configuration is based
on two main features of the EFSM: the states of the
OTT model and the context variables of the machine
representing the quality parameters. This completely
defines a configuration of the machine as the tuple
C = (s, v) where s ∈ S is a state of the machine, and
v ∈ D
V
is the vector of the values of context vari-
ables. Each tuple is related to a specific QoE value
at a specific stage of the user-service interaction, thus
by computing the whole set of configurations of the
model it will be possible to predict all the possible
QoE values for the service. This analysis allows iden-
tifying the configurations where the QoE value is low,
which is useful information for the service provider in
order to determine how to optimize the resource dis-
tribution, maximizing both the revenues of the busi-
ness and the quality of an end-user.
Algorithm 3: Computation of the total number of configu-
rations.
function COMPUTECONFS(len, state, vars, con f s)
if len ≤ 0 then
return con f s = con f s ∪ {(state, vars)}
end if
for all t in transitions[state] do
stand ← true
for all cond in t.conditions do
stand ← stand && cond(vars)
end for
if !conditionsStand then
continue
end if
for all f in t.updateFunctions do
for all var in vars do
if var.name == f .name then
var.val ← f . f unc(var.val)
end if
end for
end for
buildPaths(t.to, len − 1, vars)
end for
end function
For a general EFSM representing any OTT model,
the cardinality of the sets previously mentioned, can-
not be estimated in advance, thus the number of possi-
ble configurations represented with the machine can-
not be determined in a general way. However, it
is possible to refine this analysis using a concrete
instance of an OTT model, represented by a fixed
amount of states and context variables. In this sense,
modeling a real OTT service by using the proposed
methodology can aid us with the analysis of the pos-
sible configurations of the service and further predic-
tions about reachable QoE values.
When the quality parameters are discrete and the
maximum number of their values is known in ad-
vance, one can estimate the maximal number of con-
figurations of the machine as |C| = |S| ·
∏
|V |
i=1
|v
i
|,
where |S | is the number of states of the machine, |V | is
the number of context variables in analysis, and |v
i
| is
the number of possible values of the context variable
v
i
. This integer |C| represents the theoretical max-
imum number of configurations since a single user
might experience all the range of values at every sin-
gle state of the machine. However, the usage of the
EFSM formalism and the introduction of predicates
in the model allows to reduce the amount of possible
configurations reachable from the initial state.
An Implementation of a QoE Evaluation Technique Including Business Model Parameters
143

In order to show this effect, we introduce a third
algorithm (Algorithm 3) that allows us to compute the
possible configurations contained within the model.
It is based on the Algorithm 1, recursively comput-
ing the result. The process determines at each step
which are the transitions that will be executed given
the values of the parameters, and recomputes the val-
ues of the variables before calling recursively the al-
gorithm on the next state of the machine. Once the
required length was reached, the algorithm adds the
current configuration to the final set.
Using the implementation of Algorithm 3, we per-
formed experiments to empirically calculate: (1) the
maximum number of possible configurations repre-
sented with the machine, (2) how this value changes
with respect to the depth of the l-equivalent, and (3)
which is the distribution of the QoE values for the
configurations represented in the model. The follow-
ing sections present the details about the correspond-
ing numerical analysis executed.
4.2 Experimental Configuration
The methodology and algorithms presented above
were used to analyze the beIN Sports Connect Ser-
vice. The three algorithms were implemented as an
extension of the MMT, and the model of the beIN
Sports Connect service was represented as an input
of the tool. In order to show the effectiveness of the
proposed approach, we used the Algorithm 3 to ana-
lyze the increase of the total number of configurations
with respect to the length of l-equivalent, ranging the
values of length of the tree from 2 to 18.
For this simulation, the initial values of the pa-
rameters were set to represent that the stream is not
playing (stream flag = 0), and a end-user with a neu-
tral opinion of the service (service confidence = 1)
who does not have a preference for a brand, called or
brand switcher (price premium = 1). However, the
conditions here exposed do not emulate a service fail-
ure, i.e. the transition labeled with 7 in Figure 1 is
never triggered since its execution is constrained to
an external change on the stream flag variable.
In order to fix this, we replaced the predicate of
the transition with two different ones simulating the
following scenarios: (1) the transition will trigger au-
tomatically if the simulation stays on the ‘delivery’
state more than twice consecutively (“fixed failure”),
and (2) the transition will be triggered randomly with
probability 0.5 (“random failure”).
Finally, in order to compute the QoE of each con-
figuration of the machine, we use the QoE model pro-
posed in (Sandoval et al., 2013), which is based on
a linear combination of the parameters. For the pur-
Table 2: Configurations and QoE distribution for scenario
1.
Length
Avg. number Average QoE distribution
of conf. ]0,1[ [1,2[ [2,3[ [3,4[ [4,5]
2 3 0 0 2 1 0
3 7 0 0 4 3 0
4 12 0 0 6 6 0
5 17 0 0 7 10 0
6 24 0 0 8 14 2
7 41 4 9 9 15 4
8 48 5 12 10 15 6
9 51 6 12 12 15 6
10 53 6 12 14 15 6
11 54 6 12 15 15 6
12 54 6 12 15 15 6
Table 3: Configurations and QoE distribution for scenario
2.
Length
Avg. number Average QoE distribution
of conf. ]0,1[ [1,2[ [2,3[ [3,4[ [4,5]
2 3 0 0 2 1 0
3 7 0 0 4 3 0
4 12.3 0.3 0 6 6 0
5 18.3 0.9 0.4 7 10 0
6 28.1 1.7 2.4 8 14 2
7 36.9 2.7 6.2 9 15 4
8 42.9 3.9 8.1 9.9 15 6
9 48.1 5.4 10.9 10.8 15 6
10 52.5 5.8 12 13.7 15 6
11 53.7 6 12 14.7 15 6
12 54 6 12 15 15 6
poses of this work, we use fixed weights for each vari-
able shown in Table 1, leaving the experimental eval-
uation for finding their best values as future work.
4.3 Results and Discussion
The results of the experiments are presented in Ta-
bles 2 and 3. The results for lengths between 13 are
18 are not shown, showing the same values as length
12 in both cases.
In both scenarios, we observe a steady increase on
the number of configurations as long as the depth of
the analysis increases. However, this increase stabi-
lizes at the length of 11 and 12 for the fixed and ran-
dom failure emulation respectively, where the maxi-
mal number of configurations reaches 54. After these
values, the distribution of the QoE values remains the
same in both experiments.
When observing the calculated QoE values, we
notice that at low lengths no configurations have a
QoE lower than 2, which can be explained by the
fact that the prediction has not considered the effect
of service failures yet. At the same time, it is possi-
ble to observe how the subjective and business-related
variables affect the QoE: with low depths of analysis
we can observe that the QoE of the computed config-
ICSOFT-PT 2016 - 11th International Conference on Software Paradigm Trends
144

urations are spread in the 2 to 4 range (from “bad”
to “good” in the MOS scale). By introducing the
price premium and service confidence variables (and
their respective updating functions) the model now
considers the effects of loyalty and past experiences
on his/her expectations.
As expected, when performing a deeper analy-
sis, we observe configurations with low QoE values
showing the effects of emulating failures of the ser-
vice. Despite the growth of the length, the configura-
tions with low QoE do not grow considerably in both
scenarios, showing a normal distribution with average
of 3, once the number of configurations has reached
its maximum.
This last fact represents a potential of this type of
analysis: it is possible to observe that there are 54
reachable configurations of the user, where 21 have
a QoE value equal or higher than 3. The rest of the
configurations have a “bad” or lower QoE value. This
information is useful to the service provider in order
to take countermeasures with these unsatisfied users
or invest more to improve the service offered.
Finally, it is important to notice that despite the
nature of the simulation of the failure events (random
or fixed), it is possible to reach the same number of
maximal configurations: 54 in both cases, number
affected by the number of the context variables and
predicates inserted in the model. In addition, this ef-
fect of the analysis shows the advantage of the ap-
proach: the EFSM retains and limits the maximal
amount of configurations, that can be reached at a
fixed length. In this sense, this fact allows us to
limit the length of the l-equivalent up to this value,
on which all the possible scenarios of a final user are
reached. We conjecture that this is the optimal length
of the l-equivalent machine, where a deeper analysis
no longer adds different scenarios to consider.
5 CONCLUSION
In this paper, we presented the implementation of a
business-aware QoE evaluation framework. The im-
plementation is based on the Montimage Monitoring
Tool and it is composed of three basic algorithms.
We used this implementation to analyze the beIN
Sports Connect Service in order to show the advan-
tages of representing an OTT service using the EFSM
formalism. In this direction, we computed the amount
of different scenarios of an end-user. The implemen-
tation allows to simulate how this number varies with
the depth – length of the l-equivalent – of the analy-
sis, and which is the distribution of the QoE values at
different depths of the study.
With this analysis, we found that the number of
configurations will reach its maximum after a fixed
value for the length. This result allowed us to limit the
depth of the analysis to this value of length. It is im-
portant when using the first two algorithms to predict
future scenarios in an online basis, since it permits to
limit the amount of computation needed to calculate
all the possible future scenarios. In addition, the anal-
ysis of the distribution of the QoE values allowed us
to characterize in advance the amount of users that
might be classified as “unsatisfied”. This information
can be crucial for the service provider in order to im-
prove the service offered or compensate the users who
experiment low QoE of the service.
REFERENCES
Gozdecki, J., Jajszczyk, A., and Stankiewicz, R. (2003).
Quality of service terminology in ip networks. Com-
munications Magazine, IEEE, 41(3):153–159.
Green, W., Lancaster, B., and Sladek, J. (2007). Over-the-
top services. Pipeline, 4(7).
ISO (2015). Iso 9000:2015 quality management sys-
tems — fundamentals and vocabulary. Standard ISO
9000:2015.
Le Callet, P., M
¨
oller, S., and Perkis, A. (2013). Qualinet
whitepaper on definitions of quality of experience.
Seminar report, European Network on Quality of Ex-
perience in Multimedia Systems and Services.
Liao, C.-H., Tsou, C.-W., and Yi-Chung, S. (2015). The
roles of perceived enjoyment and price perception
in determining acceptance of multimedia-on-demand.
International Journal of Business and Information,
3(1).
Petrenko, A., Boroday, S., and Groz, R. (2004). Confirming
configurations in efsm testing. IEEE Transactions on
Software Engineering, 30(1):29–42.
Rivera, D. and Cavalli, A. (2016). Qoe-driven service op-
timization aware of the business model. In 2016 30th
International Conference on Advanced Information
Networking and Applications Workshops (WAINA),
pages 725–730.
Rivera, D., Kushik, N., Fuenzalida, C., Cavalli, A., and Yev-
tushenko, N. (2015). Qoe evaluation based on qos
and qobiz parameters applied to an ott service. In
Web Services (ICWS), 2015 IEEE International Con-
ference on, pages 607–614.
Sandoval, J., Ehijo, A., Casals, A., and Estevez, C. (2013).
New model and open tools for real testing of qoe in
mobile broadband services and the transport protocol
impact: The operator’s approach. In IEEE LATIN-
COM, pages 1–5.
Van Moorsel, A. (2001). Metrics for the internet age: Qual-
ity of experience and quality of business. In Fifth In-
ternational Workshop on Performability Modeling of
Computer and Communication Systems, pages 26–31.
Universit
¨
at Erlangen-N
¨
urnberg, Germany.
An Implementation of a QoE Evaluation Technique Including Business Model Parameters
145
