
Detecting Thermal Emotional Profile
Yang Fu and Claude Frasson
University of Montreal, Department of Computer Science and Operations Research, Montreal, Canada
Keywords: Emotion Recognition, IAPS, Skin Temperature, Thermal Emotional Profile, Machine Learning, EEG, HMM
(Hidden Markov Model), Infrared Camera.
Abstract: Human can react emotionally to specific situations provoking some physiological changes that can be detected
using a variety of devices, facial expression, electrodermal activity, and EEG systems are among the efficient
devices which can assess the emotional reactions. However, emotions can trigger some small changes in blood
flow with an impact on skin temperature. In the present research we use EEG and a thermal camera to
determine the emotional profile of a user submitted to a set of emotional pictures. Six experiments were
performed to study the thermal reactions to emotions, and in each experiment, 80 selected standard stimuli
pictures of 20 various emotional profiles from IAPS (a database of emotional images) were displayed to
participants every three seconds. An infrared camera and EEG were used to capture both thermal pictures of
participants and their electrical brain activities. We used several area of the face to train a classifier for emotion
recognition using Machine Learning models. Results indicate that some specific areas are more significant
than others to show a change in temperature. These changes are also slower than with the EEG signal. Two
methods were used to train the HMM, one is training classifier per the participant self data (participant-
independent), another is training classifier based on all participants` thermal data (participant-dependent). The
result showed the later method brings more accuracy emotion recognition.
1 INTRODUCTION
Research in education, psychology, computational
linguistics, and artificial intelligence acknowledge
that emotions have an effect on learning (Heraz et al,
2007). Many works in that field focus on identifying
learners’ emotions as they interact with computer
systems such as Intelligent Tutoring Systems
(Chaffar et al, 2009) or educational games (Derbali et
al, 2012).
Unfortunately, many of these types of systems
only focus on external behavior like face analysis,
vocal tones and gesture recognition. Most of the time,
psychological methods are used to collect real-time
sensing data. Despite the advances in these methods,
it is still a challenging problem. The effective
emotional state and its assessment lack precision. In
addition, these methods are not applicable in the case
of disabled, taciturn and impassive learners. Today,
researches are directed toward a multi-model system
that can automatically extract physiological signals
changes in addition to vocal, facial or posture changes.
All those features can be combined to detect and
assess emotions.
1.1 Assessing Emotions
To properly interact with the learner, the emotion data
collection methods have evolved from self report
(Anderson, 2001) to facial expression analysis
(Nkambou, 2004), to body posture and gestures
interpretations (Ahn et al, 2007), and to biofeedback
measurements (Heraz et al, 2007, 2009). To increase
the prediction of the emotional and cognitive learner
states, the approaches of combining different kinds of
information collection channels were applied
(Kapoor et al, 2005). Regarding biofeedback
measurement, researches showed that the
Electroencephalograms (EEG) is one of the most
reliable and accurate physiological signal to monitor
the brain activities (Heraz et al, 2007). However, the
wearable EEG devices, such as Q sensor (worn on
wrist), EPOC Neuroheadset (worn on head), or
SomaxisMyoLink (worn on body), also limit the
user’s movement. It will be more convenient if there
is a way to measure emotions noninvasively. In our
research, our goal is to see the relation between the
changes of skin temperature and emotions.
142
Fu, Y. and Frasson, C.
Detecting Thermal Emotional Profile.
DOI: 10.5220/0006007901420151
In Proceedings of the 3rd International Conference on Physiological Computing Systems (PhyCS 2016), pages 142-151
ISBN: 978-989-758-197-7
Copyright
c
2016 by SCITEPRESS – Science and Technology Publications, Lda. All rights reserved

1.2 A New Way to Measure Emotions
Noninvasively
During the past half century, psychologists have
discovered and studied the relationship between skin
temperature and emotion changes (Baker and Tayor,
1954). They have indicated that the skin temperature
is getting lower because of the production of a
constriction of the arterioles when the participants are
under a stressful situation. By testing 27 participants
with 4 negative and 4 positive stimuli, Vos P et al
(2012) found that the skin temperature is higher for
expressing low intensity emotions negative emotions.
Kuraoka and
Nakamura
(2010) measured the nasal
region temperature changes studying emotion in
macaque monkeys. They found temperature
decreased when the monkeys were facing negative
situations. More interestingly, the experiment in the
paper (Ioannou et al. 2013) showed that when a child
felt guilty after breaking a toy, his nose tip cooled off
with more purple color (third picture); and after he
was soothed, the thermal color turned more orange
indicating his nose wormed (fifth picture) (Figure 1).
Figure 1: Five pictures of a child showing the temperature
change of the nasal tip.
In this paper we present an exploratory study of
using thermal camera to detect and assess emotions.
After looking at the functionalities of thermal camera
and their use in the industry, we present the features
of Electroencephalograms devices (EEG), a well
known method for assessing emotions, mental
engagement and workload. Then, we present the
experiments realized with a set of emotional stimuli
and the two devices. We compare the measures
obtained with the two devices to validate thermal
assessments.
2 THERMAL CAMERA
FUNCTIONALITIES
Infrared thermography is a powerful technique for
non-destructive and non-invasive investigation. It has
been applied in building leakage detection (Titman,
2001), in medicine area (Jones, 1998), and even in
accident rescue (Doherty et al., 2007). Because of its
non-invasive and non-destructive nature, the thermal
detection can be rapidly completed, with slight access
efforts and costs. The visibility of the output also can
be interpreted immediately by a skilled practitioner
(Titman, 2001)
.
2.1 Building Leaks
Temperature factors were used to detect where and
how energy leaks from a building’s envelope and
substantiate proposals. The source of the problems
can be revealed accurately and detailed by using IR
thermography. The problems may include improperly
installed or damaged insulation, thermal bridges, air
leakage, moisture damages or cracks in concretes. For
instance, a thermal picture can show a missing
insulation as a light colored patch with distinct edges
(Balaras, 2002).
Figure 2: Thermograph of an interior roof surface with
missing insulation (Balaras et al. 2002).
2.2 Thermal Camera in Medicine
Measuring body temperature is one of the traditional
diagnostic methods in medicine, besides, it is also
applied to measure the outcome of clinical trials.
In recent decades, as a non-invasive and painless
method, thermal imaging technique has been widely
applied to various fields of diagnostic, such as to find
the sites of fractures and inflammations, to recognize
the degree of burn, to detect breast cancer and to
determine the type of skin cancer tumors (Ogorevc et
al., 2015).As Ring et al. (2012) mentioned in their
research, the skin temperature can indicate the
existence of inflammation in underlying tissue
(Figure 3), osteoarthritis, soft tissue rheumatism, and
complex regional pain syndrome (CPRS). A
temperature difference (>= 1 °C) between the
affected and the non-affected limb is one of the
diagnostic criteria of CPRS (Wilson et al. 1996).
Detecting Thermal Emotional Profile
143
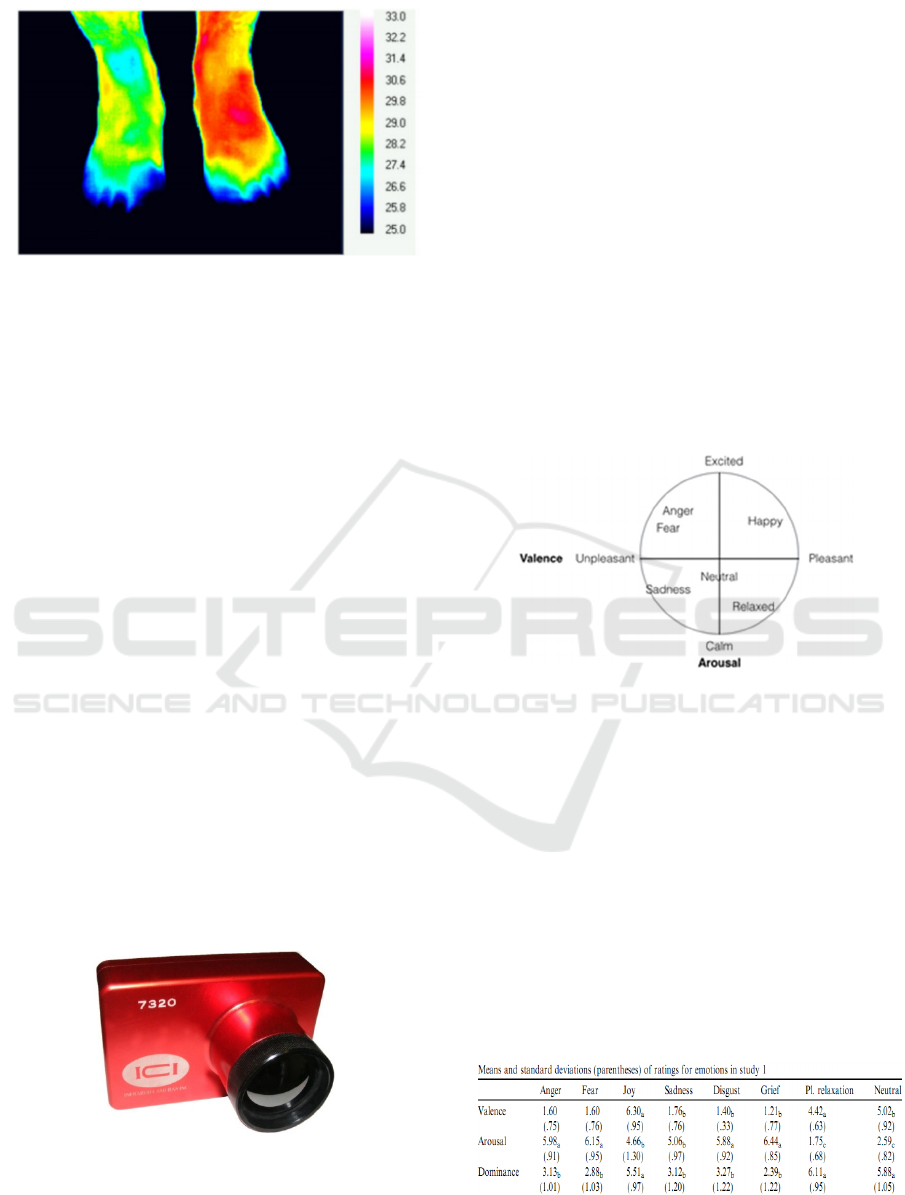
Figure 3: Chronic inflammation of the forefoot following a
sport injury (Ring, 2012).
Studies showed that infrared imaging is also a
powerful tool for clinical testing. Devereaux et al.
(1985) used infrared thermography to quantify joint
inflammation and to assess patients’ response to
therapy of rheumatoid arthritis. By following patients
over 12 months, the researchers found that there are
significant correlations for thermography with other
parameters of disease activity. In recent years, per the
study of Spalding et al. (2008), it was proved that
three-dimensional measures and thermal imaging are
able to measure a high coincidence between high
temperature and swelling of figure joints.
2.3 Using Infrared Camera for Emotion
Detection
2.3.1 Infrared Camera
In our study, we used an infrared camera (ICI 7320)
(Figure 4
)to capture real time thermal images and
provide real time radiometric data streams to hard
device or portable device. The camera is able to give
sensitive and accurate thermal data of arrange of -
20°C to 100°C. Comparing with EEG, because of the
camera’s non-invasive feature, it is easier to set up
and configure.
Figure 4: ICI 7320 Infrared Camera.
2.3.2 Iaps
To know which emotions should be detected we used
a set of emotional pictures as stimuli materials which
have been categorized according to specific emotions.
The Centre for the Study of Emotion and Attention
(CSEA) of the University of Florida developed two
large sets of affective stimuli, IAPS (International
Affective Picture System) and IADS (the
international Affective Digitalized Sound system), to
provide standard materials for emotion and attention
related studies. Based on Osgood (Osgood et al. 1962)
seminal work, IAPS assessed the emotions from three
dimensions: affective valence, arousal and
dominance. In this research, the arousal-valence
model (Figure 5) was used to represent the emotions.
Valence ranges from pleasant to unpleasant and
arousal ranges from calm to excited. Dominance,
which is also called control, is a less strongly-related
dimension. In our experiments, we selected 80 IAPS
pictures from 20 various picture sets for presenting to
participants and measuring their emotional reactions.
Figure 5: Arousal-valence Model.
Emotions considered were: neutral, happy,
sadness, anger, fear, disgust, sadness. To measure
them according to arousal and valence dimensions,
we used the means and standard deviations
(parentheses) of the rating emotion table (Figure 6)
from Panayiotou (2008) research as a standard base
for further machine learning.
Human skin temperature is the product of heat
dissipated from the vessels and organs within the
body, and the effect of environmental factors on heat
loss or gain. To facilitate the detection of emotions by
thermal variations we will focus on five area of the
face, including forehead, nose, mouth, left cheek
and right cheek.
Figure 6: Means and standard deviations (parentheses) of
ratings for emotions (Panayiotou, 2008).
PhyCS 2016 - 3rd International Conference on Physiological Computing Systems
144

Considering that the temperature changes may
require time to display on participants skin, every
picture was displayed three seconds. Meanwhile, to
figure out how the skin temperature is back to a
‘neutral’ status, a non-stimuli picture shows in
between every two IAPS pictures.
The emotional profile, which depends on each
participant, will be based on two parameters: 1) the
rapidity of the thermal changes, and 2) the
temperature change intensity.
2.3.3 Hidden Markov Models
Six students were invited to participate into this study
and they were asked to watch the eighty slide-
showing pictures without any disruption. Thermal
photos were taken every three seconds during the
picture-displaying period. Then the thermal changes
on the five areas of their face (forehead, nose, mouth,
left cheek and right cheek) were trained and classified
with a Hidden Markov Model, in order to obtain the
thermal emotional profiles.
Hidden Markov Models (HMM) are widely used
to find out the joint probability of a collection of
hidden variables and observed variables. It is defined
by a tuple λ=(n, m, A, π, B), where n indicates the
number of hidden states, m indicates the number of
observable states, A is the state transition probability,
B is the emission probability density function of each
state, and π is the initial state probability. In this
research, recognizing emotion from a series of
thermal data over the time is a typical modeling
problem which can take advantage of be resolved by
HMM.
As an emotion state can transfer to any other states,
the state-transition topology of the emotion
recognition model is an ergodic topology (Figure 7).
Then we train the maximum likelihood classifier
using the Baum-Welch algorithm. According to the
classifiers, the hidden states – emotions (neutral,
happy, sadness, disgust, anger, fear, relaxed) can be
computed per the observed states (turn wormer (1),
/colder (2), or no change (0) on nose, on forehead, etc.)
- the thermal change states. Two training methods
were used in our study: one is to train the classifier
with a participant’s self previous data, which was
named as participant-independent training. Another
is to train the classifier based on all other participants’
data, named as participant-dependent method.
Figure 7: Training classifiers using Hidden Markov Model.
3 USING EEG TO MEASURE
EMOTIONS
3.1 Emotiv Classification of Emotions
In many recent researches, EEG (Figure 8) has been
applied to recognize emotions. We also took EEG as
comparison reference to analyze the rapidity and
intensity of thermal signals. Thus EEG signal was
captured at the same time when the participants were
watching the experiment pictures and when the
thermal pictures were recorded.
Figure 8: Emotiv EPOC headset.
EEG detects the electrical signals released by the
brain through a series of electrodes placed. The
brainwaves were categorized into 6 different
frequency bands which named as delta, theta, alpha,
beta1, beta 2 and beta 3 waves (Figure 9.). Two of
them, the alpha (8-12Hz) and beta (12-30Hz) were
concentrated in our research, since alpha waves are
the main indicator for an alert and beta signals are
related to the active state of mind (Bos et al. 2006).
Detecting Thermal Emotional Profile
145
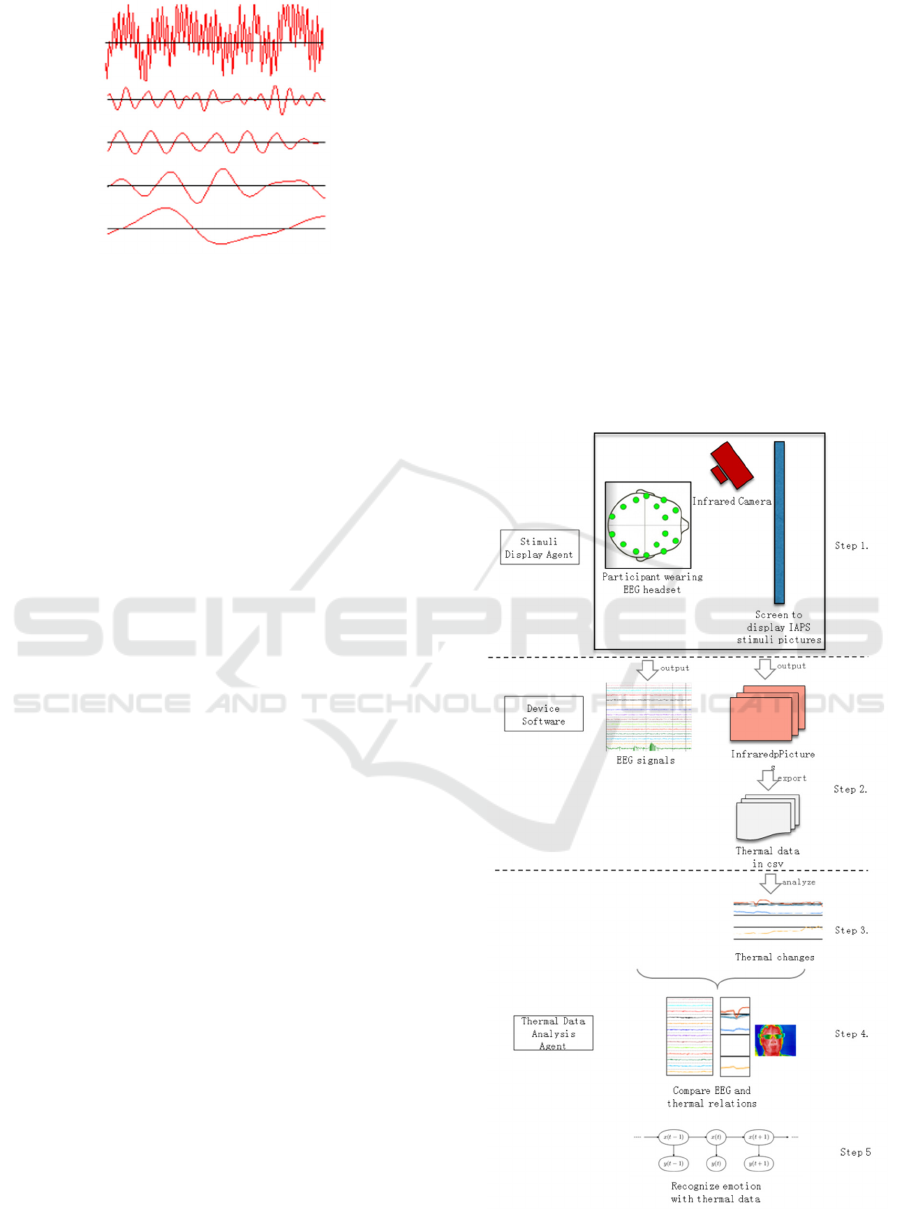
Figure 9: A raw EEG sample and its filtered component
frequencies. Respectively (from the top): Beta, Alpha,
Theta and Delta Brainwaves (Heraz et al. 2009).
3.2 Correlation between Two Measure
Methods
For years, EEG has been used in many researches to
recognize emotions. Murugappan et al. (2009)
combined spatial filtering and wavelet transform to
classify emotions (happy, surprise, fear, disgust, and
neutral). Liu et al. (2010) implemented a real-time
algorithm to recognize six emotions, including fear,
frustrated, sadness, happy, pleasant and satisfied, and
achieved 90% classification accuracy for
distinguishing joy, anger, sadness and pleasure. EEG
was also applied in monitory drivers’ emotional
behavior and help them to adjust their negative
emotions to keep driving safely (Frasson et al. 2014).
Based on the EEG emotion recognition methods
and algorithms, it is more efficient for us to apply the
thermal technique into emotion detection area. We
can also use the HMM or other proved model to
perform classification and detect emotion changes.
The only questions to consider are which thermal
signals to capture, how to tailor the classifier training
model to fit the thermal data processing approach, and
how to check the accuracy of emotion recognition
with thermal signal.
Thus, in our research, the EEG emotion detection
methods were used as important inputs and reference
for the study of applying thermal signal on emotion
reorganization.
4 EXPERIMENT
4.1 Experiment Overview
4.1.1 Experiment Method
As shown in Figure 10, the participants were invited
to watch a series of IAPS stimuli pictures. During the
experiment, an Emotiv EPOC headset (Figure 8) and
an infrared camera (ICI 7320, Figure 4) were used to
respectively capture the real-time
electroencephalogram (EEG) signal and the thermal
pictures of the participants’ faces. After recording
both EEG and thermal pictures, we used the ICI
camera software to export the 640*480 digital
temperature matrix, which means totally 300k
temperature data, in csv format for each infrared
picture. To deal with the numerous thermal data, a
data analysis agent was implemented to detect face
areas, calculate average temperatures, and identify
thermal changes. By comparing the EEG and thermal
changes, we analyzed the thermal emotional profiles
according to rapidity and intensity parameters. The
details of the approach are presented in the next
subsection.
Figure 10: Experiment Method.
PhyCS 2016 - 3rd International Conference on Physiological Computing Systems
146
4.1.2 Experiment Material Selection
The International Affective Picture System (IAPS)
provides the rating of a large set of emotionally-
evocative color photographs across a wide range of
semantic categories. In each picture set (totally 20
picture sets), 60 different IAPS pictures are varied in
valence and arousal ranges. To measure participant’s
emotional reactions distinguishably, we selected 4
various pictures in each picture set and displayed
them 3 seconds each, which means that80 IAPS
pictures were selected. Meanwhile, to measure the
thermal emotional changes when the participant is in
neutral state, a preparation picture writing “Get ready
to watch the next picture” appeared for three seconds
before displaying the next IAPS picture.
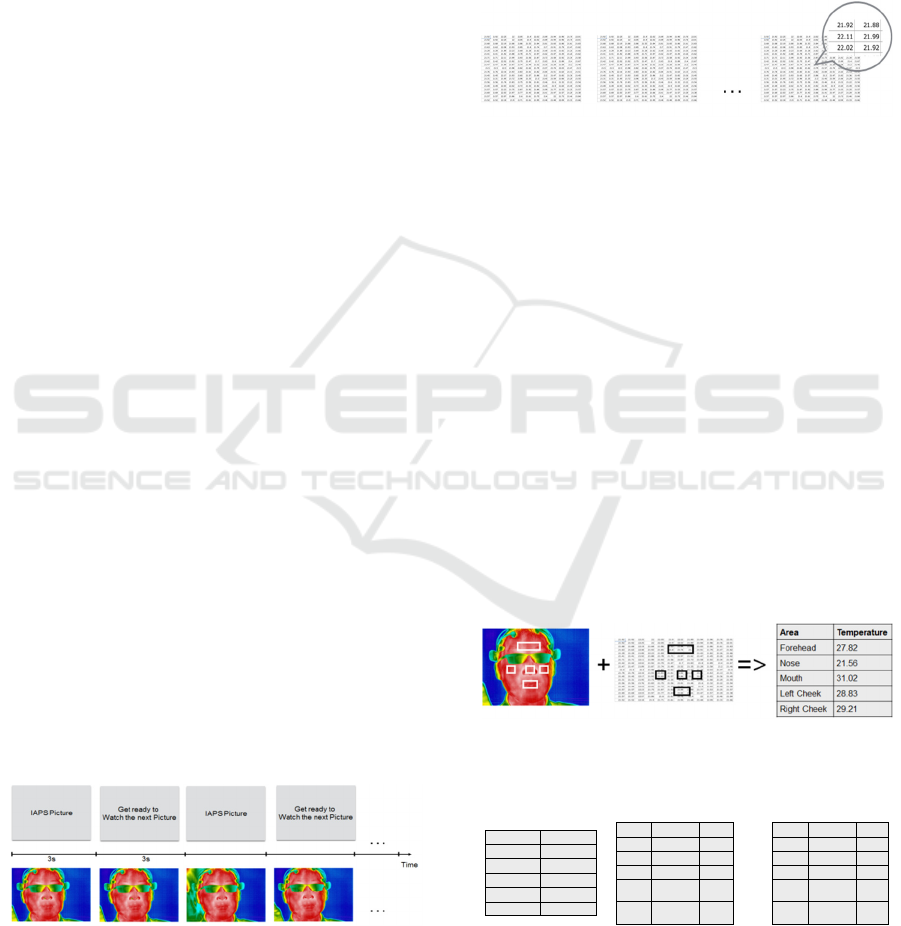
4.2 Experiment Steps
The methodology of the experiment process is
decomposed into five steps indicated below. Two
agents Stimuli Display Agent and Thermal Data
Analysis Agent) are co-working with EEG and ICI
camera software in experiments. The Stimuli Display
Agent was designed to associate the experiment to
record participant info, experiment info and every
pictures displaying time, etc. About Thermal Data
Analysis Agent, it was developed to read thermal
pictures, calculate face five areas temperature, and
analyze thermal changes.
Step 1. Participants View Stimuli Pictures, and
Devices Record EEG Data and Thermal
Pictures. Six experiments were performed one by
one with different participants of similar age and
different gender. We helped every participant to wear
the EEG headset and positioned the IR camera in
front of him/her. After the devices were set properly,
the participant was invited to watch the pictures slide-
showed by the Stimuli Display Agent in a quiet
environment. In the meantime the pictures were
displaying, the EEG data were recorded in real time
and the thermal pictures were taken (refer to the
sample picture in Figure 11) every 3 seconds.
Figure 11: Step 1. The 80 stimuli pictures and 80
preparation-slides were presented each three seconds in
turn. At the same time, the ICI camera was taking thermal
photos every three seconds.
Step 2. Export Temperature Data for Every
Thermal Picture. As mentioned in the Experiment
Material Selection paragraph, in each experiment,
160 pictures were displayed to each participant and a
total of 160 thermal photo accordingly. Later the
thermal pictures were manually exported into related
160 cvs files (as IR Flash Software version 2.13.29.10
only supports exporting thermal matrix into csv file
one by one) (Figure 12).
Figure 12: Using IR Flash Software to export cvs file for
every thermal photo to get 640*480 temperature-matrix.
Step 3. Calculate the Mean Temperatures on Five
Face Areas and Analyze Thermal Changes. The
face location was detected manually and five areas
were focused for further analyzing thermal changes
(Figure 13). Considering that every thermal picture
can generate a 640 * 480 temperature data matrix, the
data volume of 160 thermal pictures reaches almost
50 millions data. To process the data efficiently, an
initial analysis of calculating area average
temperature were performed and the mean values
were recorded instead of saving the huge amount of
raw data into database, performed by the Thermal
Data Analysis Agent. Then the thermal state changes
(Figure 14) were identified. Please note that we
focused more on the temperature changes, not the
absolute temperature value since every human has
different thermal activity, even when they are in the
same environment.
Figure 13: For each thermal photo, find five-areas (forehead,
nose, mouth, left cheek and right cheek) locations, and then
calculate the five-area mean temperatures.
Figure 14: Comparison and extraction features of the
thermal photo series.
Area Temperature
Forehead 27.82
Nose 21.56
Mouth 31.02
Left Cheek 28.83
Right Cheek 29.21
Area Temperature Change
Forehead 27.98 ↑
Nose 20.06 ↓
Mouth 31.62 ↑
Left
Cheek
27.98 ↓
Right
Cheek
28.65 ↓
Area T emperature Change
Forehead 28.02 ↑
Nose 20.56 ↑
Mouth 30.72 -
Left
Cheek
27.76 ↓
Right
Cheek
29.67 ↑
…
The 1
st
Thermal
Picture
The 2
nd
Thermal
Picture
The N
th
Thermal
Picture
Detecting Thermal Emotional Profile
147
Step 4. Compare EGG Emotional Profiles with
Thermal Emotional Profiles. In this step, both EEG
data and thermal changes were compared to analyze
the rapidity and intensity of thermal emotional
profiles (Figure 15). For the EEG data, the beta/alpha
ratio (Fp1 and Fp2) were set as an indicator of the
arousal state, and alpha activities (F3, F4) was used
to recognize valence state (Bos, 2006). Then we use
the thermal change produced in previous step to
compare with the EEG arousal/valence states to
figure out if thermal detection refers to the same
emotional state measured by the EEG.
Figure 15: EEG and Thermal Data Comparison.
Step 5. In this step, we applied Hidden Markov
Model on emotion recognition using thermal data. As
mentioned in subsection 2.3.3,we trained the emotion
classifiers based on participant itself data (named as
participant-independent model) or based on other
participants’ data (named as participant-dependent
model).
For the first model, only current participant’s
thermal signals were taken into account. The thermal
data of the first 60 IAPS pictures and 60 preparation
pictures were used as inputs to train the classifier for
a participant, then the classifier was used to recognize
the emotions when he/she was watching the rest of 20
pictures.
For the second model, the participant-dependent
model, in order to recognize a participant’s emotion
when he/she was watching the stimuli picture, the
classifiers were trained based on the other five
participants’ thermal data, As the training base for the
second model is larger than the first model,
theoretically, the emotion recognition accuracy of the
second model will be better than the first one. In the
next section, the experiment result shows that the
inference is correct.
5 RESULTS AND DISCUSSION
5.1 Thermal Profiles on Face
By assessing all the six experiment results, we found
that generally the nose temperature is lower than
cheek temperature, and normally the left cheek is
cooler than the right cheek which is the same as the
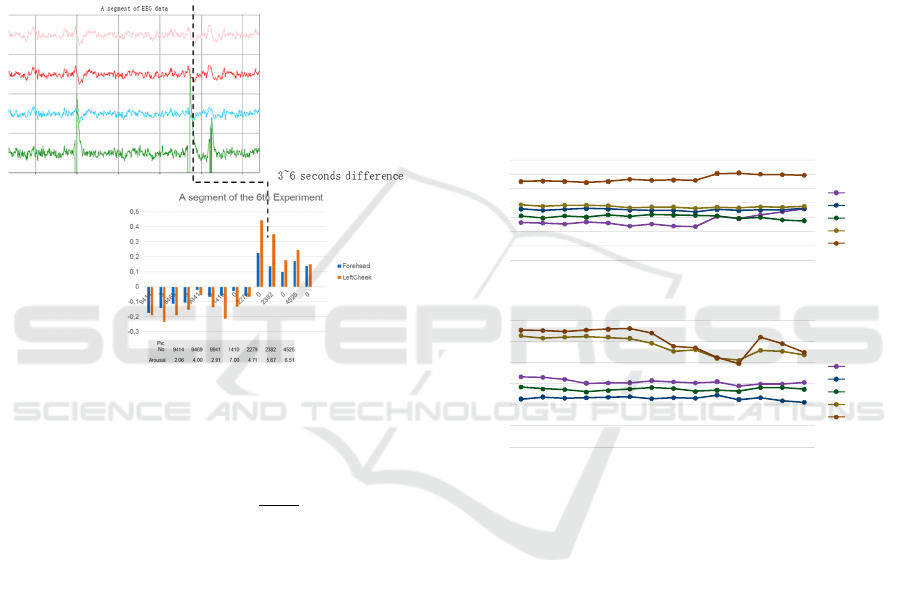
finding of Rimm-Kaufman et al (1996).Figure 16
shows the sub segments of the 2
nd
and 3
rd
experiment.
X indicated the pictures number that the participant
watched (0 refers to the preparation picture) and Y
indicates the temperature.
Figure 16: Two thermal signal charts of the 2
nd
and the 3
rd
experiment, showed that left cheek is cooler than the right.
5.2 Thermal Emotional Profiles:
Rapidity and Intensity
Per the biological theory, the skin temperature
changes because of the stimulation of nervous system,
oxygen to the muscles, heart beat and blood pressure
(Doucleff, 2013). So the skin thermal signal must
appear slower than the brain signals. Then two
questions need us to find answers: How long the
thermal change can reflect on participant’s skin? And
what are the thermal intensities reflecting to different
stimuli materials. In this section, we compare EEG
and thermal data to analyze the emotional profiles
from two dimensions: rapidity and intensity (Figure
17).
37
37.5
38
38.5
39
39.5
40
40.5
9414 0 9469 0 9941 0 1410 0
A segment of 2
nd
Experiment
Forehead
Nose
Mouth
LeftCheek
RightCheek
36.5
37
37.5
38
38.5
39
39.5
9414 0 9469 0 9941 0 1410 0
A segment of 3
rd
Experiment
Forehead
Nose
Mouth
LeftCheek
RightCheek
PhyCS 2016 - 3rd International Conference on Physiological Computing Systems
148
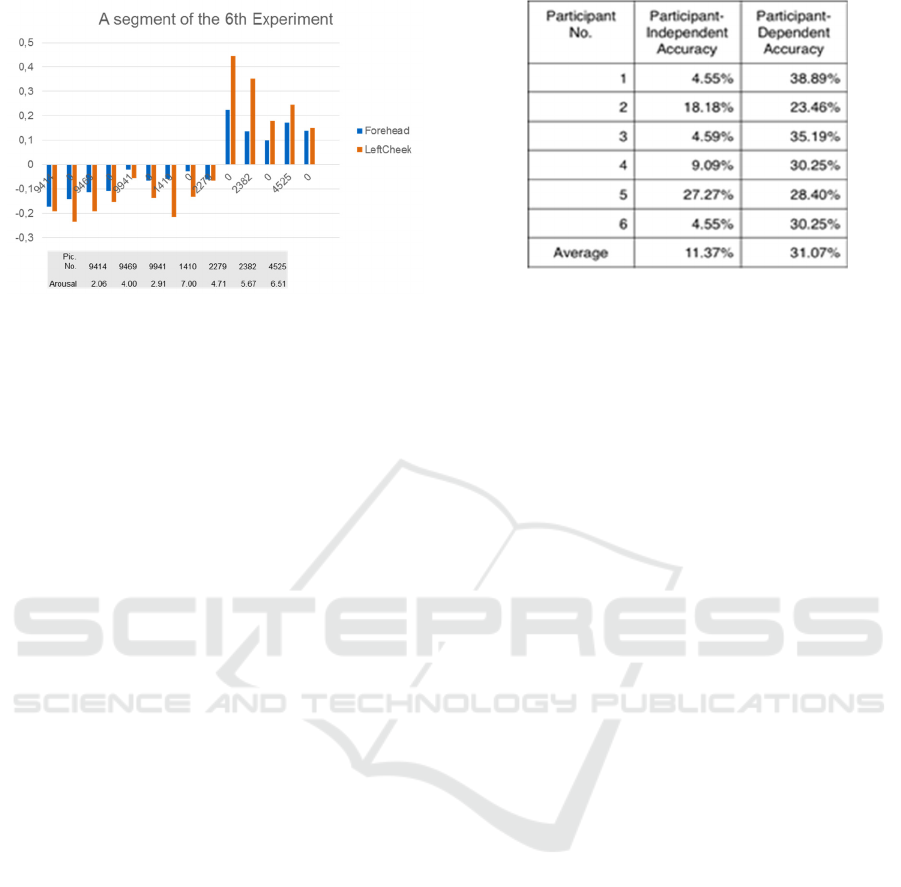
Figure 17: A similar while slower thermal arousal segment
comparing with EEG arousal.
We filtered EEG data, and then used FC6 for
getting the arousal levels and F3/F4 channel for
getting the valence levels (Liu et al. 2010). By
comparing the EEG channel signals with thermal
changes which calculated in the experiment step 3, we
found that around 60% similar thermal arousals on
forehead and left cheek were shown 3 to 6 seconds
after the EEG arousal. In terms of intensity, the
temperature increase were normally within a range of
0.1°C to 0.5°C, and temperature decrease in a smaller
range of 0.05 to 0.3°C, which means the skin
temperature is easier to increase than to decrease.
5.3 Thermal Emotion Recognition
using HMM
As mentioned in the experiment approach section, the
emotion recognition was conducted using participant-
independent and participant-dependent method. The
method of training classifiers is based on the
participant’s first 60 pictures and 60 preparation
slides, and then computing the probabilities and
recognize emotions for the rest of 40
pictures/preparation-slides, is called participant-
independent. For the participant-dependent method,
as the name signifies, one participant’s emotion
likelihood depends on the other participants’
classifications, which means that the classifier
training was based on totally 800 (=160*5) thermal
samples. The results in Figure 18 show that we
achieved higher accuracies with participant-
dependent model, which meets our inference.
Figure 18: The participant-independent and participant-
dependent accuracy table.
From an overall point of view, there are
possibilities to improve the emotion recognition
accuracies to higher rate. The solutions could be to
perform more experiments, to display more IAPS
pictures to train the model, and to replace current
manually indicated five-area locations by detecting
automatically the five-area locations subject to
change.
6 CONCLUSIONS
More experiments could be performed to improve the
HMM classifier training, to enhance the analysis
accuracy, and study the emotion profile differences
by gender or ages. Furthermore, the matching
learning algorithm used in this research could be
applied to recognize the emotion profiles on the other
normative emotional stimuli sets, such as IADS2 (the
International Affective digitized Sounds). More data
analysis can be applied to find which part(s) of skin
temperature can provide more accurate emotion
recognition. Meanwhile, as manually locating faces
on thermal photo is unrealistic in high volume of data
analysis, an automatic face detection method should
be built out to improve the efficiency. Next target also
includes the improvement of our application, Thermal
Profile Analyzer to display both EEG and thermal
signals for replaying the experiment and showing
participant’s emotional analysis result.
ACKNOWLEDGEMENTS
The research presented in this paper has been
supported by funding awarded by the Natural
Sciences and Engineering Research Council of
Canada (NSERC).
Detecting Thermal Emotional Profile
149

REFERENCES
Ahn, Hyung-il, Teeters, Alea, Wang, Andrew, Breazeal,
Cynthia, & Picard, Rosalind. (2007). Stoop to Conquer:
Posture and affect interact to influence computer users'
persistence, The 2nd International Conference on
Affective Computing and Intelligent Interaction,
September 12-14, Lisbon, Portugal.
Anderson, James. (2001). Tailoring Assessment to Study
Student Learning Styles. In American Association for
Higher Education, (53) 7.
Baker, Lawrence M.; Taylor, William M. (1954). The
relationship under stress between changes in skin
temperature, electrical skin resistance, and pulse rate.
Journal of Experimental Psychology, Vol 48(5), Nov
1954, 361-366.
Balaras, C. A., &Argiriou, A. A. (2002). Infrared
thermography for building diagnostics. Energy and
buildings, 34(2), 171-183.
Bos, Danny Oude, (2006). EEG-based Emotion
Recognition, The Influence of Visual and Auditory
Stimuli. Department of Computer Science, University
of Twente.
Chaffar, Soumaya, Derbali, Lotfi, & Frasson Claude.
(2009). Towards Emotional Regulation in Intelligent
Tutoring Systems, AACE World Conference on E-
learning in Corporate, Government, Healthcare&
Higher Education: E-LEARN 2009, Vancouver,
Canada.
Derbali, Lotfi& Frasson, Claude. (2012). Assessment of
Learners’ Motivation during Interactions with Serious
Games: a Study of some Motivational Strategies in
Food-Force. Advances in Human-Computer
Interaction - Special issue on User Assessment in
Serious Games and Technology-Enhanced Learning.
Volume 2012, January 2012. Article No. 5.
Devereaux, M. D., Parr, G. R., Thomas, D. P., &Hazleman,
B. L. (1985). Disease activity indexes in rheumatoid
arthritis; a prospective, comparative study with
thermography. Annals of the Rheumatic Diseases, 44(7),
434-437.
Doherty, Patrick &Rudol, Piotr. (2007) A UAV Search and
Rescue Scenario with Human Body Detection and
Geolocalization, Volume 4830 of the series Lecture
Notes in Computer Science pp 1-13.
Doucleff, Michaeleen. (2013). Mapping Emotions On The
Body: Love Makes Us Warm All Over, Health News
From NPR, December 30, 2013.
Frasson, C., Brosseau, Pierre-Olivier, Thi Hong Dung Tran.
Virtual Environment for Monitoring Emotional
Behaviour in Driving. The 12th International
Conference On Intelligent Tutoring Systems (ITS 2014).
Honolulu, Hawaii. June 5-9, 2014.PDF.
Heraz, Alicia, Razaki, Ryad. & Frasson, Claude. (2007)
Using machine learning to predict learner emotional
state from brainwaves. 7th IEEE conference on
Advanced Learning Technologies: ICALT 2007,
Niigata, Japan, 2007.
Heraz, Alicia, Razaki, Ryad. & Frasson, Claude. (2009)
How Do Emotional Stimuli Influence the Learner's
Brain Activity? Tracking the brainwave frequency
bands Amplitudes. International Conference on Agents
and Artificial Intelligence. ICAART, Jan 2009. Porto,
Portugal.
Ioannou, Stephanos, Ebisch, Sjoerd, Aureli, Tiziana,
Bafunno, Daniela, Ioannides, Helene Alexi, Cardone,
Daniela, Manini, Barbara, Romani, Gian Luca, Gallese,
Vittorio, &Merla, Arcangelo. (2013) The Autonomic
Signature of Guilt in Children: A Thermal Infrared
Imaging Study. Published: November 19, 2013. DOI:
10.1371/journal.pone.0079440.
Jatupaiboon, Noppadon, Pan-ngum, Setha, &Israsena,
Pasin. (2013). Real-Time EEG-Based Happiness
Detection System, The Scientific World Journal, vol.
2013, Article ID 618649, 12 pages, 2013.
doi:10.1155/2013/618649.
Jones, B.F.(1998) A Reappraisal of the Use of Infrared
Thermal Image Analysis in Medicine, IEEE
TRANSACTIONS ON MEDICAL IMAGING, VOL. 17,
NO. 6, DECEMBER 1998, 1019-1027.
Kapoor, Ashish, Ahn, Hyungil, & Picard, Rosalind W.
(2005) Mixture of Gaussian Processes for Combining
Multiple Modalities, in Proceedings of Multiple
Classifier Systems, Eds. N. C. Oza, R. Polikar, J. Kittler,
and F. Roli, 6th International Workshop, MCS 2005,
June 2005, Seaside, CA, pp. 86-96.
Kuraoka, Koji,Nakamura, Katsuki. (2011) The use of nasal
skin temperature measurements in studying emotion in
macaque monkeys. Physiology & Behavior Volume 102,
Issues 3–4, 1 March 2011, Pages 347–355.
Lang, Peter J. (2008). International affective picture system
(IAPS): Affective ratings of pictures and instruction
manual. Technical Report A-8. University of Florida,
Gainesville, FL. Bradley, M.M., & Cuthbert, B.N.
(2008).
Liu, Y., Sourina, O., & Nguyen, M. K. (2010, October).
Real-time EEG-based human emotion recognition and
visualization. 2010 International Conference on
Cyberworlds (CW)(pp. 262-269). IEEE.
Murugappan, M., Nagarajan, R., &Yaacob, S. (2011).
Combining spatial filtering and wavelet transform for
classifying human emotions using EEG Signals.
Journal of Medical and Biological Engineering, 31(1),
45-51.
Nkambou, R.V. (2004). Facial expression analysis for
emotion recognition in ITS. In: ITS’2004 workshop on
Emotional Intelligence proceedings.
Ogorevc, J., Pušnik, I., Geršak, G., Bojkovski, J.,
&Drnovšek, J. (2015). Thermal imaging in medicine.
ZdravniškiVestnik, 84(11), 757-770.
Osgood, C.E. (1962). Studies on the generality of affective
meaning systems. American Psychologist, 17, 10-28.
Panayiotou, G. (2008). Emotional dimensions reflected in
ratings of affective scripts. Personality and Individual
Differences, 44(8), 1795-1806.
Ring, E. F. J., &Ammer, K. (2012). Infrared thermal
imaging in medicine. Physiological measurement,
33(3), R33.
PhyCS 2016 - 3rd International Conference on Physiological Computing Systems
150

Rimm-Kaufman, S. E., & Kagan, J. (1996). The
psychological significance of changes in skin
temperature. Motivation and Emotion, 20(1), 63-78.
Spalding, S. J., Kwoh, C. K., Boudreau, R., Enama, J.,
Lunich, J., Huber, D., .& Hirsch, R. (2008). Three-
dimensional and thermal surface imaging produces
reliable measures of joint shape and temperature: a
potential tool for quantifying arthritis. Arthritis
Research and Therapy, 10(1), R10.
Titman, D. J. (2001), Applications of thermography in non-
destructive testing of structures, NDT & E International,
34(2), 149-154.
Vos, Pieter, De Cock, Paul, Munde, Vera, Petry, Katja,
Noortgate, Wim Van Den , Bea, &Maes B. (2012) The
tell-tale: what do heart rate; skin temperature and skin
conductance reveal about emotions of people with
severe and profound intellectual disabilities? Res Dev
Disabil. 2012 Jul-Aug; 33(4): 1117-27.
Wilson, P R, Low, P A, Bedder, M D, Covigton, W E C,
and Rauck, R. (1996) Diagnostic algorithm for complex
regional pain syndromes Reflex Sympathetic
Dystrophy ed A Re-appraisal, W Jänig and M Stanton-
Hicks (Seattle: IASP Press) pp 93-105.
Detecting Thermal Emotional Profile
151
