
A Hybrid Visualization of the Environment using Smart
Ultrasound-based Sensor Arrays
Emir Sokic, Kenan Softic, Mina Ferizbegovic, Jasmina Zubaca and Melita Ahic-Djokic
Faculty of Electrical Engineering, Sarajevo, Bosnia and Herzegovina
Keywords:
Sensory System, Environment Analysis, Distributed System, Ultrasound, Laser, Sensor, Robotics.
Abstract:
This paper presents the work in progress on the design and testing of a distributed ultrasound-based sensory
system for hybrid 1D and 2D environment visualisation. Many common sensors used in robotics, such as
infrared and ultrasonic sensors, cameras and lasers mainly focus on quantifying distances and shapes, while
rarely have the ability to differentiate among different sensed surfaces/materials. We propose an inexpensive
prototype sensory system based on popular ultrasonic sensors which uses ultrasonic reflections to determine
the acoustic reflection coefficients. This additional feature allows differentiating among sensed objects. More-
over, the developed ultrasonic cells are equipped with a microcontroller for basic signal processing and a
communication link for integration into a sensor network. In this paper, we discuss the possibility of fusing
obtained sensor array data and laser measurements.
1 INTRODUCTION
Probably the most important part of an autonomous
robotic system is a precise and reliable sensing el-
ement. Without sensors, it is extremely difficult
to achieve any type of motion control. Techniques
such as SLAM (simultaneous localization and map-
ping problem) rely on information provided by sen-
sors (Fuentes-Pacheco et al., 2015). Analysis of
the robotic system surroundings is very important
in different areas: industrial robotics (Kaltsoukalas
et al., 2015), medical surgery, space exploration
(Elfes et al., 2006), and autonomous navigation of
unmanned underwater, ground, or air vehicle, just to
name a few.
Different types of sensors are used for environ-
ment analysis: infrared and ultrasonic sensors, (ther-
mal) cameras, lasers etc. Different sensors have dif-
ferent disadvantages: optical sensors are sensitive to
environmental conditions (such as light, rain, fog,
etc.) (Benet et al., 2002), lasers are power-demanding
(Jung et al., 2008) and expensive, RGB cameras can-
not provide information about distance of nearby ob-
jects or object structure on their own (Fern
´
andez et al.,
2007).
In contrast, ultrasonic sensors are cheap, rela-
tively accurate and reliable. These sensors, which are
widely used in robotic systems, flow measurements
(Han et al., 2011), fault detection (D. Champaigne,
2007) and process monitoring (Kim et al., 2011) are
able to assess the structure and solidity of materials
(Grzelak et al., 2014).
Common low-cost solutions, such as the popular
HC-SR04, are ultrasonic sensors primarily developed
for distance measurements. In our previous work
(Zubaca et al., 2015) we have described the design
of an ultrasonic cell which is able to measure the dis-
tance and additionally measure the magnitude of the
reflected ultrasonic wave and differentiate among dif-
ferent materials. In this paper we will briefly present
the ultrasonic cell, while more information may be
found in (Zubaca et al., 2015).
A single ultrasonic cell may be used as a stan-
dalone sensing element. However, using multiple spa-
tially distributed sensors may enrich the information
on the observed environment. Therefore, we pro-
posed and developed a sensor array/network. The
ultrasonic cells communicate on two different buses:
SPI bus used for automatic remote (re)programming
of the cells, and RS485 bus for communication. The
buses are controlled by a master device, which acts
as the in-between element that processes communi-
cation between slave ultrasonic cells and master PC
computer.
One of the final goals of this project is to create
a hybrid multidimensional sensing platform, as illus-
trated in Figure 1. Combining ultrasonic readings
with other sensors (e.g. RGB camera) enables ac-
Sokic, E., Softic, K., Ferizbegovic, M., Zubaca, J. and Ahic-Djokic, M.
A Hybrid Visualization of the Environment using Smart Ultrasound-based Sensor Arrays.
DOI: 10.5220/0006008705730578
In Proceedings of the 13th International Conference on Informatics in Control, Automation and Robotics (ICINCO 2016) - Volume 1, pages 573-578
ISBN: 978-989-758-198-4
Copyright
c
2016 by SCITEPRESS – Science and Technology Publications, Lda. All rights reserved
573
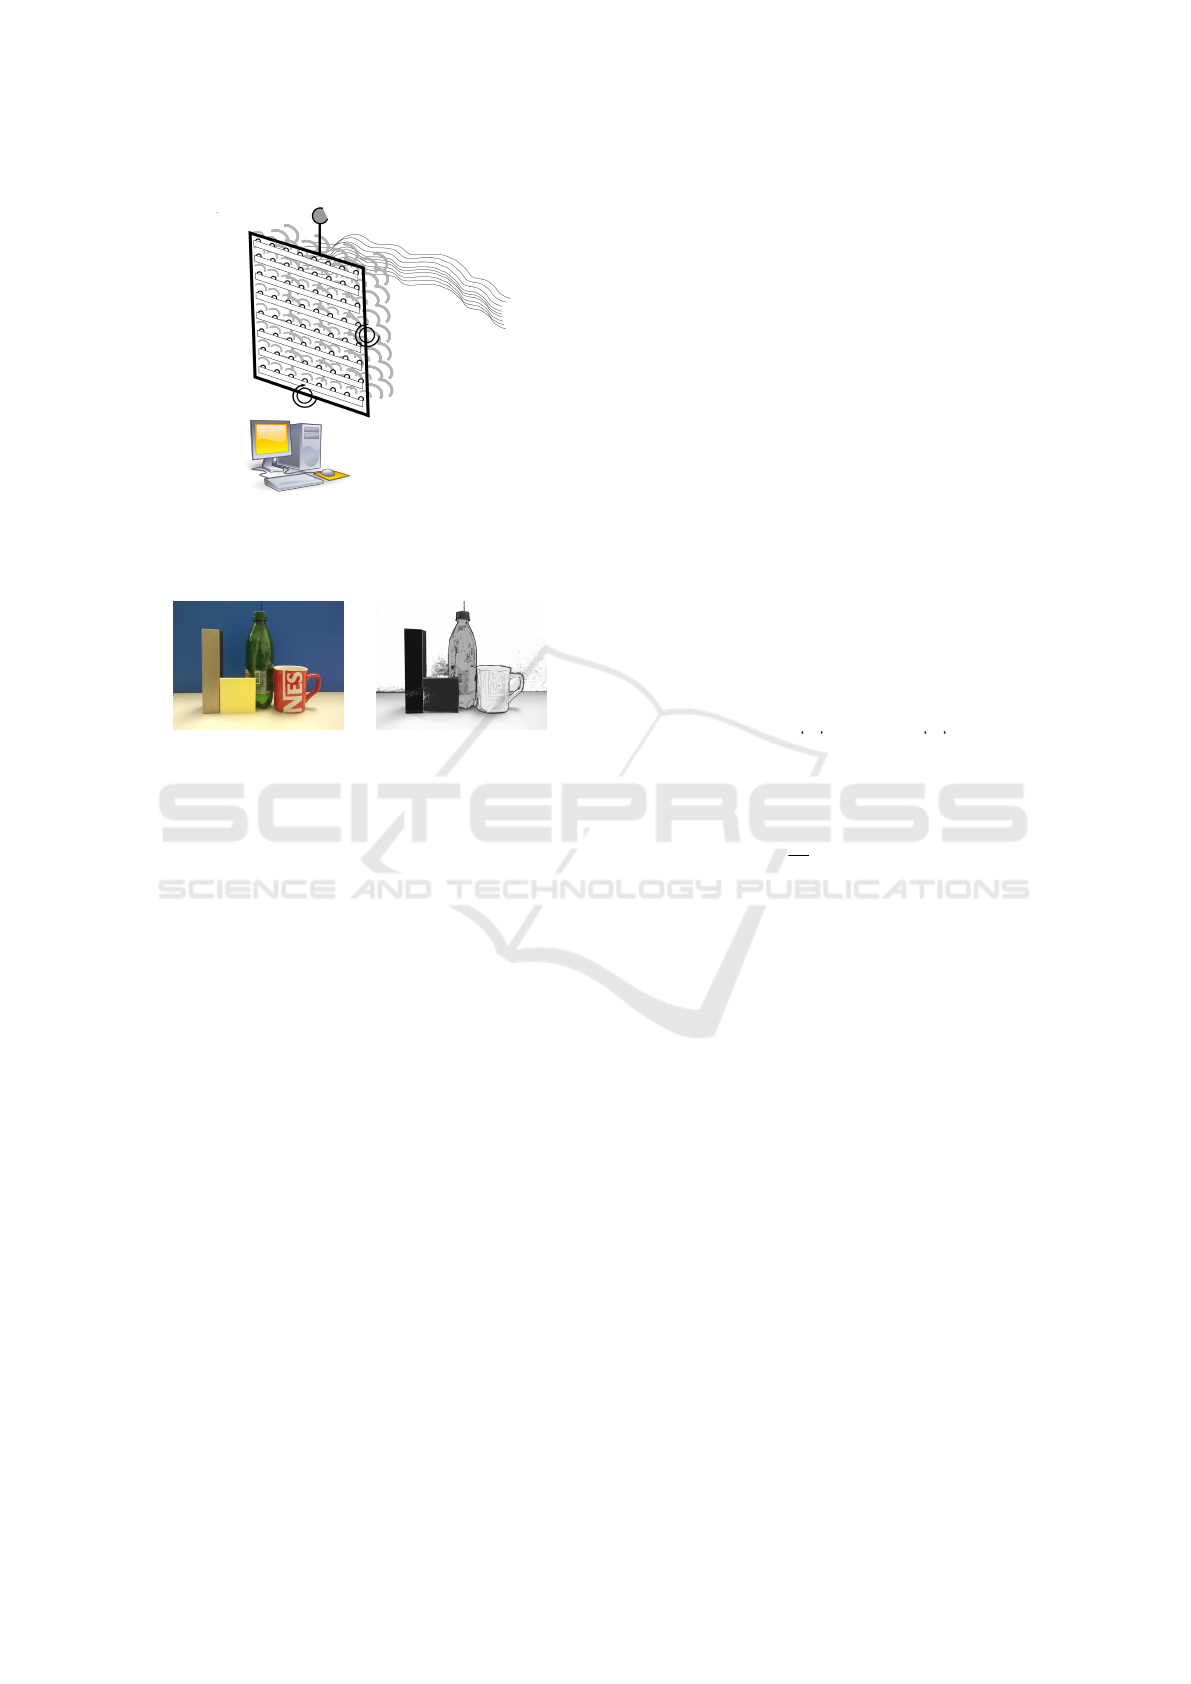
Image fusion
Ultrasonic
transducer
array
Environment
Camera
Figure 1: The hybrid 2D imaging system - ultrasonic cells
and RGB camera. Sensor array is mounted on a platform
with optional two degrees of freedom for an improved spa-
tial coverage.
Figure 2: Left: original RGB image, Right: the expected
structural image (different materials are represented by dif-
ferent gray levels).
quiring a multidimensional informationally-rich im-
age. Every single cell analyses a smaller visual angle,
while an array creates a hybrid image for a wider spa-
tial area. Ideally, using the proposed system one may
obtain images shown in Figure 2. Therefore, objects
with different structure/surface may be represented by
different attributes (e.g. grayscale intensity), which is
the ultimate goal of this research.
Since this paper represents the work in progress,
it is focused on the implementation of 1D array of
ultrasonic cells, which allows obtaining plane maps
of surroundings. Moreover, we have compared and
validated the system measurement results with laser
measurements, and presented a method for data fu-
sion. The RGB image fusion are considered to be the
part of a future work.
The paper is organized as follows. Section II de-
scribes the principles of operation of the ultrasonic
cell. A brief report on the current hardware and soft-
ware organization of the measurement system is given
in Section III, while the experimental results are pre-
sented in the last section, together with conclusions
and guidelines for future work.
2 PRINCIPLE OF OPERATION
Ultrasonic waves emitted from a sound source propa-
gate through the air and when they reach an obstacle
they will reflect back. The time needed for the sound
wave to travel forward and backward can be easily
measured. Under the assumption that the sound speed
is constant, the distance between the source and ob-
stacle is simply computed knowing the time-of-flight.
This is the general principle used for distance mea-
surement (e.g. HC-SR04 sensor).
The reflected sound wave is attenuated due to two
facts: attenuation of sound waves due to the absorp-
tion in air, and due to the absorption of the obstacle
itself. Therefore, if the distance from the obstacle is
known, then it is possible to determine its acoustic
reflection coefficient. In other words, two different
obstacles at a same distance will reflect sound waves
with different magnitudes.
As derived in the paper (Zubaca et al., 2015), a
simplified sound propagation model may be described
using:
A
r
= A
0
|{z}
initial
· e
−αd
| {z }
f light
· R
|{z}
re f lection
· e
−αd
| {z }
f light
, (1)
= A
0
· R · e
−2αd
, (2)
= A
0
· R · 10
−B·2·d/10
, (3)
⇒ R =
A
r
A
0
10
B·2·d/10
, (4)
where A
r
and A
0
represents the magnitudes of the re-
flected and transmitted waves respectively, R is the
reflection coefficient of the material, d is the distance
between the obstacle and the ultrasonic sensor, while
B = 10α represents the attenuation of the ultrasonic
wave in the air, which includes the losses induced by
voltage-sound conversion, temperature, pressure and
humidity (Vladi
ˇ
sauskas and Jakevi
ˇ
cius, 2004).
3 SYSTEM DESIGN
The proposed distributed system consists of three
parts: array of ultrasonic cells, master device and
communication controller and a master processing
software on a PC.
3.1 Smart Sensor - Ultrasonic Cell
A block-structure of the developed ultrasonic cell is
provided in Figure 3, while its physical realisation is
given in Figure 4. The ultrasonic cell is based around
an Atmel ATmega328p controller and the UTT4016
ultrasonic transceiver.
ICINCO 2016 - 13th International Conference on Informatics in Control, Automation and Robotics
574
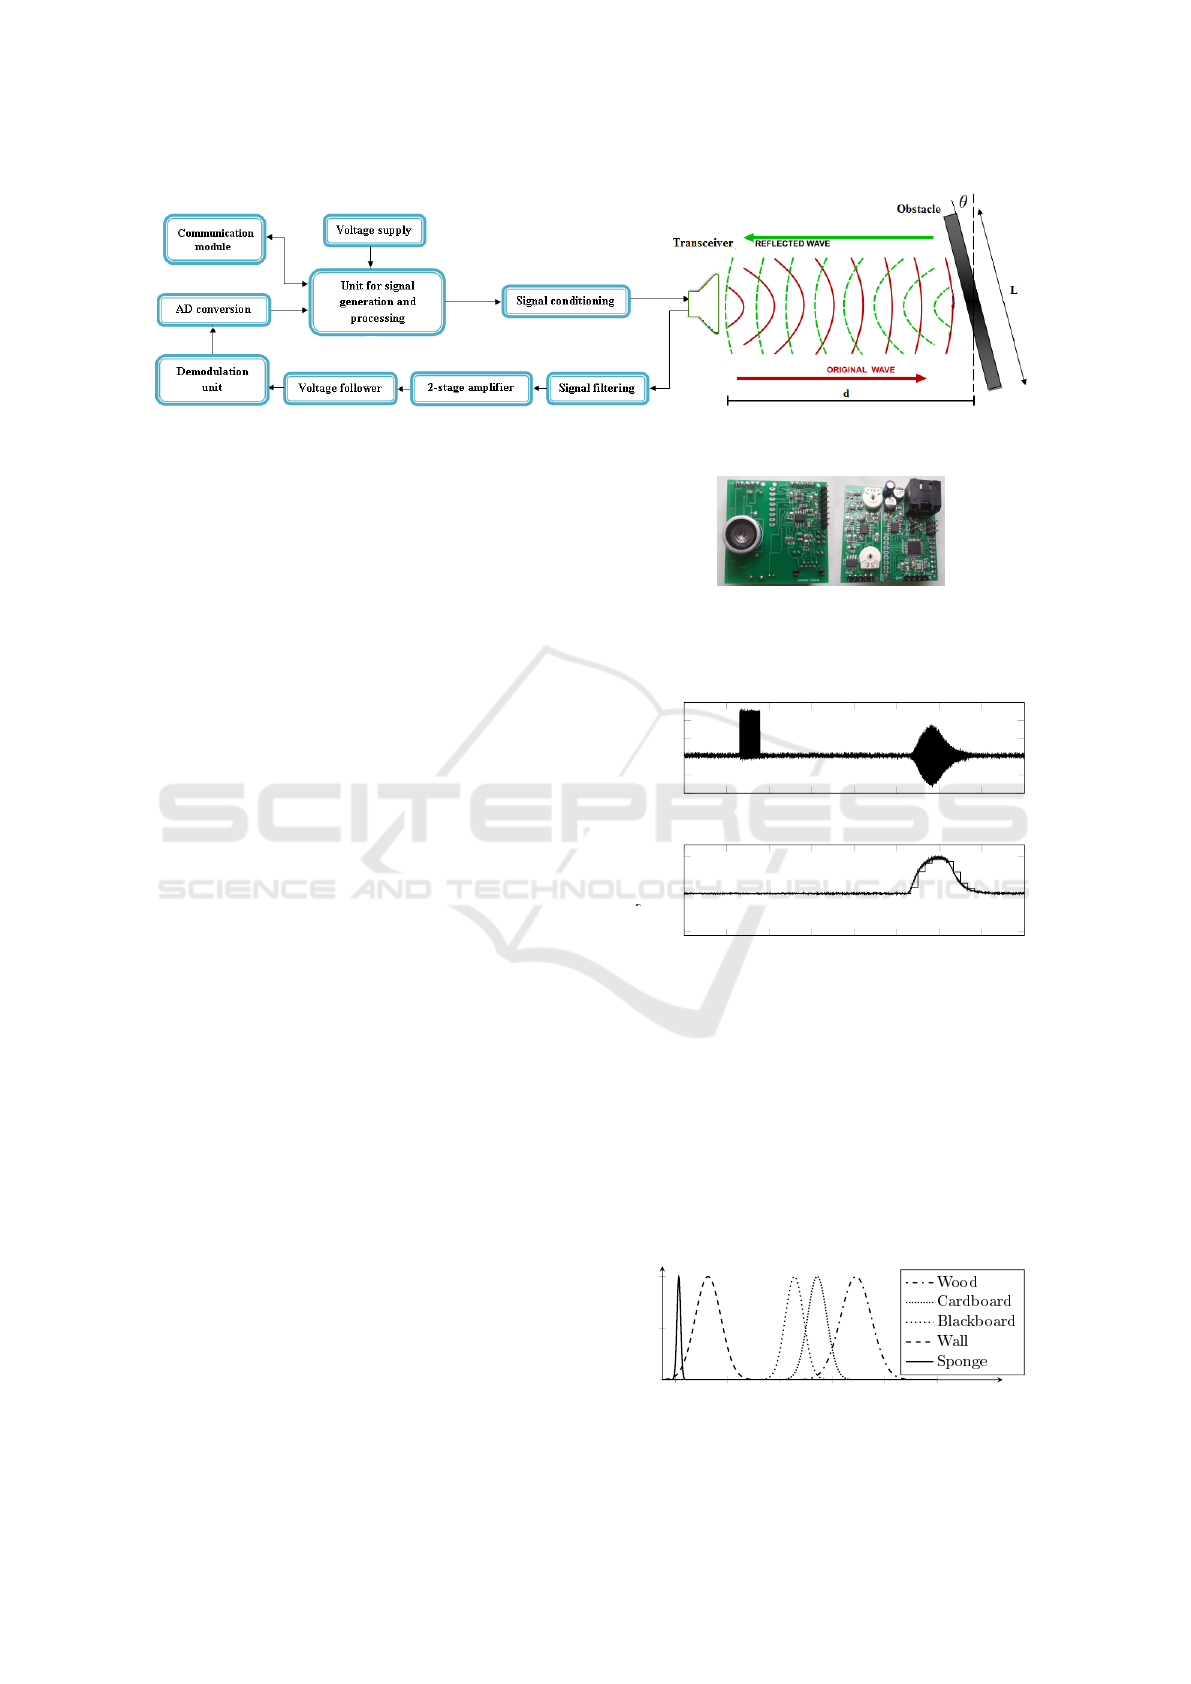
Figure 3: Ultrasonic cell structure.
The MCU is used for exciting the transceiver, sim-
ple preprocessing of received sound signals and estab-
lishing communication between a master PC and the
ultrasonic transceiver.
The transceiver sends and receives ultrasound on
40kHz central frequency.
The master PC sends requests to the MCU over a
RS485 bus to generate square wave signals, typically
bursts with duration of 0.5ms. These bursts are con-
verted to sine waves using band-pass filtering prop-
erties of the ultrasonic transceiver. Then, sinusoidal
waves are emitted from the transceiver, and received
back. Signal filtering and amplification is conducted
on the board. In order not to violate the Nyquist-
Shannon theorem related to the maximal MCU AD
converter signal sampling rate (6kHz), the amplified
voltage signals with central frequency 40kHz are de-
modulated to the [0 − 2kHz] band. The MCU samples
and processes the demodulated signal with 6kHz sam-
pling rate, estimates the magnitude of the reflected
signal, and sends it back to the PC in real-time. The
estimation is based on truncated Whittaker-Shannon-
Kotelnikov series (Ye and Song, 2012):
U
D
(t) =
N
∑
k=−N
U
S
(kT )sinc(2ω
C
(t − kT )), (5)
where sinc(t) = sint/t for t 6= 0 and sinc(0) = 1,
2N + 1 represents the number of samples, T is the
sampling period, and ω
C
is the band-limit of the de-
modulated signal. Our setup used N = 50 samples,
which resulted in the maximal error of 5.6% over the
full scale range. Typical on-board signals are pre-
sented in Figure 5.
Experimentally obtained mapping of the reflec-
tion coefficients for some common materials/objects
is presented in Figure 6 (from (Zubaca et al., 2015)).
3.2 Master Controller and
Communication Module
The master controller and communication module is
designed to be an interface between the PC and re-
Figure 4: Physical implementation of the ultrasonic cell.
The dimensions of the cell are 5x5 [cm], with the possibil-
ity of reducing the dimensions to 2.5x5 [cm] by cutting and
stacking the two segments of the PCB on top of each other.
3 4 5 6 7 8 9 10 11
−4
−2
0
2
4
6
U
ER
[V ]
3 4 5 6 7 8 9 10 11
−1
0
1
t[ms]
U
D
U
S
[V ]
Figure 5: Signals generated and received by the transceiver
(U
ER
), the demodulated signal (U
D
) and discrete-time sam-
pled demodulated signal (U
S
) processed by the MCU.
mote ultrasonic cells. It consists of a master con-
troller and communication bus. The structure of the
proposed system is depicted in Figure 7.
The master controller is essentially an Atmel AT-
mega2560 microcontroller which is primarily used to
activate slave select (SS) pins and provide SPI func-
tionality to a remote PC during cell programming. It
0 0.2 0.4 0.6 0.8 1
0
0.5
1
R
Figure 6: The dispersion of the reflection coefficient R for
different materials.
A Hybrid Visualization of the Environment using Smart Ultrasound-based Sensor Arrays
575
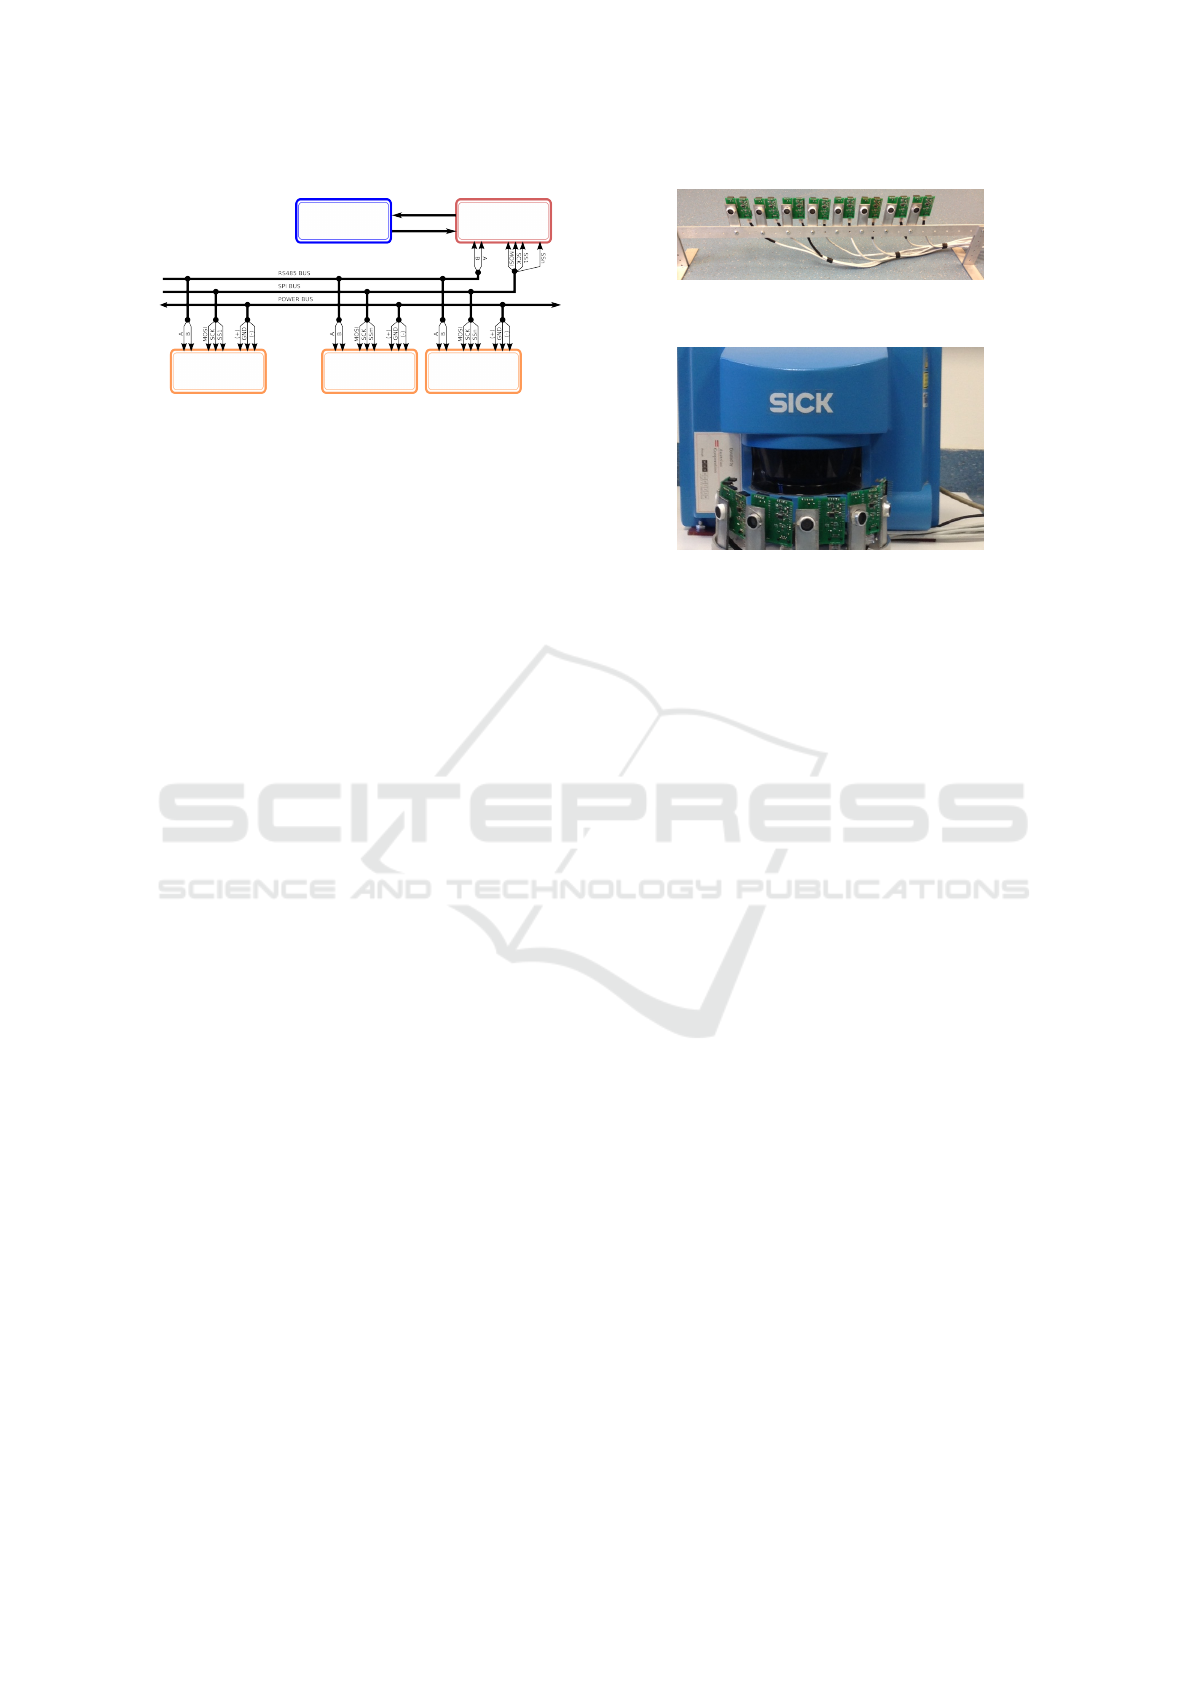
U.Cell 1 U.Cell m U.Cell n
Master
controller
PC
Figure 7: The topology of the distributed sensory system.
is connected with the PC using both USB and RS485
bus. In theory, based on the number of available pins,
this controller can program up to 50 ultrasonic cells.
In order to control, optionally (re)program and
power the ultrasonic cells, a hybrid 8-pin bus was
used. It consists from: 1. communication bus based
on RS-485 standard (2 pins), 2. programming bus
which uses SPI communication (3 pins), and 3. the
power line provided from a bipolar 10-15V power
supply (3 pins). It is interesting that in order to
use standard 8-pin Ethernet connectors and cables,
the MISO line is excluded from the SPI bus, there-
fore reducing the needed number of wires from 9
to 8. This means that cell programming is executed
”blindly”, and that the reprogrammed cell itself must
report that it is successfully programmed. In case of
any malfunction, the user may use the ICSP connec-
tors equipped with 4 pin SPI bus directly available on
the ultrasonic cell PCB.
3.3 Software on PC
In order to effectively control and test the ultrasonic
cell array, a suitable software application needed to
be developed. Currently, the graphical user interface
(GUI) of the developed application in MATLAB is
not finished nor fully interactive. However, most of
the 1D visualisation functions, definitions and dis-
positions of sensors, real-time communication with
remote ultrasonic cells, replication of obstacles and
simple data fusion are implemented as scripts and ac-
cessible using command line. Screenshots from im-
plemented measurement indications are shown in Fig-
ures 10 and 11.
4 EXPERIMENTAL SETUP AND
DISCUSSION
In this paper we will focus on discussing a part of ex-
perimentally obtained data using the designed 1D ul-
trasonic ultrasonic array (with up to 8 sensors), and
Figure 8: Physical disposition of an ultrasonic array - linear
mode.
Figure 9: Physical disposition of an ultrasonic array - circu-
lar mode.
pinpoint the advantages and drawbacks of the de-
signed system.
In order to test the functionality of the system, the
ultrasonic cells are spatially aligned into two typical
dispositions: linear (Figure 8) and circular (Figure 9).
Sick LMS220 Laser system was used for verifi-
cation of the measurement results, as well as image
fusion. It has angular resolution up to 0.25 degree,
although the measurement are re-sampled with 2 de-
grees resolution for easier view. The laser connects
directly to the master PC via USB/RS232 converter.
4.1 Linear Sensor Disposition
Figure 10 depicts one interesting demonstration setup,
where sensors are distributed 10cm apart on a straight
line parallel to a two material obstacle (wood and
plasterboard). Despite their significant directivity and
very narrow beam angles (around 3 to 5 degrees),
each sensor is able to relatively accurately detect the
presence and distance of the obstacle set around 80cm
from the sensors. In addition, they provide the re-
flection coefficients of their sensed obstacle, which is
computed using the distance of the obstacle and the
magnitude of the reflected signal (Equation (4)).
For viewing purpose, the measurement (distance,
reflection coefficient)=(d
i
,R
i
) of i − th sensor (i =
1,...8) positioned at location (x
i
,y
i
) is visually pre-
sented using the following rules:
• each measurement d
i
is marked with a circle C
i
positioned at location (x
i
,d
i
),
• the circle C
i
is shaded using the value R
i
(zero
means completely acoustically absorptive, and
one means completely reflexive surface)
ICINCO 2016 - 13th International Conference on Informatics in Control, Automation and Robotics
576

• the thick segments that connect circles C
i
and C
i+1
are given in parametric form x = (1 −t)x
i
+tx
i+1
and y = (1 − t)d
i
+ td
i+1
, and shaded using the
function r(t) = R
i
(1 −t) +R
i+1
t where 0 ≤ t ≤ 1,
• if the measurements obtained from ultrasound or
lasers are out of figure viewing range, the mea-
surement are clipped for simpler representation.
It is visible from Figure 10 that ultrasonic sensors
readings are quite informative and provide a very sim-
ilar representation of the actual scenario. The obsta-
cle is visible and its left and right side are represented
by different reflection coefficients, therefore they may
indicate different materials. This type of information
may be of significant importance for an autonomous
robotic system (e.g. parking sensors, navigation and
mapping, material inspection etc.).
4.2 Circular Sensor Disposition
Another specific experiment is demonstrated in Fig-
ure 11. The sensors are spatially distributed on a
semi-circle, 25 degrees apart. A solid wooden obsta-
cle is positioned at the same distance as in the first
experiment (80cm from the laser).
Due to the relatively poor angular resolution of the
sensor array, in cases such as one depicted on Figure
11 it is possible that only a small number of sensors
detect the obstacle. Nevertheless, using data fusion
of ultrasonic readings with laser reading, the obtained
results may be used to enrich the visual representa-
tion of laser readings only. The principal idea is to
map sensor readings onto the laser measured contour.
The algorithm is formulated similarly to the case of
linearly arranged sensors:
• each measurement d
i
from sensor positioned at
(x
i
,y
i
) and rotated for α
i
is marked with a cir-
cle C
i
positioned at location (x
i
+ d
i
cos(α
i
),y
i
+
d
i
sin(α
i
)) = (xL
i
,yL
i
),
• the circle C
i
is shaded using the value R
i
,
• for each of the measurements from the
laser (angle,distance)=(β
j
,d
j
) where
j = 1...(max.laser.angle/ang.resolution), sets
of corresponding indices i and j are found such
that |α
i
− β
j
| is minimal. The latter set shall
be denoted as J = { j
1
, j
2
,..., j
n
} where n is the
number of used sensors.
• for each part of the laser obtained contour which
lies between points j
k
and j
k+1
where k = 1,...n
(in total s = j
k+1
− j
k
number of segments), ev-
ery smaller segment < j
p
, j
p+1
> is drawn by a
thick line and linearly shaded using the interpo-
lation r(t) = R
j
p
(1 − t) + R
j
p+1
t = (R
j
k
+ ((p −
k)/s)∗(R( j
k+1
)−R( j
k
))(1−t)+(R
j
k
+((p−k +
1)/s) ∗ (R( j
k+1
) − R( j
k
))t where 0 ≤ t ≤ 1,
• if the measurements obtained from ultrasound or
lasers are out of figure viewing range, the mea-
surement are clipped for simpler representation.
The visual interpretation of fused laser and ultra-
sonic data derived using the latter algorithm are pre-
sented in Figure 11.
4.3 Discussion and Guidelines for
Future Work
The system proposed hybrid ultrasound-based sen-
sory has great potential for creating informationally
rich images of the environment, especially when dif-
ferentiating surfaces or structure of objects. Never-
theless, additional improvements need to be made.
As for the hardware, the burst length, amplifica-
tion levels and calibration of ultrasonic cells needs to
be investigated more thoroughly. Additional mech-
anisms that allow motions of the sensor platform,
in combination with a suitable algorithm which ex-
ploits the possibility of ”single cell sender - multiple
cells receivers” concept would certainly compensate
the drawbacks of ultrasonic cells (such as directivity).
Moreover, adding horns to sensors would change the
amplification and directivity of the cells.
The visualisation software needs to be improved,
in order to allow easy user interaction (adding sen-
sors, obstacles, display measurements etc.). In addi-
tion, the RGB camera readings and readings from a
2D ultrasonic array needs to be fused.
ACKNOWLEDGEMENTS
This research is conducted as part of the project ”A
hybrid 2D visualization of the environment using ul-
trasonic reflections”, funded by the Federal Ministry
of Education and Science Bosnia and Herzegovina.
REFERENCES
Benet, G., Blanes, F., Sim
´
o, J. E., and P
´
erez, P. (2002).
Using infrared sensors for distance measurement in
mobile robots. Robotics and autonomous systems,
40(4):255–266.
D. Champaigne, Kevin andSumners, J. (2007). Low-power
electronics for distributed impact detection and piezo-
electric sensor applications. Aerospace Conference,
9:3911–3919.
Elfes, A., M. Dolan, J., Podnar, G., Mau, S., and Marcel,
B. (2006). On generating the motion of industrial
A Hybrid Visualization of the Environment using Smart Ultrasound-based Sensor Arrays
577
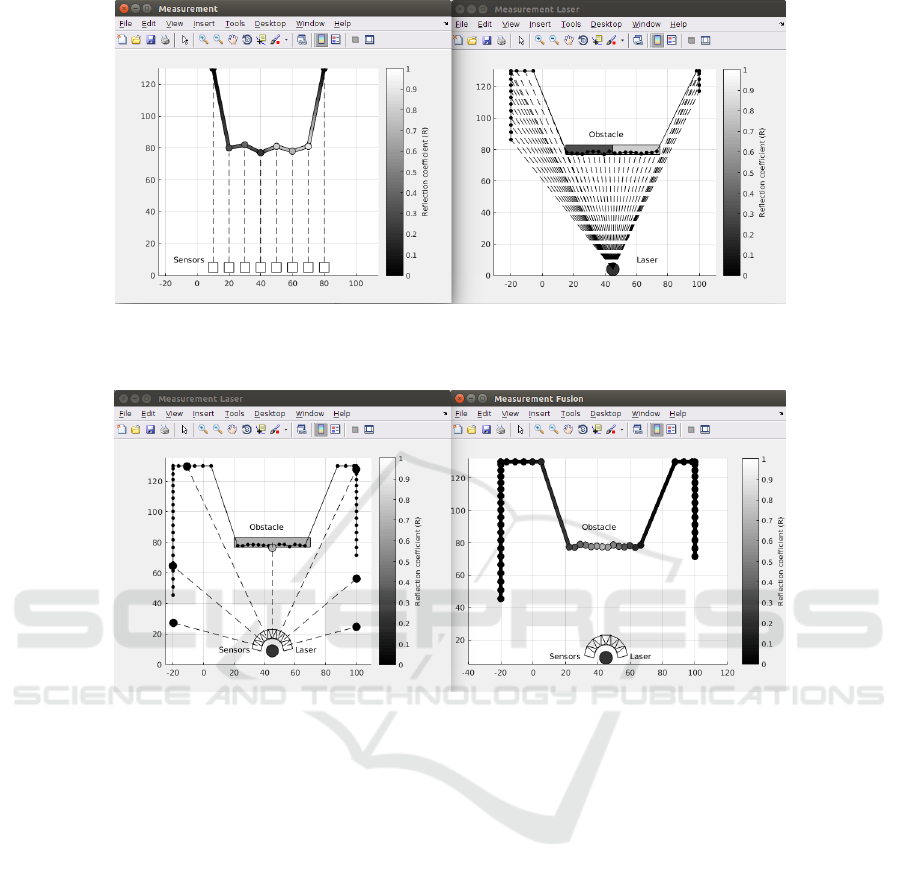
Figure 10: Left: visualisation of measurement results obtained by linearly dispositioned ultrasonic cells, Right: visualisation
of laser measurements and presentation of the actual obstacle. Different grayscale tones are used for depicting the determined
reflection coefficient.
Figure 11: Left: visualisation of measurement results obtained by circularly positioned ultrasonic cells, laser measurements
and reconstruction of actual obstacle. Right: Fusion of laser and ultrasonic data. Different grayscale tones are used for
depicting the extrapolated reflection coefficient.
robot manipulators. Safe and efficient robotic space
exploration with tele-supervised autonomous robots,
1:104–113.
Fern
´
andez, I., Mazo, M., L
´
azaro, J. L., Pizarro, D., Santiso,
E., Mart
´
ın, P., and Losada, C. (2007). Guidance of a
mobile robot using an array of static cameras located
in the environment. Autonomous Robots, 23(4):305–
324.
Fuentes-Pacheco, J., Ruiz-Ascencio, J., and Rend
´
on-
Mancha, J. M. (2015). Visual simultaneous localiza-
tion and mapping: a survey. Artificial Intelligence Re-
view, 43(1):55–81.
Grzelak, S., Czok
´
ow, J., Kowalski, M., and Zieli
´
nski,
M. (2014). Ultrasonic flow measurement with high
resolution. Metrology and Measurement Systems,
21(2):305–316.
Han, X., Wang, J., Peng, Z., and Zhang, J. (2011). A
study of ultrasonic flowmeter in ship piping leakage
detection system. Intelligent Systems and applications
(ISA), 1:769–773.
Jung, H. G., Cho, Y. H., Yoon, P. J., and Kim, J. (2008).
Scanning laser radar-based target position designation
for parking aid system. Intelligent Transportation Sys-
tems, IEEE Transactions on, 9(3):406–424.
Kaltsoukalas, K., Makris, S., and Chryssolouris, G. (2015).
On generating the motion of industrial robot manipu-
lators. Robotics and Computer-Integrated Manufac-
turing, 32:65–71.
Kim, D.-H., Yang, B.-S., and Lee, S.-B. (2011). 3d boiler
tube leak detection technique using acoustic emission
signals for power plant structure health monitoring.
Prognostics and System Health Management Confer-
ence, 1:256–263.
Vladi
ˇ
sauskas, A. and Jakevi
ˇ
cius, L. (2004). Absorption of
ultrasonic waves in air. Ultragarsas, 1:50.
Ye, P.-x. and Song, Z.-j. (2012). Truncation and aliasing er-
rors for Whittaker-Kotelnikov-Shannon sampling ex-
pansion. Applied Mathematics-A Journal of Chinese
Universities, 27(4):412–418.
Zubaca, J., Ferizbegovic, M., Softic, K., Sokic, E.,
and Ahic-Djokic, M. (2015). Design of a dis-
tributed ultrasound-based sensory system. In Informa-
tion, Communication and Automation Technologies
(ICAT), 2015 XXV International Conference on, pages
1–6. IEEE.
ICINCO 2016 - 13th International Conference on Informatics in Control, Automation and Robotics
578
