
FACTS: Fuzzy Assessment and Control for Temperature Stabilization
Regulating Global Carbon Emissions with a Fuzzy Approach to Climate Projections
Bernardo A. Bastien Olvera
1
and Carlos Gay y Garcia
1,2
1
Programa de Investigaci
´
on en Cambio Clim
´
atico, Universidad Nacional Aut
´
onoma de M
´
exico,
Ciudad de M
´
exico, Mexico
2
Centro de Ciencias de la Atm
´
osfera, Universidad Nacional Aut
´
onoma de M
´
exico, Ciudad de M
´
exico, Mexico
Keywords:
Climate Change, Temperature Stabilization, Carbon Emissions, Fuzzy Logic, Fuzzy Inference System, Neural
Network.
Abstract:
This work presents a new approach for assessing the climate system and for stabilizing the temperature and
other climate parameters. FACTS, as we call it, is a fuzzy inference system that overview certain climate state,
and is able to generate the CO2 emissions reduction needed to implement in order to stabilize the temperature.
FACTS was constructed using a neural network optimization process along with data generated by a classical
emissions pathfinder. Then, it was embedded in MAGICC6, a simple climate model that was forced by the
four Representative Concentration Pathways until and ultimately stabilized by the proposed methodology.
1 INTRODUCTION
In the process of understanding and modelling the cli-
mate system is involved a trade-off between resolu-
tion, computational efficiency and focus on individ-
ual parameters. Every level of complexity for climate
models has its own benefits and the choice of using
one or another depends on the purpose of the study.
Simple climate models such as MAGICC (Mein-
shausen et al., 2011) could emulate complex three-
dimensional coupled atmosphere-ocean general cir-
culation models (AOGCMs), and focus on just some
specific parameters and on their effects on climate.
This simple models alongside with clear climate
goals, are very useful for policy-makers to easily
asses the impacts of possible green-house gases emis-
sions. The current climate target is to stabilize the
surface temperature well bellow 2
◦
C above preindus-
trial levels (UNFCC, 2015).
A methodology to reach a long-term temperature
target is to discover, build up, or imagine the path-
ways that could lead to the stabilization (Garg et al.,
2014; Belenky, 2015; Rogelj et al., 2013) and try
to adjust the real emissions rate to one of the possi-
ble stabilization routes (UNEP, 2015) . Meinshausen
et al. (2005) created SiMCaP, an algorithm that is
able to find multi-gas emissions pathways that stabi-
lize the temperature (using the MAGICC 4.1 model)
through a trial and error selection process of existing
economically-feasible scenarios in the literature and
an extrapolation to other gases using an equal quan-
tile way.
We used the ANFIS structure (Shing and Jang,
1993) to create and optimize our model. Particu-
larly in this study, we used the CO
2
stabilization
routes given by SiMCaP to relate each year emissions
growth or decrease, to the climate variables of the pre-
vious year through a sugeno-type fuzzy inference sys-
tem. The fuzzy inference system learnt rules based in
a neural network optimization process, in order to cre-
ate a mean global temperature control that is function
of just climate variables.
The ’Fuzzy Assessment and Control for Tempera-
ture Stabilization’ (FACTS) that we propose has great
advantages in terms of its capability for creating path-
ways independently of preconceived scenarios in lit-
erature. Its fuzzy nature is able to absorb the uncer-
tainty associated to the input climate variables, and
the simplicity of its mathematical structure allows to
insert FACTS into different simple climate models in
order to reach the temperature stabilization in real-
time mode while running the model.
Moreover, FACTS perform a fuzzy assessment of
the climate state at every time-step, through the eval-
uation of the membership degree of certain climate
parameters to fuzzy sets defined linguistically. This is
Olvera, B. and García, C.
FACTS: Fuzzy Assessment and Control for Temperature Stabilization - Regulating Global Carbon Emissions with a Fuzzy Approach to Climate Projections.
DOI: 10.5220/0006011603570362
In Proceedings of the 6th International Conference on Simulation and Modeling Methodologies, Technologies and Applications (SIMULTECH 2016), pages 357-362
ISBN: 978-989-758-199-1
Copyright
c
2016 by SCITEPRESS – Science and Technology Publications, Lda. All rights reserved
357
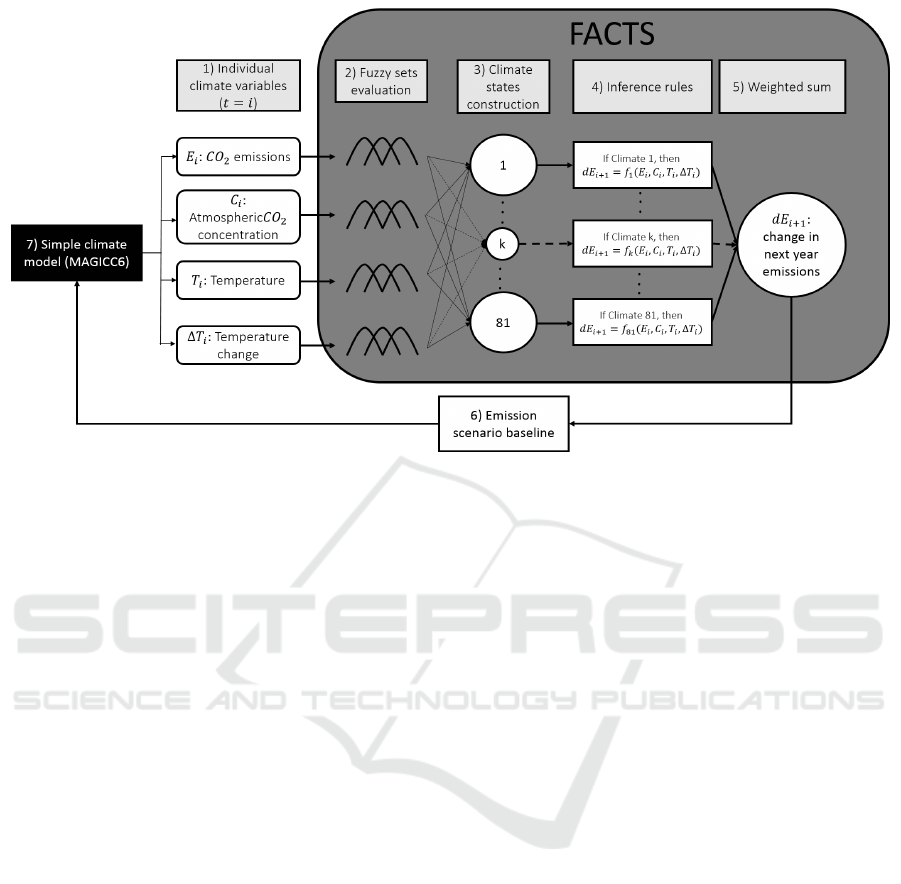
Figure 1: Structure of FACTS incrusted on a simple climate model.
presented as a new methodology for describing more
realistically the climate system in simple and clear
words in order to create a common language between
decision-makers and the modelling community.
2 FACTS STRUCTURE
A concise overview of the ’Fuzzy Assessment and
Control for Temperature Stabilization’ is presented in
Figure 1.
(1) First, FACTS receive climate parameters of
year i: the CO
2
emissions; the atmospheric CO
2
con-
centration; the average global temperature; and the
temperature change (T
i
− T
i−1
).
(2) Each variable’s domain is divided in three
fuzzy sets that represent the linguistic categories low,
medium and high, or null, low and medium, depend-
ing on the variable, so that every value in the domain
has its membership degree to the fuzzy sets, ranging
from zero (no membership) to one (full membership)
(Zadeh, 1965). In this stage the climate assessment
takes place in order to provide a fuzzy description of
the climate state.
In step (3) takes place a combination of fuzzy
sets from the different climate variables, which
creates all possible -81- climate states, such
as: 1. low emissions/concentration/temperature
& null temperature increment, 2. medium
emissions/concentration/temperature & low
temperature increment, 3. high emis-
sions/concentration/temperature & medium tem-
perature increment, 4. high emissions/concentration,
medium temperature & null temperature increment,
and so on. The eighty one climate states are repre-
sented by a combination of four climate fuzzy sets
linked by an ’&’ operator, which assigns a weight to
the combination: the minimum membership degree
of the four climate parameters (given in step (1))
evaluated in the four fuzzy sets that build up the
climate state.
(4) Each climate state lead to an IF-THEN rule
(Zadeh, 1975; Takagi and Sugeno, 1985), which re-
lates the membership degree of the parameters to the
climate state k, to the function f
k
that describes, for
that particular climate state, the change in emissions
that would need to be made in the year i + 1 in order
to stabilize the mean temperature.
Finally, a weighted sum of the eighty one infer-
ence rules is made in step (5) using the weight as de-
scribed in step (3), so we obtain the ultimate value
of the change in future CO
2
emissions and add it to
the emission scenario baseline (6), which serves as an
input for the climate model (7).
3 OPTIMIZATION PROCESS
A neural network was formed by operational nodes
and links that receive an input matrix and create
multiple signal flows through the system which ul-
timately give as a result a single output that is com-
pared with an output target, then, its made a parame-
ter adjustment in the operational nodes using an error-
MSCCES 2016 - Special Session on Applications of Modeling and Simulation to Climatic Change and Environmental Sciences
358
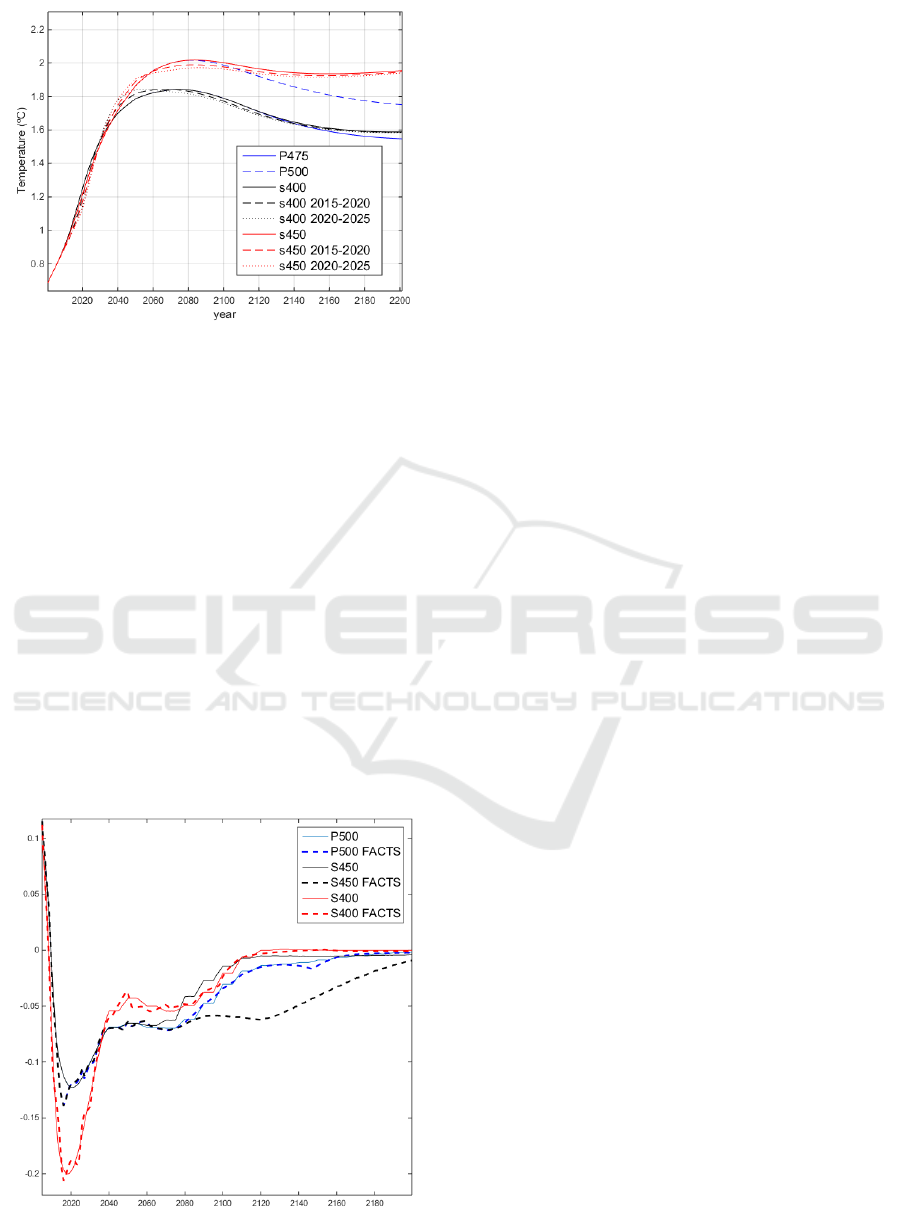
Figure 2: Temperature stabilization from SiMCaP data
(Meinshausen et al., 2005).
decreasing function (Jang et al., 1997). In the opti-
mization process of FACTS, a fuzzy inference system
is encrusted in a neural network, and the parameter
tuning is made in the eighty one functions of the step
(4) in Figure 1, that way we created a neuro-adaptive
fuzzy inference system (Shing and Jang, 1993).
The input matrices used for optimizing FACTS
were 5 time-series (P475, S400 2015-2020, S400
2020-2025, S450 2015-2020, S450 2020-2025) of cli-
mate parameters (CO
2
emissions, atmospheric CO
2
concentration, average global temperature and tem-
perature change) from 2005 to 2200, that reach tem-
perature stabilization between 1.5
◦
C and 2
◦
C, within
years 2100 and 2200, as shown in Figure 2. The cli-
mate parameters are the result of running MAGICC4
(Wigley, 2003) with 5 multi-gas pathways found by
SiMCaP (Meinshausen et al., 2005), the CO
2
com-
Figure 3: Original SiMCaP reduction pathways (Mein-
shausen et al., 2005) and FACTS generated pathways.
ponents of this pathways were the output target of
FACTS, since the objective is to find fuzzy inference
rules that stabilize temperature through CO
2
emis-
sions control.
Each year i in the time-series contains the four in-
put climate parameters and the output target, which
is sufficient to evaluate the error-decreasing function
and make a small adjustment to the FACTS parame-
ters. Since the time-series have 195 years, there were
made 975 parameters’ adjustments each epoch, and
we ran the optimization process from 1 to 30 epochs
in order to find the point where the least error between
the FACTS output and the output target was reached,
which was localized in the epoch number 3. So we
used the FACTS that was optimized 3 epochs, i.e. al-
most 3 000 small parameters’ adjustments.
4 VALIDATION
The remaining time-series of Figure 2 that were not
used in the optimization process: P500, S450 and
S500 served for validating FACTS efficiency. As we
can see in Figure 3, the result of using FACTS to cal-
culate what should be the future emissions to fit the
temperature stabilization pathways is very close to the
real calculation by SiMCaP.
We can observe (Figure 3) that the FACTS gen-
erated emissions are closer to the SiMCaP original
pathways in the case of P500 and S400, nevertheless,
in the case of S450, FACTS created a more intense
reduction pathway than the original. This is by virtue
of the fuzzy nature of the system, which absorbed in
the optimization process a greater amount of output
targets that tend to 1.5
◦
.
Fuzzy logic is not a precise method for measure
variables or relating values, but is powerful by means
of absorbing uncertainty and solving problems effi-
ciently. In that context, it is recognizable the fuzzy
behaviour in S450 FACTS pathway.
5 RESULTS
We implement FACTS control on emissions in differ-
ent climate scenarios in order to stabilize the global
average temperature. We used the four Representative
Concentration Pathways (RCPs) (Moss et al., 2007) to
run MAGICC6 and create different climate scenarios
until 2025, when FACTS control begins and propose a
5-year-constant change in CO
2
emissions until 2100.
Despite FACTS was tuned with climate parame-
ters coming from MAGICC4.1 (Wigley, 2003), in this
experiment we used MAGICC6 (Meinshausen et al.,
FACTS: Fuzzy Assessment and Control for Temperature Stabilization - Regulating Global Carbon Emissions with a Fuzzy Approach to
Climate Projections
359
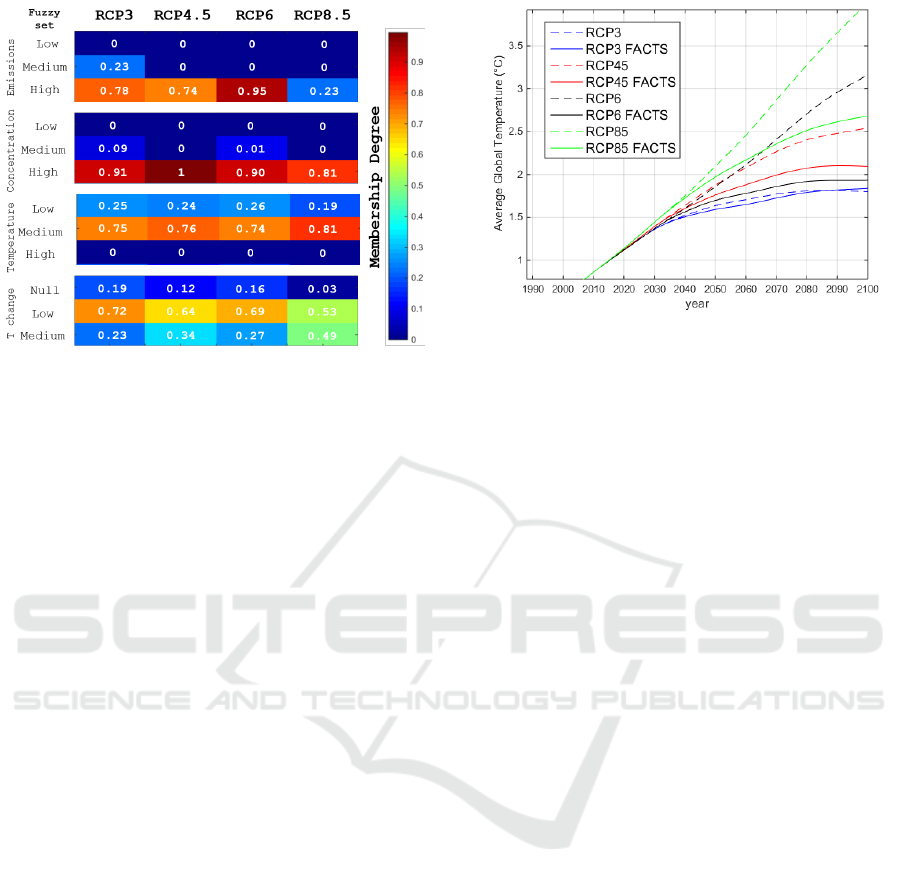
Figure 4: Fuzzy climate states at year 2025. This diagram
represents four climate scenarios obtained by MAGICC6
and evaluated by FACTS fuzzy sets, each column repre-
sent an RCP scenario that contains the membership degree
of the climate parameter (CO
2
emissions, CO
2
atmospheric
concentration, Temperature and Temperature change) to cli-
mate fuzzy descriptors such as low, medium or high.
2011) in order to have better climate projections ac-
cording to the adjustments in the carbon cycle and
other important improvements in the new release.
FACTS was activated at year 2025 in order to sim-
ulate a real-life situation with 2 important character-
istics. First, according to the Paris Agreement (UN-
FCC, 2015), the countries will release new CO
2
emis-
sion goals every five years starting in 2025. Second,
the years gap that exist from now to 2025, is crucial
in the formation of the climate states that will serve
as the first input for FACTS in 2025, that is the reason
why we let the climate states to build up before 2025
under the 4 RCPs, as we can see in Figure 4.
The FACTS output is the next-year change in
emissions, but in this experiment we configured
FACTS in order to give the average change in the next
5 years. This was made assuming that national gov-
ernments are able to pursue more easily a constant
emissions’ reduction rather than a 5-year not-constant
emissions pathway.
The Figure 5 shows the temperature projections
under the four RCPs, with (solid lines) and with-
out (dashed lines) control in emissions. As we can
see, FACTS controls the temperature under 2
◦
C when
the climate state in 2025 was driven by RCP3 and
RCP4.5; when the climate state was driven by RCP6,
FACTS control the temperature around 2.1
◦
C; finally,
if we follow the business as usual pathway until 2025
(RCP 8.5), FACTS is not capable to stabilize the tem-
perature at the levels agreed by the international com-
munity.
Figure 6 shows the emissions pathways that lead
Figure 5: Temperature stabilization using FACTS.
to the temperatures observed in Figure 5. RCP3 and
RCP6 are scenarios that start with not very high emis-
sions, so the post-2025 stabilization route is some-
what smooth. On the other hand, RCP4.5 starts with
higher emissions, which eventually lead the stabiliza-
tion route to reach the maximum decreasing capacity,
in 2050. Finally, RCP8.5 states a climate state in 2025
that immediately pushes FACTS to decrease the max-
imum possible emissions.
The final state of the climate is evaluated finally
by FACTS at year 2100, as shown in Figure 7. It
is clear the change in specific parameters that match
with an stabilized climate, such as the low emissions,
high concentration, high temperature and null or low
temperature change.
6 DISCUSSION
FACTS is not just a simple control on emissions, Fig-
ure 4 shows that every time FACTS is used, there is
an evaluation of the climate state that could be de-
scribed in a linguistic way, for example, we can say
that RCP3 generates an scenario in 2025 where CO
2
emissions are fairly high (”fairly” is a fuzzy concept
that could be result of the combination of the mem-
bership degree 0.23 to medium and 0.78 to high), the
atmospheric CO
2
concentration is significantly high,
the temperature is moderately medium and the tem-
perature change is kind of low.
The climate states trigger different amounts of re-
duction in order to reach an stable climate state as
shown in Figure 7. Nevertheless, much more work
need to be done, almost counter-intuitive, we can ob-
serve that the projected temperature under RCP 8.5 in
2100 does not belong to any fuzzy set, while it should
completely belong to the high temperature fuzzy set.
This is because fuzzy sets were made to fit the data
used as training in the optimization process. So fuzzy
MSCCES 2016 - Special Session on Applications of Modeling and Simulation to Climatic Change and Environmental Sciences
360
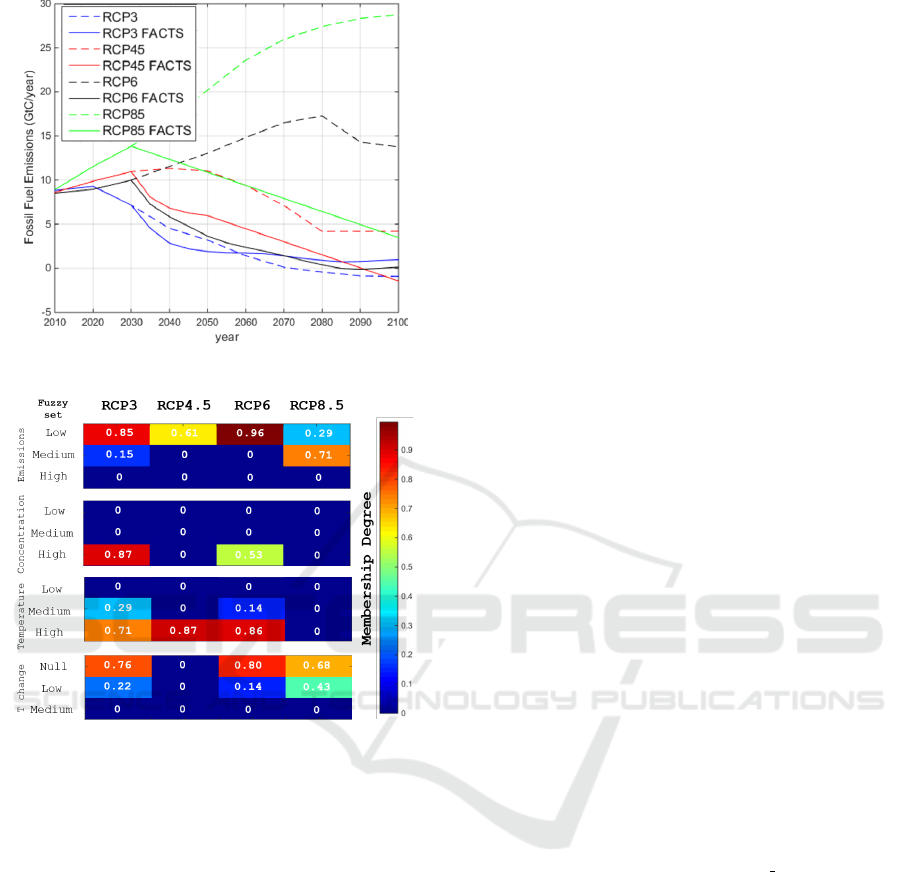
Figure 6: FACTS control in Emissions.
Figure 7: Fuzzy climate states after the control was imple-
mented. Year 2100. This diagram represents four climate
scenarios obtained by MAGICC6 and evaluated by FACTS
fuzzy sets, each column represent an RCP scenario that
contains the membership degree of the climate parameter
(CO
2
emissions, CO
2
atmospheric concentration, Temper-
ature and Temperature change) to climate fuzzy descriptors
such as low, medium or high.
sets must be tuned manually in order to broaden their
domain, for example, any temperature from 2.5C to
infinity should belong to the high temperatures’ fuzzy
set.
The optimization data was taken from SiMCaP
simulations, that were created based on literature
scenarios, nevertheless, FACTS structure allows to
merge the strategies used these different world-wide
proposed scenarios. That is the reason why FACTS is
able to create stabilization pathways that match with
feasible reduction rates, and not always will be pos-
sible to stabilize temperature as observed in RCP85
FACTS (Figure 5).
Finally it is important to specify that FACTS never
really uses the great number of inference rules (81) at
the same time. Whenever it is used with certain cli-
mate parameters, there is an automatic elimination of
inference rules, that provide a lot simpler fuzzy con-
trol. In Figure 4 if we eliminate the rules that are
linked to the fuzzy sets which membership degree is
zero (or very close to zero) for the climate parameters
of RCP3 at year 2025, the number of inference rules
reduces to 12. Since fuzzy inference systems are eval-
uated parallel and the functions of each rule are linear
equations, is very efficient to embed FACTS in a cli-
mate model such as MAGGIC and run the stabiliza-
tion process and the model projections within a few
seconds (∼ 5s) in an ordinary personal computer.
7 CONCLUSIONS
Even for scientists is hard to understand the con-
sequences of increasing the temperature certain de-
grees in certain period of time. In negotiations, there
is a continuous translation between climate numeri-
cal parameters and human communication structure.
FACTS presents an straightforward bridge between
both languages, that allows stake-holders to negotiate
in the same language that is used in a climate stabi-
lizer and descriptor. In the context of the actual cli-
mate change challenge that is facing humanity, this
singular type of climate approaches are very impor-
tant.
REFERENCES
Belenky, M. (2015). Achieving the u.s. 2025
emissions mitigation target. Available at:
http://www.climateadvisers.com/wpcontent/uploads/
2013/12/US-Achieving-2025-Target May-20151.pdf .
Garg, A., Shukla, P., and K., B. (2014). India report
- alternate development pathways for india: Align-
ing copenhagen climate change commitments with
national energy security and economic development.
low climate impact scenarios and the implications
of required tight emission control strategies [limits].
Ahmedabad, India: Indian Institute of Management,
Ahmedabad.
Jang, J.-S. R., Sun, C.-T., and Mizutani, E. (1997). Neuro-
fuzzy and soft computing. Prentice Hall, Englewood
Cliffs, N.J.
Meinshausen, M., Bill, H., Wigley, T., Vuuren, D. V., Elzen,
M. D., and Swart, R. (2005). Multi-gas emissions
pathways to meet climate targets. Climatic Change,
17(27).
Meinshausen, M., Raper, S., and Wigley, T. (2011). Emulat-
ing coupled atmosphere-ocean and carbon cycle mod-
els with a simpler model, magicc6 - part 1: Model
FACTS: Fuzzy Assessment and Control for Temperature Stabilization - Regulating Global Carbon Emissions with a Fuzzy Approach to
Climate Projections
361

description and calibration. Atmos. Chem. Phys.,
11:1417–1456.
Moss, R., Babiker, M., Brinkman, S., Calvo, E., Carter, T.,
Edmonds, J., Elgizouli, I., Emori, S., Erda, L., Hib-
bard, K., Roger, J., Kainuma, M., Kelleher, J., Lamar-
que, J. F., Manning, M., Matthews, B., Meehl, J.,
Meyer, L., Mitchell, J., Nakicenovik, N., O’Neill, B.,
Pichs, R., Riahi, K., Rose, S., Runc, P., Stouffer, R.,
van Vuuren, D., Weyant, J., Wilbanks, T., van Yper-
sele, J. P., and Zurek, M. (2007). Towards new scenar-
ios for analysis of emissions, climate change, impacts,
and response strategies. IPCC Expert meeting report.
Rogelj, J., McCollum, D. L., ONeill, B. C., and Riahi, K.
(2013). 2020 emissions levels required to limit warm-
ing to below 2c. Nature Climate Change, 3.
Shing, J. and Jang, R. (1993). Anfis: Adaptive network-
based fuzzy inference system. IEEE, Transactions on
systems, man, and cybernetics, 23.
Takagi, T. and Sugeno, M. (1985). Fuzzy identification of
system and its application to modeling and control.
IEEE, SMC, 15:199–249.
UNEP (2015). The emissions gap report. United Nations.
UNFCC (2015). Paris agreement. Conference of the Parts.
Wigley, T. (2003). MAGICC/SCENGEN 4.1: Technical
Manual. UCAR-Climate and Global Dynamics Di-
vision, Boulder, Colorado.
Zadeh, L. A. (1965). Fuzzy sets. Information and control,
8:338–353.
Zadeh, L. A. (1975). The concept of a linguistic variable
and its application to approximate reasoning. Inf. Sci,
8:199–249.
MSCCES 2016 - Special Session on Applications of Modeling and Simulation to Climatic Change and Environmental Sciences
362
