
The Importance of Increasing Actual INDCs’ Ambitions to Meet The
Paris Agreement Temperature Targets
An Innovative Fuzzy Logic Approach to Temperature Control and Climate
Assessment using FACTS
Carlos Gay y Garcia
1,2
and Bernardo A. Bastien Olvera
2
1
Centro de Ciencias de la Atm
´
osfera, Universidad Nacional Aut
´
onoma de M
´
exico, Ciudad de M
´
exico, Mexico
2
Programa de Investigaci
´
on en Cambio Clim
´
atico, Universidad Nacional Aut
´
onoma de M
´
exico, Ciudad de M
´
exico, Mexico
Keywords:
Climate Change, Temperature Stabilization, Carbon Emissions, INDCs, Fuzzy Logic, Fuzzy Control.
Abstract:
This work presents an alternative assessment of climate projections using FACTS (Bastien and Gay, 2016),
based on possible future emissions pathways related to the Intended National Determined Contributions pre-
sented in 2015 as part of the Paris Agreement on climate change. Moreover it proposes emission reductions
in order to stabilize the climate to the desired levels proposed by the international community. Ultimately,
it shows the importance of the emissions pathways that the world could take in the crucial period of time
2020-2030. FACTS uses a fuzzy logic approach to solve this physical problem, aware of it dependence on the
complexity of climate diplomacy.
1 INTRODUCTION
Climate models have widely projected different sce-
narios under assumptions of a warmer world (Rahm-
storf and Coumou, 2011; Silliman et al., 2013), how-
ever due to the great uncertainty and the natural conti-
nuity of change in climatic variables, it would be un-
realistic to propose a warming limit that prevent hu-
man and ecosystem collapse. On the other hand, in
order to promote international mobilization toward re-
ducing greenhouse gases emissions, in 2009 was con-
venient to set the goal of not exceeding 2
◦
C the av-
erage global temperature above pre-industrial levels
(UNFCCC, 2010).
Under the imminent decision of the 2 degrees
goal, research groups were dedicated to identify sta-
bilization routes consistent with the limit (Baer et al.,
2009; Bossetti et al., 2010; den Elzen et al., 2010;
Edenhofer et al., 2010; van Vuuren et al., 2011),
while other groups estimated future projected emis-
sions from international agreements and existing en-
ergy structures (Riahi et al., 2007; Rogelj et al., 2013;
Clarke et al., 2009; Davis et al., 2010), with this, the
United Nations Environment Programme made the
first emissions gap report (UNEP, 2010), which shows
how well the actual policy fits the temperature stabi-
lization goals and elaborates on the efforts that need
to be made in future negotiations.
Since that time, it have been developed method-
ologies to find emissions pathways that stabilize
global average temperature. Currently, the state of the
art is to find the most efficient mitigation strategies in
economic, energetic and social terms, differentiating
between global and regional scales (Belenky, 2015;
Rogelj et al., 2013; Garg et al., 2014). Nevertheless,
in this moment is clearly set a whole new international
structure based on domestic pledges that demand un-
derstandable methodologies for their analysis in order
to spread the urgency of proposing more ambitious
goals. In that context, our work presents an alternative
approach and methodology for facing this challenge.
This study uses ’FACTS: Fuzzy Assessment and
Control for Temperature Stabilization’ (Bastien and
Gay, 2016) which is a fuzzy controller and evalu-
ator that uses the output variables of a simple cli-
mate model in an specific time i (temperature, CO
2
emissions, CO
2
concentration, temperature change),
and give as an output the change in emissions that
would need to be made in the subsequent year i + 1
in order to stabilize the climate. We use the FACTS-
assessment to present the fuzzy evaluation of possible
climate states under different emissions pathways be-
tween 2016-2030. Moreover, the FACTS-control was
triggered in 2030 in order to stabilize the average tem-
García, C. and Olvera, B.
The Importance of Increasing Actual INDCs’ Ambitions to Meet The Paris Agreement Temperature Targets - An Innovative Fuzzy Logic Approach to Temperature Control and Climate
Assessment using FACTS.
DOI: 10.5220/0006014703630367
In Proceedings of the 6th International Conference on Simulation and Modeling Methodologies, Technologies and Applications (SIMULTECH 2016), pages 363-367
ISBN: 978-989-758-199-1
Copyright
c
2016 by SCITEPRESS – Science and Technology Publications, Lda. All rights reserved
363
perature according to the Paris Agreement (UNFCC,
2015).
Finally it was made a comparison between the
FACTS’ stabilization pathways and the inertial emis-
sions routes, which remarks the importance of more
ambitious pre-2030 mitigation efforts.
2 DATA ANALYSIS AND
CLIMATE STATES
The core instrument of the Paris Agreement for cli-
mate change mitigation are the Intended National De-
termined Contributions (INDC), a set of nationally
projected greenhouse gases emission trajectories from
2020 to 2030. Since every country has different type
and quality of information, the INDCs are expressed
in heterogeneous ways: relative to a baseline, relative
to historical data, or as reduction goals.
There have been several works that integrates and
analyse the INDCs in order to create global green-
house gases emissions pathways and project the pos-
sible future climate (AGCEC, 2015; CI, 2015; DEA,
2015; Kitous and Keramidas, 2015; IEA, 2015; Boyd
et al., 2015; Spencer and Pierfederici, 2015)
In this study, we used the analysis made by Cli-
mate Interactive [CI], which states possible pathways
that cover different scenarios of global commitment,
where the current INDCs pledges are the worst case
(INDC Strict), and the best case is a success in the
climate change mitigation that stabilizes the tempera-
ture in 1.5
◦
C (Ratchet Success), plus four more sce-
narios that lie between the mentioned above in terms
of emissions intensity (Ratchet 1, Ratchet 2, Ratchet
3, 2 degrees pathway). The INDC Strict scenario is
described as the integration of the INDCs pledges as
of December 13th 2015, where CO
2
changes apply to
CO
2
e except for China, supposing no commitment af-
ter 2030 and using RCP8.5 emissions; while Ratchet
Success is the scenario on track through 2020 to ful-
fill INDC pledges, thereafter, all developed countries
reduce to 45% below 2005 levels by 2030 and 80%
below 2005 levels by 2050, continuing the rates of de-
cline through 2100. China peaks in 2025, all other de-
veloping countries peak in 2027, decline 2% annually
through 2040 and then 4% annually through 2100.
Taking these emissions scenarios, we used MAG-
ICC 6 (Meinshausen et al., 2011) to project the cli-
mate and make an assessment with FACTS (Bastien
and Gay, 2016), an easy-to-use tool that classifies the
climate variables into fuzzy sets that altogether cre-
ate fuzzy climate states. In Figure 1, are shown the
climate states projection in 2100 under the different
proposed by CI.
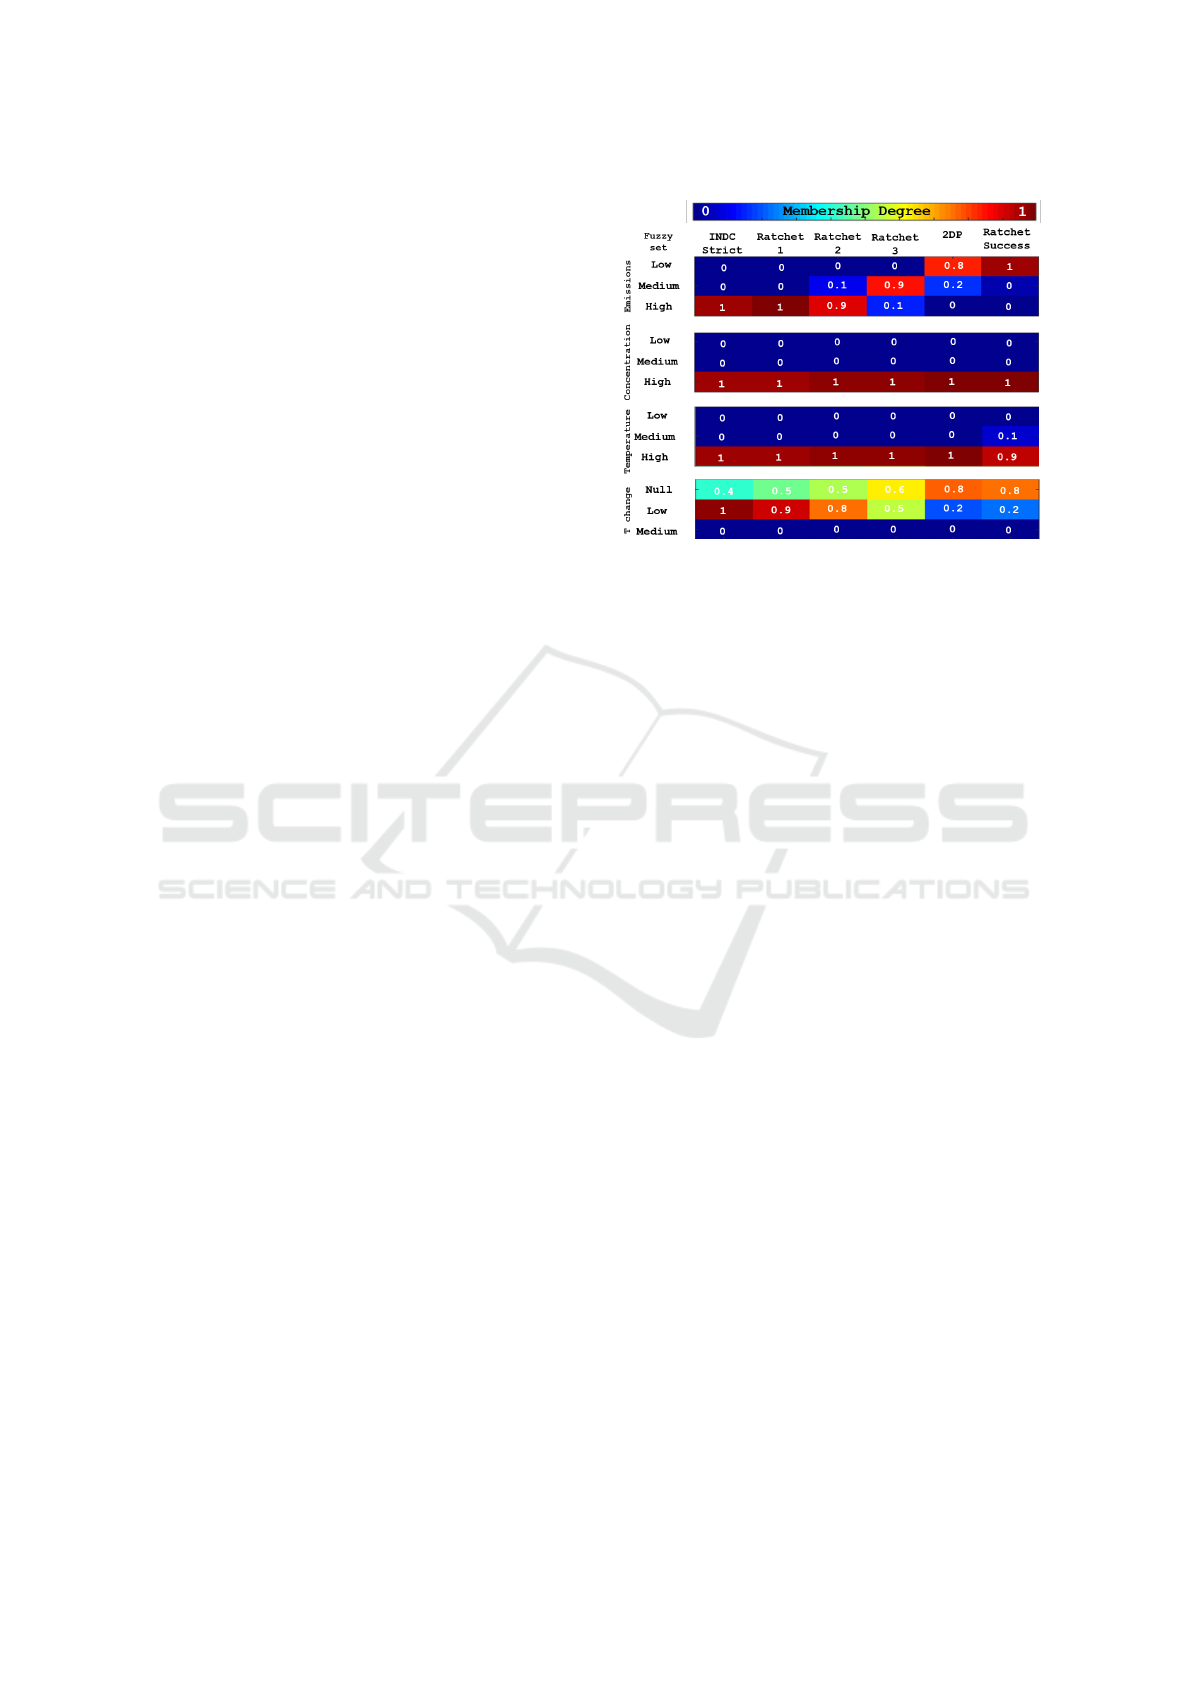
Figure 1: FACTS assessment of the climate states in 2100
that result from INDCs and more ambitious emissions path-
ways. Every column represent a single scenario which is
evaluated in terms of its fossil fuel emissions, atmospheric
CO
2
concentration, temperature and temperature change;
each variable belongs to three linguistically-defined fuzzy
sets in different degree, which is shown in a color scale
and numerically (rounded to decimals): zero is not mem-
bership at all, 1 is full membership. As we can observe,
in 2100 the emissions remain high in the worst scenarios
(INDC Strict, Ratchet 1, Ratchet 2) and decay continuously
to low in the best scenarios (Ratchet 3, 2DP, Ratchet Suc-
cess). As expected, the CO
2
concentration and temperature
are high in all the scenarios, since those measures are in
terms of a 2 degrees stabilization in 2100. Finally, the last
rows tell us that the temperature keep increasing in the worst
scenarios and remains stable in the best ones. As an exam-
ple of interpretation of the climate state, we could read the
’INDC Strict’ scenario (column on the far left) as follows:
Emissions, Concentration and Temperature are high and the
Temperature keeps increasing, this means no stabilization in
2100 and future temperatures above 2 degrees.
As we can observe in the FACTS climate analy-
sis, the higher-emissions routes (INDC Strict, Ratchet
1 and Ratchet 2) lead to climate states in 2100 of
high emissions, high concentrations, high tempera-
ture and low temperature increment. While the lower-
emissions routes (Ratchet 3, 2-Degrees Pathway and
Ratchet Success) lead to medium-low emissions, high
concentration, high temperature and to the crucial null
temperature change. We will further discuss the im-
portance of having a different instrument for the Earth
climate state visualization, rather than the unrealistic
precise number that describes the increment of the av-
erage global temperature above pre-industrial levels.
MSCCES 2016 - Special Session on Applications of Modeling and Simulation to Climatic Change and Environmental Sciences
364
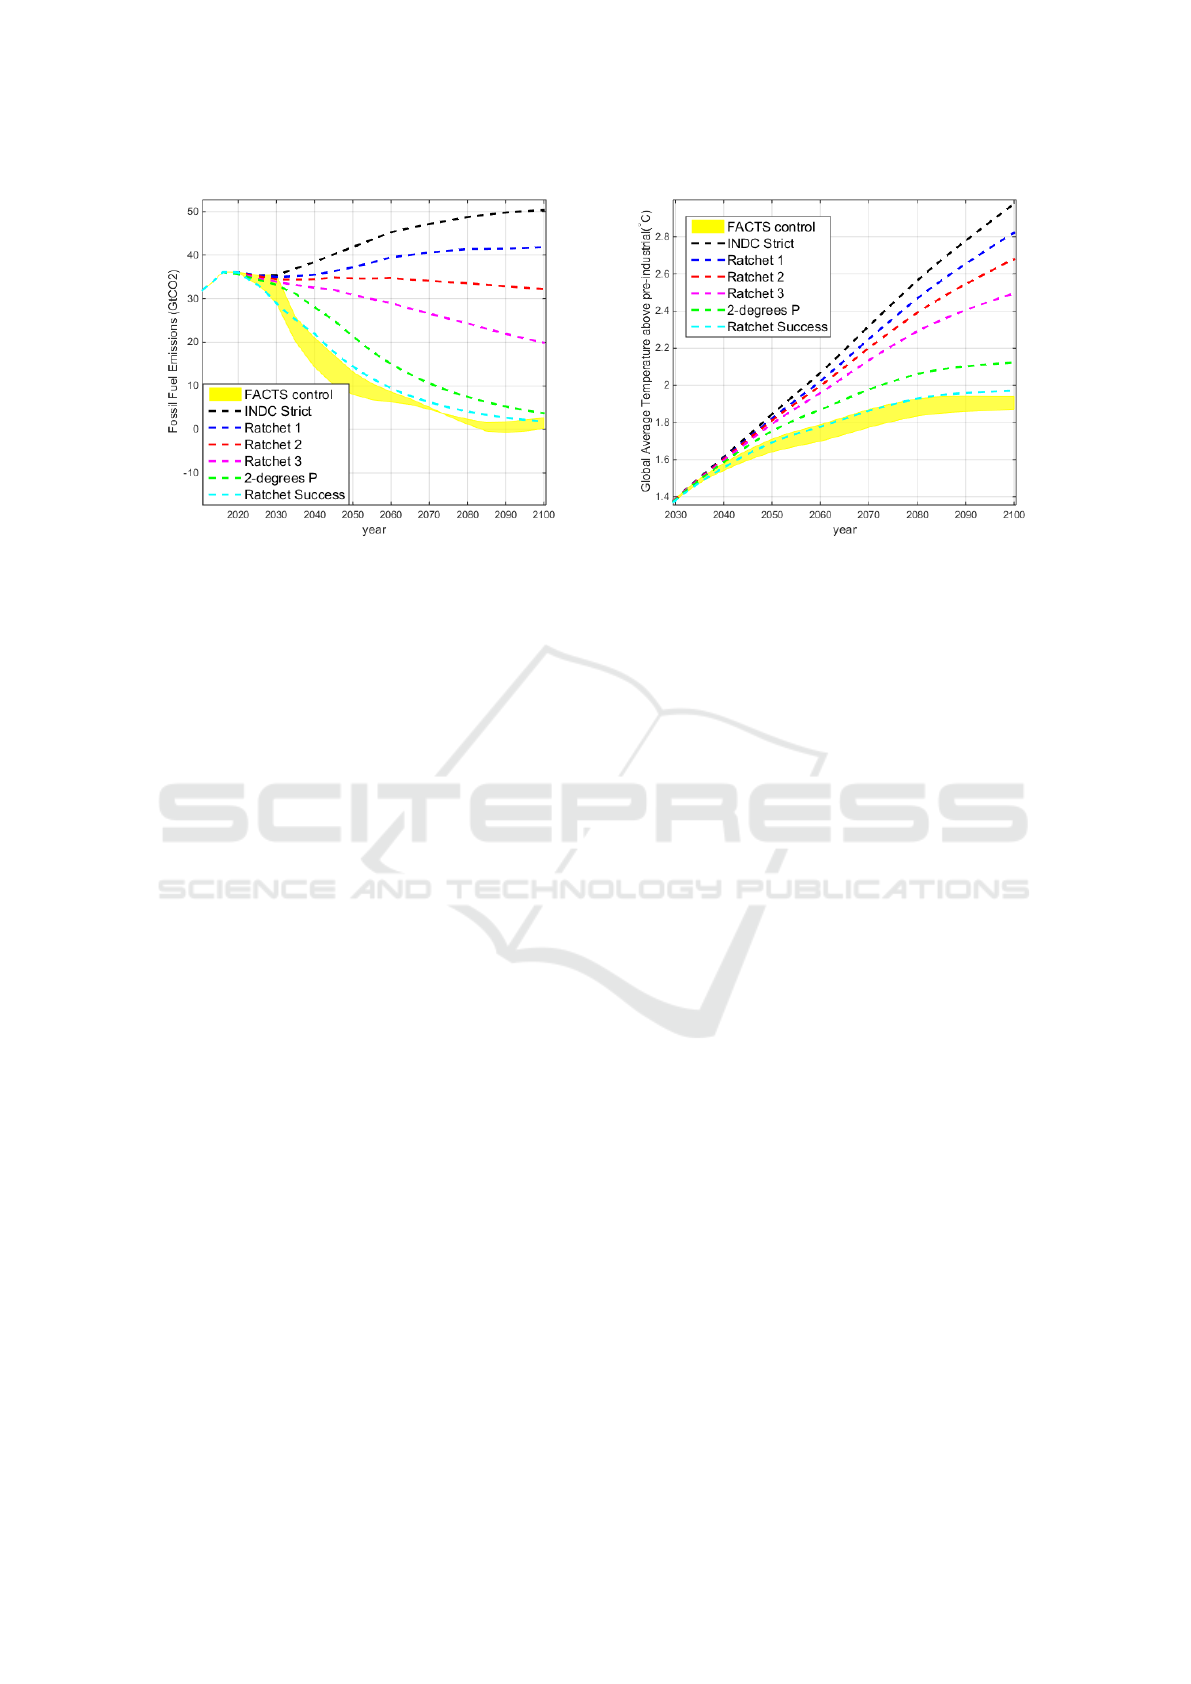
Figure 2: The dashed lines are the emissions scenarios pro-
posed by Climate Interactive after United Nations pledges
analysis. The shaded yellow area is the envelope of the six
controlled emissions pathways created using FACTS in or-
der to stabilize global average temperature.
3 STABILIZATION ROUTES AND
FINAL CLIMATE STATES
FACTS control reduces the emissions of a certain
baseline in order to stabilize the global average tem-
perature and reach an stable climate state. In this ex-
periment, FACTS control was applied every 5 years
starting in 2030, simulating the the new and more am-
bitious communications that need to be made periodi-
cally by all the Parts as stated in the Paris Agreement.
We stabilize the six possible scenarios that range from
the current INDCs to an ideal pathway that lead to the
1.5
◦
C stabilization. In Figure 2 is shown the reduc-
tion that results from FACTS as a yellow shaded area,
which is the envelope of the six stabilization routes
applied to the baseline scenarios.
FACTS needs to be embedded in a climate model
that projects climate parameters as a function of the
control results in order to give a climatic output that
are recycled and serve as an input for FACTS con-
trol. We used MAGICC6 (Meinshausen et al., 2011)
as the core climate model, the results of implement-
ing FACTS can be seen in Figure 3, which shows the
temperature through 2100.
A more complete overview of the climate in 2100
is made by the FACTS-assessment tool (Figure 4),
which shows that not only the temperature, but also
other climate parameters are stable in 2100 after im-
plementing FACTS-control during 70 years every 5
years.
One of the most important characteristics of Fig-
ure 4 is the noticeable color-value homogeneity of the
Figure 3: The dashed lines are the emissions scenarios pro-
posed by Climate Interactive after United Nations pledges
analysis. The shaded yellow area is the envelope of the six
controlled emissions pathways created using FACTS in or-
der to stabilize global average temperature.
rows, which provides an easy visual proof that all sce-
narios were successfully stabilized in very low emis-
sions and concentrations, almost high temperatures
and almost null temperature change. The italics la-
bels are intuitive adjectives that come from a simple
inspection and encompass the uncertain nature of cli-
mate projections, but is still valid.
4 DISCUSSION
A measure of how important is to choose a low emis-
sions pathway before 2030 is the gap that exists in
2040 between the baseline emissions and the con-
trolled ones.
This gap represents the emissions that would need
to be cut to the six baseline emissions in order to
stabilize the climate. For INDC Strict pathway, the
gap is 17.46GtCO
2
; for the Ratchet 1, the gap is
14.98GtCO
2
; for Ratchet 2, the gap is 14.46GtCO
2
;
for Ratchet 3, the gap is 13.01GtCO
2
; for 2-degrees
Pathway, the gap is 9.30GtCO
2
; and finally, for
Ratchet Success, the gap is 7.67GtCO
2
. Even though
the Ratchet Success should be almost equal to the
stabilization route proposed by FACTS-control, this
does not happens due to the different climate models
used by the data source and this experiment, neverthe-
less, the importance resides in the difference between
the gaps.
On the other hand, we recognize the influence of
the historical emissions in the efforts of decreasing
certain quantity of emissions per year. In order to
show that influence we present in Figure 5 the rate of
The Importance of Increasing Actual INDCs’ Ambitions to Meet The Paris Agreement Temperature Targets - An Innovative Fuzzy Logic
Approach to Temperature Control and Climate Assessment using FACTS
365

Figure 4: FACTS assessment of the climate states in 2100
that result from implementing FACTS-control INDCs and
more ambitious emissions pathways. Every column rep-
resent a single scenario which is evaluated in terms of its
fossil fuel emissions, atmospheric CO
2
concentration, tem-
perature and temperature change; each variable belongs to
three linguistically-defined fuzzy sets in different degree,
which is shown in a color scale and numerically (rounded
to decimals): zero is not membership at all, 1 is full mem-
bership. As we can observe, in 2100 the emissions and con-
centrations are low in every scenario. The temperatures are
somewhat high, relative to the 2 degree limit (which means
that is very close to the 2 degrees, this result is expected
in 2100). Finally, the most important result. This whole
assessment represents a climate stabilization, which means
that the FACTS-control worked well.
emissions change of the different scenarios in 2040,
the slope differences between the rates of change rep-
resent the effort that would need to be made in order to
reduce a unit of emission due to the energetic and eco-
nomical structure that the world has developed until
2030 which is represented in the pre-2030 emissions.
The lines that lie in the right side of the figure, are
scenarios that represent a world that keeps developing
energetic structures based in fossil fuels and would be
very hard to put on the stabilization track, on the con-
trary, the left side lines are those scenarios which rep-
resent a world that is in the track of clean energies,
and further reductions would be feasible.
5 CONCLUSIONS
This work shows that the INDCs pledges as of De-
cember 2015, will not be sufficient to stabilize the
climate in 2100, nevertheless, it proves that is phys-
ically possible to meet the international climate tar-
gets. And a crucial step on the pursue of this goal is
to immediately revise the proposed INDCs and make
more ambitious reductions before 2030.
Figure 5: Difference between the rate of change in emis-
sions in 2040.
The difference among accomplishing or not the
climate goals, resides in the construction of a com-
mon ground where negotiators and researchers could
interact and understand each other. As presented here,
FACTS play an important role in this prevailing prob-
lem. On one hand FACTS-assessment presents the
climate states which the negotiators need to be look-
ing for, on the other hand, FACTS-control presents
the pathways that the world need to follow in order to
accomplish those climate states.
Much more work need to be done in the develop-
ment of this new and more easy ways to present and
model the climate change, however, as presented in
this study, the alternative methodologies are up to the
classical methods currently used by the most of inter-
national community, and moreover,they are crucial in
creating an efficient communication bridge that closes
the gap between different actors in the climate change
mitigation challenge.
REFERENCES
AGCEC (2015). Indcs analysis. Australian-German Cli-
mate and Energy College.
Baer, P., Athanasiou, T., and Kartha, S. (2009). A 350 ppm
emergency pathway. Environmental Institute, Boston,
USA, .
Bastien, B. and Gay, C. (2016). Facts: Fuzzy assessment
and control for temperature stabilization: Regulating
global carbon emissions with a fuzzy approach to cli-
mate projections. Submitted to SIMULTECH 6th In-
ternational Conference on Simulation and Modeling
Methodologies, Technologies and Applications.
Belenky, M. (2015). Achieving the u.s. 2025 emis-
sions mitigation target. Available at: http://
www.climateadvisers.com/wpcontent/uploads/...
2013/12/US-Achieving-2025-Target May-20151.pdf.
Bossetti, V., Carraro, C., and Tavoni, M. (2010). Alterna-
tive paths toward a low carbon world. FEEM Working
Paper No. 62.2010.
Boyd, R., Turner, J., and Ward, B. (2015). Intended nation-
ally determined contributions: What are the implica-
MSCCES 2016 - Special Session on Applications of Modeling and Simulation to Climatic Change and Environmental Sciences
366

tions for greenhouse gas emissions in 2030? Centre
for Climate Change Economics and Policy.
CI (2015). United N climate pledge analy-
sis. Climate Interactive. Available at:
www.climateinteractive.org.programs/scoreboard/.
Clarke, L., Edmonds, J., Krey, V., Richels, R., Rose, S.,
and Tavoni, M. (2009). International climate policy
architectures: Overview of the emf 22 international
scenarios. Energy Economics (Supplement 2), pages
S64–S81.
Davis, S., Caldeira, K., and Matthews, H. (2010). Future
co2 emissions ans climate change from existing en-
ergy infraestructure. Science, 329(5997):1330–1333.
DEA (2015). Analyzing the 2030 emissions gap. Danish
Energy Agency.
den Elzen, M., Meinshausen, M., and van Vuuren, D.
(2010). Multi-gas emission envelopes to meet green-
house gas concentration targets: Costs versus cer-
tainty of limiting temperature increase. Global En-
vironmental Change - Human and Policy Dimensions,
17(2):260–280.
Edenhofer, O., Knopf, B., Barker, T., Baumstark, L.,
Bellevrat, E., B., C., Criqui, P., Isaac, M., Kitous, A.,
Kypreos, S., Leimbach, M., Lessmann, K., Magne, B.,
Scrieciu, S., Turton, H., and van Vuuren, D. (2010).
The economics of low stabilization: Model compar-
ison of mitigation strategies and costs. The Energy
Journal, 31:11–48.
Garg, A., Shukla, P., and K., B. (2014). India report
- alternate development pathways for india: Align-
ing copenhagen climate change commitments with
national energy security and economic development.
low climate impact scenarios and the implications
of required tight emission control strategies [limits].
Ahmedabad, India: Indian Institute of Management,
Ahmedabad, .
IEA (2015). Energy and climate change. International En-
ergy Agency: World Energy Outlook Special Report.
Kitous, K. and Keramidas, K. (2015). Jrc policy brief:
Analysis of scenarios integrating the indcs. European
Comission.
Meinshausen, M., Raper, S., and Wigley, T. (2011). Emulat-
ing coupled atmosphere-ocean and carbon cycle mod-
els with a simpler model, magicc6 - part 1: Model
description and calibration. Atmos. Chem. Phys.,
11:1417–1456.
Rahmstorf, S. and Coumou, D. (2011). Increase of extreme
events in a warming world. Proc. Natl. Ac. Sci., 108.
Riahi, K., A., G., and Nakicenovic, N. (2007). Scenarios
of long-term socio-economic and environmental de-
velopment under climate stabilization. Technological
Forecasting and Social Change (Special Issue: Green-
house Gases - Integrated Assessment), 74(7):887–
935.
Rogelj, J., McCollum, D. L., ONeill, B. C., and Riahi, K.
(2013). 2020 emissions levels required to limit warm-
ing to below 2c. Nature Climate Change, 3.
Silliman, J., Kharin, V., Zwiers, F., Zhang, X., and
Bronaugh, D. (2013). Climate extremes indices in
the cmip5 multimodel ensemble: Part2. future climate
projections. J. Geophys. Res., 118.
Spencer, T. and Pierfederici, R. (2015). Beyond the num-
bers: Understanding the transformation induced by in-
dcs. Studies, 5.
UNEP (2010). The emissions gap report. United Nations, .
UNFCC (2015). Paris agreement. Conference of the Parts.
UNFCCC (2010). Cancun agreement. Conference of the
Parts.
van Vuuren, D., Edmonds, J., Kainuma, M., Riahi, K.,
Thomson, A., Hibbard, K., Hurtt, C., Kram, T., Krey,
V., Lamarque, J., Masui, T., Meinshausen, M., Naki-
cenovic, N., S.J., S., and Rose, S. (2011). The repre-
sentative concentration pathways: an overview. Cli-
mate Change, 109:5–31.
The Importance of Increasing Actual INDCs’ Ambitions to Meet The Paris Agreement Temperature Targets - An Innovative Fuzzy Logic
Approach to Temperature Control and Climate Assessment using FACTS
367
