
Individual and Global Assessments with Signed Distance Defuzzification,
and Characteristics of the Output Distributions based on an Empirical
Analysis
R
´
edina Berkachy and Laurent Donz
´
e
Applied Statistics and Modelling, Department of Informatics, Faculty of Economics and Social Sciences,
University of Fribourg, Boulevard de P
´
erolles 90, 1700 Fribourg, Switzerland
Keywords:
Individual Assessment, Finanzplatz Z
¨
urich: Umfrage 2010, Fuzzy Logic, Fuzzy Statistics, Global As-
sessment, Linguistic Questionnaire, Normality, Output Distribution, Sampling Weights, Signed Distance
Defuzzification Method.
Abstract:
Considering a particular kind of questionnaires called linguistic questionnaires, we apply fuzzy logic to pro-
vide individual and global weighted evaluations in the case of the signed distance defuzzification method. We
test our method on real data coming from a survey of the financial place of Zurich (Switzerland). Furthermore,
we have been enable to give a look at the output distributions, and put into evidence their statistical properties.
In particular, normality of distributions draws our attention. One of our main findings is that the individual
evaluations calculated with the signed distance defuzzification method tend to be normally distributed.
1 INTRODUCTION AND
MOTIVATION
A linguistic questionnaire is a set of items called
“questions”, coded as categorical variables. Indeed,
the modalities of the variables are defined as linguis-
tics. This type of questionnaires has been used fre-
quently in many fields such as in satisfaction stud-
ies or in different economic studies, etc. Due to this
particular kind of questions, the answers are deeply
market by imprecision and vagueness, for the human
response often weaving between different answers.
Fuzzy logic was precisely introduced to deal with
such imprecision.
The treatment of the data provided by the survey
via the questionnaires can be done in different ways.
We support below the notion of assessment or evalu-
ation of questionnaires. This approach aims to bring
out more information about the overall questionnaires
compared to classical methods of treatment, often giv-
ing partial information. Fuzzy logic is a great tool to
produce quantitative outcomes — the evaluation —
from a given linguistic questionnaire. For instance,
(Lin and Lee, 2009) and (Lin and Lee, 2010) pre-
sented the global evaluation of a linguistic question-
naire, and in the same way, (Berkachy and Donz
´
e,
2015) and (Berkachy and Donz
´
e, 2016a) displayed
the individual ones.
The third part of a fuzzy process is the defuzzi-
fication, i.e. the way of producing quantitative crisp
outcomes from the given fuzzy sets, (Yager, 1996).
Among several known defuzzification methods seen
in (Runkler, 1997), one has especially retained our
attention: the signed distance method defended ini-
tially by (Yao and Wu, 2000). We have already ex-
plored some of the nice features of the signed dis-
tance method in (Berkachy and Donz
´
e, 2015) and
(Berkachy and Donz
´
e, 2016a). In addition, (Berkachy
and Donz
´
e, 2016b) presented a comparison between
the signed distance and other defuzzification methods
in order to highlight some statistical characteristics of
distributions obtained by applying this method.
We intend in the following to present the measures
for the individual and global evaluations of question-
naires. The aim is to adapt the method described
in (Berkachy and Donz
´
e, 2015) and (Berkachy and
Donz
´
e, 2016a) by introducing the sampling weights
in the calculations. In addition, we emphasize the
relations between these two assessments’ methods.
The empirical part of the study, based on data col-
lected during a regional survey concerning the finan-
cial place of Zurich (Switzerland), shows how one can
implement these measures. Furthermore, the estima-
tion gives us the possibility to analyse the properties
of the distributions produced by the defuzzification
process, and in particular if the resulting distributions
Berkachy, R. and Donzé, L.
Individual and Global Assessments with Signed Distance Defuzzification, and Characteristics of the Output Distributions based on an Empirical Analysis.
DOI: 10.5220/0006036500750082
In Proceedings of the 8th International Joint Conference on Computational Intelligence (IJCCI 2016) - Volume 2: FCTA, pages 75-82
ISBN: 978-989-758-201-1
Copyright
c
2016 by SCITEPRESS – Science and Technology Publications, Lda. All rights reserved
75

are normal.
The section 2 is devoted to a short presentation
of the signed distance measure, the formalisation of
a linguistic questionnaire in fuzzy sense, as well as
the global and individual evaluations. In Section 3,
we describe the survey “Finanzplatz Zurich: Umfrage
2010”, the database and the set up of the evaluations.
In addition, this section summarises some analysis on
an individual assessment. We finally give some ar-
guments about the use of evaluations through fuzzy
logic and classical methods of data analysis.
2 GLOBAL AND INDIVIDUAL
EVALUATIONS AND THE
SIGNED DISTANCE MEASURE
2.1 Definitions
Let us start by defining the signed distance measure
for a fuzzy set as defended by (Yao and Wu, 2000)
and (Lin and Lee, 2010).
We consider a family F of fuzzy numbers on
R = (−∞,∞). Let
˜
D ∈ F be a fuzzy set on R,
such as
˜
D = {(x,µ
˜
D
(x))|x ∈ R} where µ
˜
D
(x) is the
membership function of x in
˜
D which maps R to the
closed interval [0,1].
We denote by D
L
(α) and D
R
(α) the left and right α-
cuts of the fuzzy set
˜
D, where 0 ≤ α ≤ 1. We assume
that D
L
(α) and D
R
(α) exist and are integrable for α ∈
[0,1]. Moreover, the fuzzy set
˜
D can be represented
using its α-cuts as
˜
D =
[
0≤α≤1
[D
L
(α),D
R
(α);α].
We are now able to define the signed distance of the
fuzzy set
˜
D.
Definition 2.1. The signed distance of
˜
D measured
from the fuzzy origin
˜
0 is:
d(
˜
D,
˜
0) =
1
2
Z
1
0
[D
L
(α) + D
R
(α)]dα. (1)
In the case of a triangular fuzzy number
˜
D =
(p, q,r), we can easily find the corresponding signed
distance measure. For the left and right α-cuts
D
L
(α) and D
R
(α), where D
L
(α) = p + (q − p)α and
D
R
(α) = r − (r − q)α, the signed distance of
˜
D mea-
sured from
˜
0 is given by
d(
˜
D,
˜
0) =
1
4
(p + 2q + r). (2)
We will apply this particular signed distance later
in our calculations.
2.2 Notation and Conditions
Inspired by (Lin and Lee, 2010), we decompose a
linguistic questionnaire into r weighted main-items
B
j
, j = 1,... ,r, with weight b
j
, such as 0 ≤ b
j
≤ 1
and
∑
r
j=1
b
j
= 1, and the corresponding m
j
weighted
sub-items B
jk
, k = 1,..., m
j
, with weight b
jk
such as
0 ≤ b
jk
≤ 1 and
∑
m
j
k=1
b
jk
= 1. Each sub-item counts m
linguistic terms with the corresponding series of fuzzy
numbers
˜
L
1
,
˜
L
2
,. .. ,
˜
L
q
,. .. ,
˜
L
m
, where q = 1, 2,...,m,
as seen in Table 1.
In addition, we required some other conditions:
• The fuzzy numbers are linearly ordered as well
as their signed distance measure i.e. d(
˜
L
1
,
˜
0) <
d(
˜
L
2
,
˜
0) < . .. < d(
˜
L
m
,
˜
0),
• only one answer is possible by sub-item,
• missing values are not allowed,
• the answers are weighted,
• each unit sample i has a sampling weight α
i
, i =
1,. .. ,N.
We denote by δ
jkqi
an indicator of an answer at a
linguistic term L
q
:
δ
jkqi
=
1 if the observation i has an answer
for the linguistic L
q
;
0 otherwise.
(3)
Let α
i
be the sampling weight. Then n
jkq•
is the total
number of weighted answers at the linguistic term L
q
of the sub-item B
jk
where
n
jkq•
=
N
∑
i=1
α
i
δ
jkqi
. (4)
Furthermore, under the condition that missing values
are not allowed, we have
n
jk••
=
N
∑
i=1
m
∑
q=1
α
i
δ
jkqi
=
N
∑
i=1
α
i
, (5)
where j = 1,...,r and k = 1,..., m
j
.
2.3 Evaluation Measures
In their paper, (Lin and Lee, 2010) showed a so-called
global assessment in linguistic questionnaires, while
FCTA 2016 - 8th International Conference on Fuzzy Computation Theory and Applications
76

Table 1: Decomposition of a weighted main-item B
j
into m
j
sub-items and the signed distance measures corresponding to
their m fuzzy numbers.
Main-item Weight Sub-items Weights Linguistic terms Fuzzy numbers Signed Distance measures
B
j
b
j
B
j1
b
j1
L
1
˜
L
1
d(
˜
L
1
,
˜
0)
.
.
.
.
.
.
.
.
.
L
m
˜
L
m
d(
˜
L
m
,
˜
0)
.
.
.
B
jk
b
jk
L
1
˜
L
1
d(
˜
L
1
,
˜
0)
.
.
.
.
.
.
.
.
.
L
q
˜
L
q
d(
˜
L
q
,
˜
0)
.
.
.
.
.
.
.
.
.
L
m
˜
L
m
d(
˜
L
m
,
˜
0)
.
.
.
B
jm
j
b
jm
j
L
1
˜
L
1
d(
˜
L
1
,
˜
0)
.
.
.
.
.
.
.
.
.
L
m
˜
L
m
d(
˜
L
m
,
˜
0)
(Berkachy and Donz
´
e, 2015) and (Berkachy and
Donz
´
e, 2016a) showed an individual one. Nev-
ertheless, we present in this part a revised global
evaluation measure taking into account the sampling
weight of each sample unit. We also display the
relation between the evaluations on both levels.
First, let us express the evaluation of a whole ques-
tionnaire in terms of global or aggregative evaluation.
A weighted fuzzy number is
n
jkq•
n
jk••
˜
L
q
, and the signed
distance d
jkq
of this quantity can be written as
d
jkq
= d((n
jkq•
/n
jk••
)
˜
L
q
,
˜
0) = (n
jkq•
/n
jk••
)d(
˜
L
q
,
˜
0).
Using (4) and (5), we can derive the aggregative eval-
uation P of the linguistic questionnaire in the follow-
ing way:
P =
r
∑
j=1
b
j
m
j
∑
k=1
b
jk
m
∑
q=1
d
jkq
=
r
∑
j=1
b
j
m
j
∑
k=1
b
jk
m
∑
q=1
∑
N
i=1
α
i
δ
jkqi
∑
N
i=1
α
i
d(
˜
L
q
,
˜
0). (6)
On an individual level, we define the individual eval-
uation P
i
of the questionnaire for an individual i as:
P
i
=
r
∑
j=1
b
j
m
j
∑
k=1
b
jk
m
∑
q=1
δ
jkqi
d(
˜
L
q
,
˜
0). (7)
Proposition 2.1. The weighted mean of the individ-
ual evaluations P
i
,i = 1, .. ., N, is equal to the global
evaluation P.
Proof 2.1. The weighted mean of the individual eval-
uations is equal to
∑
N
i=1
α
i
P
i
∑
N
i=1
α
i
.
Then, from (7), we have
1
∑
N
i=1
α
i
N
∑
i=1
α
i
r
∑
j=1
b
j
m
j
∑
k=1
b
jk
m
∑
q=1
δ
jkqi
d(
˜
L
q
,
˜
0) =
r
∑
j=1
b
j
m
j
∑
k=1
b
jk
m
∑
q=1
∑
N
i=1
α
i
δ
jkqi
∑
N
i=1
α
i
d(
˜
L
q
,
˜
0) = P.
As a corollary, if all sample units have the same
weight α
1
= . .. = α
i
= . .. = α
N
= α, then the
arithmetic mean of the individual evaluations P
i
,i =
1,. .. ,N, is equal to the global evaluation P.
3 EMPIRICAL APPLICATION
3.1 Description of the Questionnaire
We apply the individual and global assessments pre-
sented previously to the survey ”Finanzplatz Z
¨
urich:
Umfrage 2010” (BAK, 2010), which was conducted
by the Office of Economy of the canton of Zurich
(Switzerland) in 2010. The survey was intended to
understand the situation on the financial market of
the canton of Zurich. A sample of actors of the
place (mostly financial enterprises, e.g. banks or
insurances) were asked through a written question-
naire about their expectations of demand, income and
Individual and Global Assessments with Signed Distance Defuzzification, and Characteristics of the Output Distributions based on an
Empirical Analysis
77

employment for a foreseeable future. The question-
naire relative to this survey consisted principally of
21 questions divided into 4 groups. We note that 19
of these questions are linguistic ones with five possi-
ble answers going from 1 (bad) to 5 (good) while only
2 are quantitative.
3.2 Database and Set up of the
Evaluations
Our database is composed of 234 observations, with
among others company size and branch variables,
and the sampling weight. Considering our aim to
transform linguistics into a more precise form, the
19 five-level Likert questions have been treated only.
Finally, we have excluded the missing values and
treated our database as a complete cases one. The
consequence is that we will refer to 9 questions ex-
clusively. The questionnaire was decomposed into 3
equally weighted main-items where 2 of them have 2
sub-items and the third 5 sub-items.
The individual and global evaluations in a linguis-
tic questionnaire with the signed distance are imple-
mented in R (R Core Team, 2015). Assuming tri-
angular isosceles membership functions, the signed
distance of the corresponding fuzzy number
˜
L
q
=
(t
q−1
,t
q
,t
q+1
) is given by
d(
˜
L
q
,
˜
0) =
1
4
(t
q−1
+ 2t
q
+t
q+1
),
and it follows that the expression of the individual as-
sessment (7) is
P
( j)
i
=
1
4
m
j
∑
k=1
b
jk
m
∑
q=1
δ
jkqi
(t
q−1
+ 2t
q
+t
q+1
). (8)
We consider the five linguistic terms L
1
,. .. ,L
5
with the triangular fuzzy numbers
˜
L
1
,. .. ,
˜
L
5
where
˜
L
q
= ((q −1)(
t
m+1
m+1
),
t
m+1
m+1
,(q + 1)(
t
m+1
m+1
)), q = 1,..., 5.
One can easily compute the individual evaluation of a
main-item. In this case, we fix t
m+1
to 30, which gives
the following fuzzy numbers
˜
L
1
= (0,5, 10)
˜
L
2
= (5,10, 15)
˜
L
3
= (10,15, 20)
˜
L
4
= (15,20, 25)
˜
L
5
= (20,25, 30).
Table 2 gives an example of the individual evalua-
tion of an observation i from the treated database. We
note that in our case, we can easily prove that chang-
ing the value of t
m+1
do not affect the interpretation of
the assessments. In fact, it is nothing but a translation
to the new fuzzy numbers system.
3.3 Some Analysis on an Individual
Level
3.3.1 Company Size
Our first analysis is made by company sizes: Small,
Medium and Big companies. Some statistical mea-
sures appear in Table 3. Examining global assess-
ments, we see that the evaluation given by small
companies (18.09547) is higher than respectively
the evaluations given by medium (17.58005) and
big (16.89257) companies. This result indicates
that small companies expect better business than the
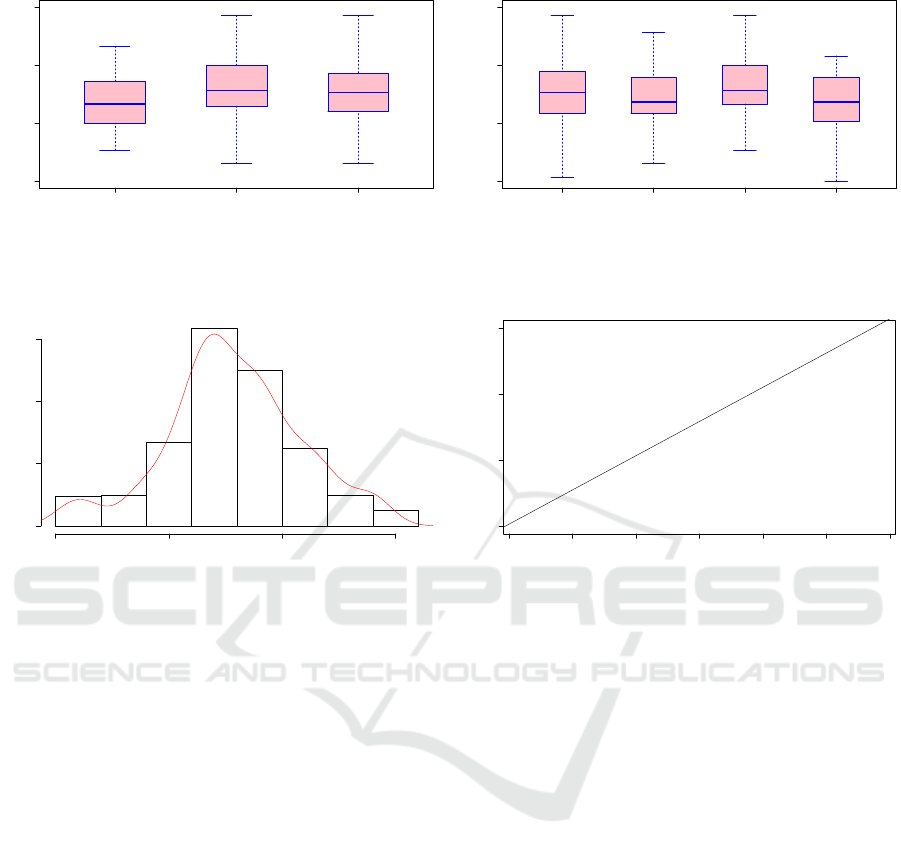
medium and the big ones. The boxplot Figure 1(a)
displays this result as well.
3.3.2 Company Branch
A second analysis can be made by company branches.
Four branches were considered: Banks, Specialised
financial services companies, Investment companies,
Insurance companies. The global assessment of the
Specialized finance services companies is the high-
est (18.27666) compared to the banks (17.43678),
Investment companies (17.38439) and Insurances
(16.98436), as seen in Table 4. Figure 1(b) shows
boxplots of the 4 types of companies where the Spe-
cialized finance services companies seem to have a
more positive vision to the future than other compa-
nies.
3.4 Normality of the Crisp Output
Distribution
(Berkachy and Donz
´
e, 2016b) emphasized different
statistical characteristics such as location, dispersion
and asymmetry measures of distributions obtained us-
ing the signed distance method compared to different
defuzzification methods. In the same way, since many
statistical tests rely on the normality of a sample, it
is advantageous to know whether the underlying dis-
tribution is symmetric or a fortiori tends to be nor-
mal. This can be done graphically via histograms and
QQ-plots or by calculating the skewness and excess
of kurtosis, and last but not least by using different
statistical normality tests.
The histogram and QQ-plot corresponding to the
output distribution (considering the whole dataset),
seen in Figure 2, give us a hint about the normality
hypothesis. We calculate as well the excess of kurto-
sis of this distribution and we get 0.14731 and a skew-
ness of -0.09489 signalizing a symmetric distribution.
At last, the normality tests used (Chi-square, Shapiro-
Wilk, Anderson-Darling, Kolmogorov-Smirnov and
FCTA 2016 - 8th International Conference on Fuzzy Computation Theory and Applications
78
●
●●
●
●
●
Big Small Medium
10 15 20 25
Boxplot of the output distributions obtained for different company sizes
Crisp output
(a) Classification by company size
●
●
●
●
●
●
Banks Invest. comp. Specialised financial services comp. Insurances
10 15 20 25
Boxplot of the output distributions obtained for different company branchs
Crisp output
(b) Classification by company branch
Figure 1: The output distributions classified by: company size (a) and company branch (b).
Histogram of output crisp distribution
Crisp output
Density
10 15 20 25
0.00 0.05 0.10 0.15
(a) Histogram of crisp distribution
●
● ●
● ● ● ●
●●●●●
●
●
●
●
●●
●●●
●●
●
●●
●
●
●●●●●●
●●●
●
●●●●●
●
●●●●●●●●●
●
●●●●●●●●●
●
●●●●●
●●●●●●●●●●●●●●
●●●●●●●
●●●●●●●
●●●●●
●●●●●●●
●●●●●●
●●●●●●
●●●●●
●●●
●●
●●●●●
●●●●●●●●●
●●●●●
●●●
●●●●●●●
●●●●●●●
●●●●
●●
●●●●
●●●●
●●●●●●
●
●●●
●●●●●●●●●●
●
●
●●●●●
●●●
●●●●●
●●
●●
●
●●●
●●
●●
● ●
● ● ●
●
−3 −2 −1 0 1 2 3
10 15 20 25
Normal Q−Q Plot
Theoretical Quantiles
Sample Quantiles
(b) QQ-plot of crisp distribution
Figure 2: The histogram (a) and qqplot (b) of the output distributions.
Lilliefors) couldn’t reject the hypothesis H
0
of the
normality of the distribution.
3.5 Analyses on Original Data vs.
Evaluations through Fuzzy Logic
Statistical inference is described as the most substan-
tial way of thinking regarding data analysis. Despite
the fact that evaluations noted previously are quan-
titative and therefore should present less imprecision
than the linguistic terms, some analyses can be done
on the original data. Nevertheless, a fuzzy approach
could be advantageous in several situation.
First of all, it has to be mentioned that evaluations
through fuzzy logic offer the possibility to charac-
terise units by their individual assessments and thus
give another way for interpretations. We have done
this kind of analyses for instance in section 3.3. Fur-
thermore, we note that the resulting distribution of the
outputs, as seen in section 3.4, tends to be normal,
which is a nice property for statistical inferences.
Secondly, on a global level, we show that the mean
of the means works as well as our aggregative evalua-
tion. It is a useful property, especially when it comes
to illustrate broadly information about the question-
naire. Last but not least, and it is a recurrent draw-
back when missing values occur, the mean of means
applied on linguistic data cannot be “representative”,
especially if missingness is not ramdom and the esti-
mates are biased. We present our measures under the
assumption of no missing values. Indeed, it is not dif-
ficult to show that the global evaluation measure can
be adapted in the case of missing values appearing in
a dataset.
4 CONCLUSION
Due to the particularities of the variables — qualita-
tive answers, the traditional treatment methods of lin-
guistic questionnaires could encounter many difficul-
ties. For instance the non-normality of the distribution
could gravely impair the statistical inferences. Or, the
results appear difficult to interpret. An approach with
the fuzzy logic, and individual and global assessments
could be an alternative way.
This study intends to present the individual and
global assessments in linguistic questionnaires, an ef-
ficient method to manage uncertainty in this kind of
questionnaires. Based on the signed distance defuzzi-
Individual and Global Assessments with Signed Distance Defuzzification, and Characteristics of the Output Distributions based on an
Empirical Analysis
79

fication method, we estimated easily these evaluations
in the fuzzy sense, considering furthermore the sam-
pling weights in real databases. The signed distance
calculations are made with triangular isosceles fuzzy
numbers.
Moreover, in order to help using our method in
empirical research, we applied these evaluation meth-
ods on a real dataset coming from a survey of the
financial place of Zurich (Switzerland). This empir-
ical part should give confidence that the individual
and global assessments are easily implementable, and
could provide interesting results.
From another side, the non-normality of distribu-
tions is one of the most appealing topics in statisti-
cal inference. Yet, we examined the normality of the
output distributions and we found that the individual
evaluations with the signed distance method tend to
be normally distributed. This result can be profit-
making in terms of adequacy of data in further sta-
tistical analysis. Applying individual evaluation will
enable us to assess easily topics in linguistic question-
naires per observation through fuzzy logic.
Finally, future work certainly encompasses the
understanding of the effect of normality and sym-
metry of such distributions in different statistical
modellings, investigating in particular databases with
missing values.
ACKNOWLEDGEMENT
The authors would like to thank the Office of Econ-
omy of the canton of Zurich (Switzerland) which pro-
vided the permission to use the database.
REFERENCES
BAK (November 2010). Finanzplatz z
¨
urich 2010, monitor-
ing, impact-analyse und ausblick. Technical report,
Amt fur Wirtschaft und Arbeit (AWA) des Kantons
Z
¨
urich.
Berkachy, R. and Donz
´
e, L. (2015). Linguistic question-
naire evaluation: global and individual assessment
with the signed distance defuzzification method. In
Advances in Computational Intelligence, Proceedings
of the 16th International Conference on Fuzzy Systems
FS’15, Rome, Italy, volume 34, pages 13–20.
Berkachy, R. and Donz
´
e, L. (2016a). Linguistic question-
naire evaluation: an application of the signed distance
defuzzification method on different fuzzy numbers.
the impact on the skewness of the output distributions.
International Journal of Fuzzy Systems and Advanced
Applications, 3:12 – 19.
Berkachy, R. and Donz
´
e, L. (2016b). Statistical characteris-
tics of distributions obtained using the signed distance
defuzzification method compared to other methods.
In Proceedings of the International Conference on
Fuzzy Management Methods ICFMSquare, Fribourg,
Switzerland, pages 48–58.
Lin, L. and Lee, H. (2009). Fuzzy assessment method on
sampling survey analysis. Expert Systems with Appli-
cations, 36(3):59555961.
Lin, L. and Lee, H. (2010). Fuzzy assessment for sampling
survey defuzzification by signed distance method. Ex-
pert Systems with Applications, 37(12):78527857.
R Core Team (2015). R: A Language and Environment for
Statistical Computing. R Foundation for Statistical
Computing, Vienna, Austria.
Runkler, T. A. (1997). Selection of appropriate defuzzifi-
cation methods using application specific properties.
IEEE Transactions on Fuzzy Systems.
Wagner, C., Miller, S., and Garibaldi, J. M. (2011). A fuzzy
toolbox for the r programming language. In IEEE In-
ternational Conference on Fuzzy Systems, Taipei, Tai-
wan, pages 1185–1192. IEEE.
Yager, R. R. (1996). Knowledge-based defuzzification.
Fuzzy Sets and Systems, 80(2):177–185.
Yao, J. and Wu, K. (2000). Ranking fuzzy numbers
based on decomposition principle and signed distance.
Fuzzy sets and Systems, 116(2):275–288.
Zadeh, L. (1996). Fuzzy Sets, Fuzzy Logic, and Fuzzy Sys-
tems: Selected Papers of Lotfi A. Zadeh, G. J. Klir and
B. Yuan, Eds., Advances in Fuzzy Systems – Applica-
tions and Theory, volume 6. World Scientific.
Zimmermann, H. (2010). Fuzzy set theory. Wiley Interdisci-
plinary Reviews: Computational Statistics, 2(3):317–
332.
FCTA 2016 - 8th International Conference on Fuzzy Computation Theory and Applications
80

APPENDIX
Table 2: Application of the individual evaluation on Finanzplatz Zurich Umfrage 2010: Answers of an observation i for the 3
main-items equally weighted using the signed distance of triangular fuzzy numbers.
Main-items Weights Sub-items Weights Linguistics Answers Signed Individual
B
j
b
j
B
jk
b
jk
L
q
δ
jkqi
Distance Evaluation
1
1
3
The present state of 0.5 bad 0 20 14.333
business is L
2
0
fair 0
L
4
1
excellent 0
The expected state of 0.5 worst 0 15
business in 12 months is L
2
0
same 1
L
4
0
better 0
2
1
3
The demand for our services / products 0.5 smaller 0 10
compared to the last 12 months is L
2
1
same 0
L
4
0
bigger 0
The expected demand for our services / 0.5 worst 0 15
products in the next 12 months is L
2
0
same 1
L
4
0
better 0
3
1
3
The gross profit compared 0.2 smaller 0 10
to the last 12 months is L
2
1
same 0
L
4
0
bigger 0
The employment compared 0.2 smaller 0 15
to the last 12 months is L
2
0
same 1
L
4
0
bigger 0
The expected gross profit 0.2 worst 0 10
in the next 12 months is L
2
1
same 0
L
4
0
better 0
The expected employment in 0.2 worst 0 15
the next 12 months is L
2
0
same 1
L
4
0
better 0
The expected use of technical and 0.2 smaller 0 15
personal capacities in the next L
2
0
12 months is same 1
L
4
0
bigger 0
Individual and Global Assessments with Signed Distance Defuzzification, and Characteristics of the Output Distributions based on an
Empirical Analysis
81

Table 3: Statistical measures of the distribution obtained from individual evaluations: Classification by company size.
Company size
Statistical measure Small Medium Big
Mean 18.09547 17.58005 16.89257
Median 17.83333 17.66667 16.66667
Variance 9.65144 7.21249 5.55479
Standard deviation 3.10667 2.68561 2.35686
Skewness -0.21248 -0.05683 0.32202
Excess of Kurtosis 0.14485 0.45263 -0.72025
Quantiles:
P = 0 10.33333 10 12.66667
P = 0.25 16.5 16 15
P = 0.5 17.83333 17.66667 16.66667
P = 0.75 20 19.33333 18.66667
P = 1 24.33333 25 21.66667
Table 4: Statistical measures of the distribution obtained from individual evaluations: Classification by company branch.
Company branch
Statistical Banks Specialised financial Investment Insurance
measure services companies companies companies
Mean 17.43678 18.27666 17.38439 16.98436
Median 17.66667 17.83333 16.83333 16.83333
Variance 9.17247 8.20156 10.11543 7.02378
Standard deviation 3.02861 2.86384 3.18048 2.65024
Skewness -0.43497 -0.03864 0.13030 0.31873
Excess of Kurtosis -0.21930 0.38951 -0.33553 1.65608
Quantiles:
P = 0 10.33333 10.66667 10.83333 10
P = 0.25 15.83333 16.66667 15.83333 15.16667
P = 0.5 17.66667 17.83333 16.83333 16.83333
P = 0.75 19.5 20 19 19
P = 1 24.33333 24.33333 23.83333 25
FCTA 2016 - 8th International Conference on Fuzzy Computation Theory and Applications
82
