
Analyzing a Knowledge Country
How is Sweden Managing its Innovation Process?
Maria Obeso
1
and Maria Jesus Luengo-Valderrey
2
1
Department of Business Administration, University of Cantabria, Avenida de los Castros, Santander, Spain
2
Department of Management Evaluation and Business Innovation, University of the Basque Country, Bilbao, Spain
Keywords: Knowledge Country, Sweden, Innovation, Knowledge Management, Innovation Strategy.
Abstract: In a scenario where knowledge is considered an essential tool for firms and organizations, the paper
presented an analysis about how Sweden, considered as a knowledge country, manages its innovation
process. First, the paper presents the measures that Sweden government are doing, exposing the essential
points in its innovation strategy. Then, the behaviour of Swedish enterprises related to innovation is
analysed. Using an ANOVA technique, the paper shows that there are not differences between Swedish
regions managing innovation, but there are differences between industries. After that, a comparison between
industries in order to analyse which are the differences has been realized. Results show that machinery and
retail industries are the most innovative, and fabricated metal industry is considered the least innovative.
Although there are differences between industries, results show that in general Swedish enterprises are
innovative because only a 9 per cent of enterprises have not realized something related to innovation
process.
1 INTRODUCTION
At the present time, knowledge is considered an
essential tool for organizations to achieve a
competitive advantage. (Nonaka and Takeuchi,
1995; Von Krogh, 2012), to such an extent that it
has been claimed that we live in a Knowledge
Society (Sakaiya, 1991). But not all organizations
and enterprises manage their knowledge in the same
way leading to differing business outcomes.
This paper examines how a country like Sweden,
considered as a knowledge country (Sarabia et al.,
2012), manages its innovation activity. This includes
both the actions of the Government and also, how
enterprises manage this activity. This case is of
particular interest because according to Sarabia et al.
(2012) Sweden represents an example for other
countries to follow. Therefore, the main question is:
how does Sweden (both the government and at
business level) manage innovation activity?
In order to answer this question, the paper is
structured as follows: First, a theoretical framework
is presented highlighting innovation activity. Then,
the Swedish case is presented, analyzing in the first
place the government´s own program and then the
behaviour of individual Swedish companies; in order
to analyze the last point, an empirical analysis is
presented using ANOVA to determine if there are
differences between industries and/or regions
(region 1: Stockholm-Solna, region 2: Boras,
Goteborg, Jonkoping, Trollhattan-Vanersborg,
region 3: Malmo-Lund and region 4: Linkoping,
Orebro, Karlstad, Vasteras). Finally, the conclusions
of the study are presented along with the principal
findings, implications, limitations and future
research possibilities.
2 INNOVATION
Innovation is defined as “the implementation of a
new or significantly improved product (goods or
services), or process, a new marketing method, or a
new organisational method in business practices,
workplace organisation or external relations” (Oslo
Manual, 2005: 46). That is to say, innovation is
related to the idea of change or something new
(Formichella, 2005) and it is considered a
knowledge process with the aim of create new
knowledge and developing solutions (Herkema,
2003).
Innovation is essential for both survival and
124
Obeso, M. and Luengo-Valderrey, M.
Analyzing a Knowledge Country - How is Sweden Managing its Innovation Process?.
DOI: 10.5220/0006036801240131
In Proceedings of the 8th International Joint Conference on Knowledge Discovery, Knowledge Engineering and Knowledge Management (IC3K 2016) - Volume 3: KMIS, pages 124-131
ISBN: 978-989-758-203-5
Copyright
c
2016 by SCITEPRESS – Science and Technology Publications, Lda. All rights reserved

competitiveness, whether for individual enterprises
or for countries (OECD, 2010). This process
contributes towards economic growth (Schumpeter,
1934) and plays an essential role in regional
development (Schiuma and Lerro, 2008), with
governments playing a role in stimulating innovative
activity in individual enterprises (Gondora et al.,
2010). Therefore research on this topic is of great
importance for present-day society because it helps
to create an environment of sustainability (Luengo
and Obeso, 2012).
The innovation process is also linked to research
and development activity. Regarding the previous
paragraph, within innovative enterprises there are
R&D workers, and these workers are important for
establishing knowledge networks and the business
outcomes of the firm (Huber, 2013). Following
Humerlinna-Laukkanen et al., (2012), R&D is
linked to innovation performance and innovation
networks and, R&D is itself influenced by capability
and network stability. In other words there is a direct
relationship between innovation and the
performance of the firm in question (Liao et al.,
2010).
Innovation management is defined as “a process
of change, incremental or substantial, in products,
processes, organization and/or marketing that
includes all the enterprise and involves interaction
with environment” (Camio et al., 2014: 31).
Additionally, innovation management includes the
relationships within the organization that influences
the innovation process, whether between employees
between the organization and the environment
(Arango Londono, 2012).
3 THE CASE OF SWEDEN
3.1 Government´s Programme
The importance of innovation for the Swedish
government is demonstrated by the fact that they
have devised a plan for innovation, proposing an
innovation strategy for the entire country. This plan
has been made universally available in order to
promote innovation. The plan is entitled The
Swedish innovation strategy and its stated purpose is
“to contribute to a climate with the best possible
conditions for innovation in Sweden with year 2020
in sight” (Government Offices of Sweden, 2015: 5).
The main information contained in this document is
summarized in this section.
In more detail, the Swedish government has three
aims: (1) that Sweden contributes to innovative
solutions to global challenges, (2) that Sweden
increases its competitiveness in a global world
where knowledge is an essential activity, and (3) that
public services in Sweden achieve greater efficiency.
In order to achieve these aims, the strategy has
three pillars: (1) providing the best possible
conditions for innovation, (2) the people, businesses
and organisations that work systematically with
innovation and (3) implementation of the strategy
based on a holistic view. Subsections 3.1.1 to 3.1.3
discuss there in greater detail.
3.1.1 The Best Possible Conditions for
Innovation
This pillar is based on the personal skills and
infrastructure necessary to promote knowledge and
innovation. In this way, Swedish citizens must have
the necessary knowledge and skills needed in order
to contribute to the innovation process and, the
willingness to do so. The climate should also
promote innovation. In order to achieve this goal,
Swedish government has developed various
proposals.
With respect to individuals and their skills and
levels of willingness, Sweden should continue
investment in its educational system, which is seen
as essential in imparting knowledge and promoting
willingness, creativity, innovation and
entrepreneurship without gender or racial
stereotypes. These developments should be
implemented in close partnership with the business
world to adapt the learning process to the
requirements of business.
Inside the educational system, higher education
plays a fundamental role because universities are the
cradle of knowledge. The Swedish government
wants the quality of education and research in
Sweden to reach the highest international quality
standards and measures have been implemented to
achieve this goal.
On the one hand, the government wishes to
promote excellence in university level research by
developing an environment where both Swedish and
foreign researchers can carry out innovative work.
To achieve this, a law has been passed supporting
knowledge-based research conducted by students
and researchers. In addition, incentives to encourage
cooperation between universities and wider society
are already in place in Swedish universities.
On the other hand, research institutes are also
important in innovation activity, therefore
collaboration between these institutes, universities,
industries and public administration should be
Analyzing a Knowledge Country - How is Sweden Managing its Innovation Process?
125

promoted. The activities of the Industrial Research
Institute, created with the aim of supporting small
and medium businesses in their innovation process,
is of particular note in this area.
Knowledge sharing is related to mobility. In this
sense, the Swedish proposal aims to facilitate
mobility between business, organizations, industries,
regions and even countries to share different
knowledge. In addition, a diverse and innovative
workplace will be attractive to foreign workers, the
European Union being useful in this respect because
it opens Sweden up to a wider labor market.
Finally the government should develop an ideal
framework where positive attitudes to
entrepreneurship and innovation in society become
reality. In this framework inventions and intellectual
property are protected and taxes and lend capital is
equity.
3.1.2 People, Businesses and Organisations
that Work Systematically with
Innovation
Swedish organizations must have the knowledge
necessary to achieve a world-class capacity for
innovation. Therefore Sweden needs to develop
internationally competitive conditions to promote
cooperation and competition, facilitating the growth
of small and medium-sized businesses that are
primarily related to the process of innovation.
Linked to this goal, cooperation is considered an
essential condition for sharing knowledge and
innovation. This includes not only Swedish agencies
like universities, public administration, institutes and
small, medium and large enterprises, but also foreign
businesses. In this sense, internationalization is
presented as a convenient tool for enterprises,
because learning related to other cultures and
languages opens a door for the future.
The Swedish government will promote
innovative businesses and create collaboration
between agencies and the new information and
communication technologies (ICTs), a key resource
for increasing national and international potential in
small and medium firms.
The challenge for the government is to
communicate the idea that knowledge and
entrepreneurship are the key to producing and
developing new goods, services, systems and
business models and, therefore necessary for
raising competitiveness.
In addition, public services play an essential role
because they should be innovative, collaborative and
efficient, with a high level of quality and
availability. In this way, public services will
promote opportunities for innovation by developing
initiatives that support this process. Public
administration is essential for collaborate with
agencies and increasing innovation and
competitiveness.
3.1.3 Implementation of the Strategy based
on a Holistic View
Planning is very important, but implementation is
also fundamental. The starting point is the existing
interrelationship between Swedish agencies that
have an influence on the strategy and with foreign
agencies, or in other words: Swedish strategy should
take a holistic view where the result is the sum of the
parts.
The Swedish Government is faced with the
challenge of creating and promoting an innovative
environment while paying attention to the different
areas and social actors. Success therefore is
dependent on, an implementation strategy that
includes a bilateral relationship between government
and other players with the government keeping up to
date about the evolution of this situation
The aim is that Sweden will be a source of global
inspiration for other countries because of its strong
innovative climate.
3.2 What Swedish Companies do?
3.2.1 Data Collection and Methodology
Data has been collected in Sweden by the World
Bank, covering the period between January 2014
and November 2014. A total of 600 businesses were
successfully interviewed about their activities during
the previous year (2013). In the information
provided on data collection, it is stated that, the
sample for Sweden was selected using stratified
random sampling in order to make sure that the
final, complete sample included establishments from
all different sectors and that unbiased estimates for
different subdivisions of the whole population were
obtained. The data included questionnaire-based
responses to questions in the following areas:
general information, infrastructure and services,
sales and supplies, degree of competition,
innovation, capacity, land and permits, crime,
finance, business-government relations, labor,
business environment and performance.
The database was obtained from the Microdata
Library, a service established by Enterprise Surveys
( World Bank) to provide information about people
KMIS 2016 - 8th International Conference on Knowledge Management and Information Sharing
126

living in mainly developing countries (World Bank,
2016), but information has also been collected on
certain developed countries such as Sweden.
The companies surveyed belonged to the
following industries: fabricated metals, machinery
and equipment, other manufacturing, automotive
services, other services and retail (six categories).
The authors of the present study had access to the
database in April 2016, when the last available data
for Sweden dated from 2013.
For the analysis, an Analysis of Variance
(ANOVA) has been used. ANOVA is a statistical
method used with the aim of comparing different
groups with respect to one or more quantitative
variables. In this way the method is used to analyze
whether or not differences exist between groups
(Hair et al., 1995).
3.2.2 Analysis about Swedish Enterprises
The starting point was to analyze the differences
between Swedish companies managing innovation in
different industries in Sweden The following
variables related to innovation activity were
selected: whether the company had recently
introduced new or significantly improved products
or services (h1), the introduction or otherwise of
any new or significantly improved methods of
manufacturing products or offering services (h3), the
introduction of any new or significantly improved
logistics, delivery, or distribution methods for
inputs, products or services (h4a), the introduction of
any new or significantly improved systems or
activities to support their main operations, such as
maintenance systems or operations for purchasing,
accounting or computing (h4b), the introduction of
any new or significantly improved organizational
structures or management practices (h5), the
introduction of new or significantly improved
marketing methods (h6), and money spent on formal
research and development (R&D) activities, either
in-house or contracted out to other companies (h7).
In all cases, using Levene´s test, the null hypothesis
was rejected if a significance of less than 0.05 was
obtained, indicating that variances between variables
are different (see Table 1). Potential differences in
innovative activity between the 6 industrial sectors
were also tested. .
Then a post-hoc comparison was carried out
using T2 from Tamhane´s test (see Table 2).
Significant differences of less than 0,05 were found
between industrial sectors for all variables except for
h3, h4a, h4b and h5, thus confirming significant
differences in variance between industries linked to
the following variables: h1, h6 and h7.
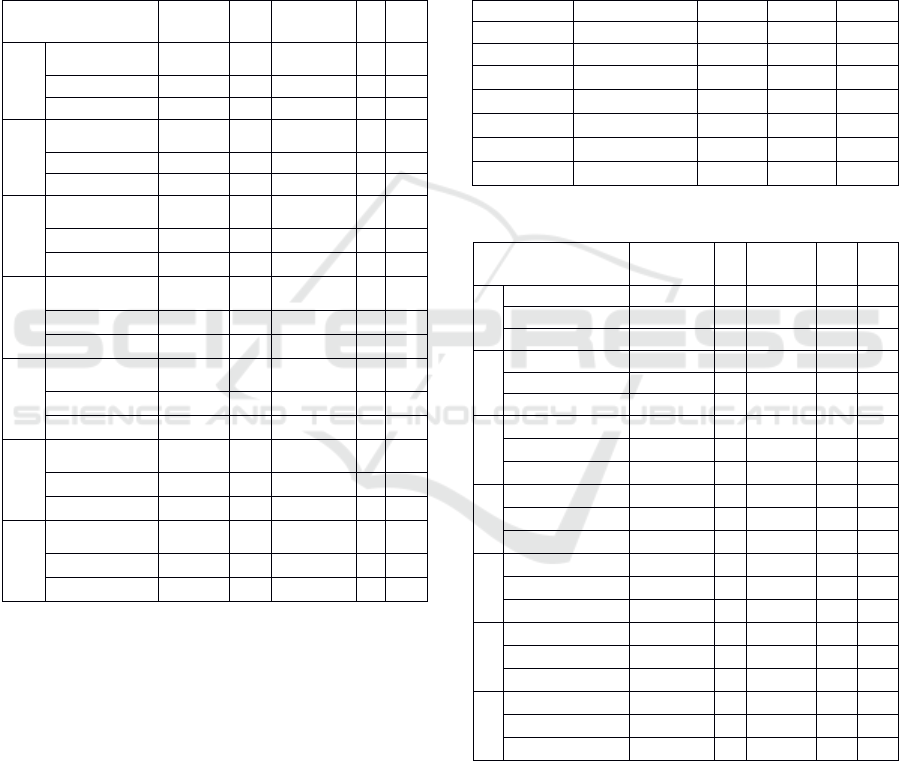
Table 1: Levene´s test linked to industries in Sweden.
Variable
Levene´s test d.f1 d.f2 Sig.
h1
13,156 5 559 0,000
h3
3,808 5 559 0,002
h4a
3,489 5 559 0,004
h4b
5,499 5 559 0,000
h5
3,370
5
559 0,005
h6
4,532 5 559 0,000
h7
45,376 5 559 0,000
Moreover, the same Analysis of Variance
technique (ANOVA) was repeated in order to
discover if there were possible differences in how
companies managed innovation between the four
regions in Sweden From this starting point, the
same variables were selected (h1, h3, h4a, h4b, h5,
h6 and h7) as in the previous analysis. However, in
this case applying Levene´s test to the results gave a
value of more than 0.05 in all cases except for h4a
and h4b, and therefore the null hypothesis could not
be rejected in h1, h3, h5, h6 and h7. That is to say,
there were no differences between variances in these
variables.
To confirm the obtained results post-hoc
comparison was performed using T2 from
Tamhane´s test (see Table). Results show that the
significance was greater than 0,05 in all cases, and
that, therefore, geographical location (as defined by
the region variable) did not influence the results.
It was additionally considered useful to examine
exactly what innovation activities occurred within
each industry Subsections 3.2.3 to 3.2.7 deal with
the different kinds of industry. Section 3.2.8 presents
a comparison between them.
3.2.3 Fabricated Metals (Ind1)
There were 117 businesses (n) included in the
fabricated metal industry (ind1) with an average age
of around 39 years (b5) and their market was
predominantly national (64,15 per cent of sales
were national) (d3a). The majority of businesses
were small to medium size (almost 75 per cent) (see
Figure 1) and the average growth, measured using
differences in the number of employees between the
year of the survey and three years previously was
around 2,86 per cent (L2) (see Table 5).
This industry was characterized by low levels of
innovative behaviour. Only 68,4 per cent of
businesses, the lowest figure for any industry, had
introduced new products or services in the previous
three years. And only 53 per cent of firms had
Analyzing a Knowledge Country - How is Sweden Managing its Innovation Process?
127
introduced new products or services to the market
(h2), again the lowest figure. Similarly, only 36 per
cent of firms had introduced new logistics in the
previous three years, with around 56 per cent
introducing new maintenance systems and around 36
per cent introducing new marketing methods. With
respect to investment in R&D, the percentage of
businesses making an investment was also lower, at
only 35,9 per cent and investment in formal training
for employees was also the lowest (62.4 per cent).
Table 2: ANOVA results by industries in Sweden.
Variable
Sum of
squares
df
Mean
square
FSig.
h1
Between group
s
2,304 5 0,461
2,55
2
0,027
Within group
s
100,959 559 0,181
Tot
a
103,264 564
h3
Between group
s
1,138 5 0,228
0,95
2
0,447
Within group
s
133,633 559 0,239
Tot
a
134,772 564
h4a
Between group
s
1,598
5
0,320
1,34
8
0,242
Within group
s
132,515
559
0,237
Tot
a
134,113
564
h4
b
Between group
s
2,178
5
0,436
1,87
3
0,097
Within group
s
130,024
559
0,233
Tot
a
132,202
564
h5
Between group
s
1,174
5
0,235
1,05
7
0,384
Within group
s
124,270
559
0,222
Tot
a
125,444
564
h6
Between group
s
8,716
5
1,743
7,35
3
0,000
Within group
s
132,513
559
0,237
Tot
a
141,228
564
h7
Between group
s
13,734
5
2,747
12,8
5
0,000
Within group
s
119,452
559
0,214
Tot
a
133,186
564
3.2.4 Machinery (Ind2)
There were 112 businesses included in the
machinery industry (ind2) with an average age of
around 45 years with sales mainly proceeding from
direct exports (d3c) (44,19 per cent) follow very
closely by national sales (43,79 per cent). The
majority of businesses were classified as medium or
large (see Figure 1) and the average growth was 5,23
per cent (see Table 5).
The machinery industry was characterized by its
proactive approach to innovative activities. More
than 87 per cent of businesses had introduced new
products or services in the previous three years and,
of these, almost 78 per cent were also new to the
market. In addition, 67 per cent of businesses had
introduced new process in the previous three years,
with 36,6 per cent introducing new distribution
methods, more than 62 per cent introducing new
maintenance systems and 72,3 per cent of
enterprises introducing new structures (the highest
figure of any industry). In addition, investment in
R&D was also the highest (almost 60 per cent of
businesses having invested in research and
development) (see Table 5).
Table 3: Levene´s test by regions in Sweden.
Variable
Levene´s test d.f1 d.f2 Sig.
h1
1,736 3 561 0,159
h3
1,502 3 561 0,213
h4a
5,902
3
561 0,001
h4b
3,116
3
561 0,026
h5
1,520
3
561 0,208
h6
0,023
3
561 0,995
h7
1,627
3
561 0,182
Table 4: ANOVA test linked to regions in Sweden.
Variable
Sum of
squares
d
f
Mean
square
F
Sig.
h1
Between groups 0,226 3 0,075
0,411 0,745
Within groups 103,038 561 0,184
Total 103,264 564
h3
Between groups 0,415 3 0,138
0,578 0,630
Within groups 134,357 561 0,239
Total 134,772 564
h4a
Between groups 1,285
3
0,428
1,810 0,144
Within groups 132,828
561
0,237
Total 134,113
564
h4b
Between groups 0,842
3
0,281
1,198 0,310
Within groups 131,360
561
0,234
Total 132,202
564
h5
Between groups 0,224
3
0,075
0,334 0,801
Within groups 125,221
561
0,223
Total 125,444
564
h6
Between groups 0,217
3
0,072
0,287 0,835
Within groups 141,012
561
0,251
Total 141,228
564
h7
Between groups 0,346
3
0,115
0,487 0,692
Within groups 132,840
561
0,237
Total 133,186
564
3.2.5 Other Manufacturing (Ind3)
There were 115 businesses included in the other
manufacturing industry category (ind3) with an
average age of around 52 years (the highest average)
and their sales mainly proceeded from national
activity (almost 66 per cent). The majority of were
classified as medium or large (see Figure 1) and the
KMIS 2016 - 8th International Conference on Knowledge Management and Information Sharing
128
average growth was the lowest at 2,23per cent (see
Table 5). It seems that this industry is largely
composed of mature enterprises.
Table 5: Comparison between industries.
Ind1 Ind2 Ind3 Ind4 Ind5 Ind6
n
117 112 115 73 83 65
b5
39,48 45,04 51,5 35,21 26,46 18,57
b7
21,68 20,7 22,7 26,71 24,08 24,25
d3a
64,15 43,79 65,9 95,89 90,69 96,55
d3b
17,35 11,13 10,23 1,01 1,58 0,08
d3c
18,5 44,19 23,86 3,1 7,73 3,37
L2
2,86 5,23 2,23 9,38 5,25 6,13
L9a
10,9 10,98 11,14 11,5 12,2 -
h1
68,4 87,5 75,7 72,6 73,5 76,9
h3
65 67 55,7 58,9 56,6 58,5
h4a
36,8 36,6 32,2 39,7 44,6 49,2
h4b
56,4 62,5 68,7 68,5 53 69,2
h5
64,1 72,3 68,7 67,1 57,8 69,2
h6
36,8 47,3 37,4 68,5 55,4 67,7
h7
35,9 59,8 48,7 11 32,5 23,1
L10
62,4 66,1 73 79,5 69,9 80
h2
53,8 77,6 71,3 77,4 78,7 64
Figures for innovative activity were as follows:
75,7 per cent of enterprises had introduced new
products or services, and of these, more than 71 per
cent were also new to the market. Figures linked to
new processes and logistics were the lowest (at 55,7
and 32,2 per cent respectively). Around 68 per cent
of businesses had introduced new maintenance
systems and structures, and the figures concerning
the introduction of new logistics and new marketing
methods were 32,2 and 37,4 respectively. Finally
investment in R&D was in the middle (around 49
per cent) and investment in formal training was high
(73 per cent) (see Table 5).
3.2.6 Automotive Services (Ind4)
There were 73 businesses included in the
Automotive services industry (ind4) with an average
age of around 35 years and with sales mainly
proceeding from the national market (more than 95
per cent). The average score for manager
experience was the highest, at almost 27 years of
experience. The majority of enterprises were
classified as small or medium (see Figure 1) and
average growth was the highest (9,38 per cent) (see
Table 5). This industry therefore experienced the
fastest growth over the previous three years, as
measured by rise in total number of employees .
The automotive services industry stood out in
terms of marketing innovations: almost 69 per cent
of businesses having introduced a new marketing
method in the previous three years, the highest
figure. In addition, the investment in formal training
was also high (around 80 per cent). However the
investment in R&D activity was the lowest, with
only 11 per cent of firms investing in R&D.
Introduction of new products, process, logistics,
maintenance systems and structures was in the
middle (around 72, 60, 40, 68 and 67 respectively)
(see Table 5).
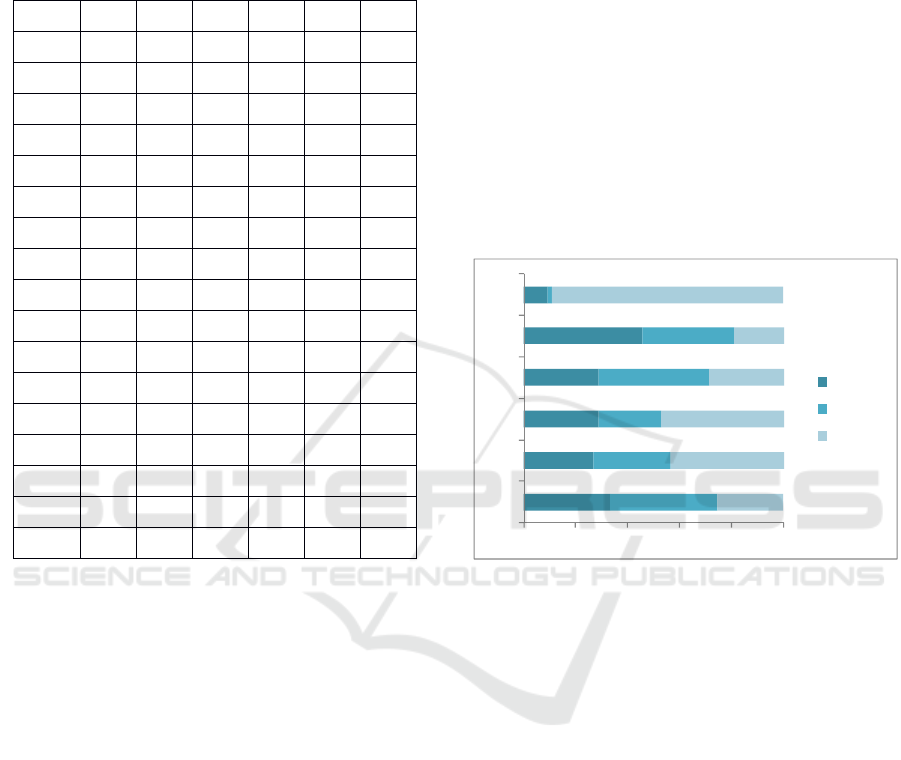
Figure 1: Size of business in each industry.
3.2.7 Other Services (Ind5)
83 businesses were included in the other services
category (ind5) with an average age of around 26
years, with sales proceeding mainly from national
activity (more than 90 per cent). The majority of
businesses were classified as small or medium (see
Figure 1) and the average growth was 5,25 per cent
(see Table 5).
Around 73 per cent of enterprises had introduced
new products or services, and of these, 78,7 were
new to the market (the highest figure). Investment in
R&D was medium (32,5 per cent) and investment in
formal training was medium to high (almost 70 per
cent). The other innovation variables were as
follows: new processes around 56, new logistics
around 45, new maintenance around 53, new
structures around 58 and new marketing methods
around 55 (see Table 5).
0 20406080100
Ind1
Ind2
Ind3
Ind4
Ind5
Ind6
small
medium
large
Analyzing a Knowledge Country - How is Sweden Managing its Innovation Process?
129

3.2.8 Retail (Ind6)
65 businesses were included in the retail industry
(ind6) with an average age of around 18 years (the
lowest) and where sales proceeded mostly from
national activity (more than 96 per cent). The
majority of businesses were classified as large (see
Figure 1) and average growth was 6,13 per cent (see
Table 5).
This industry stood out in investment in formal
training (80 per cent of businesses). 76,9 per cent of
businesses had introduced new products or services
and of these, 64 per cent were new to the market. In
addition, the retail industry made the largest
investments in introducing new logistics and
maintenance systems (around 49 and 69
respectively).
3.2.9 Differences between Industries
Based on previous information, and despite
differences between industries, the Swedish
businesses surveyed were proactive with respect to
innovation, with only around 9 per cent of the
sample not carrying out some activity linked to
innovative activity or R&D investment. All
remaining firms carried out at least some other
innovative activity.
With regard to differences between industries,
Firms in the machinery industry are ranked first in
introducing new products or services, and the
majority of these products or services were also new
for the market as a while. In general, analyzing all
the innovative variables, this industry could be
considered as overall the most innovative, because it
also ranks first in introducing new processes, and
structures and investment in R&D was also highest.
The remaining variables were also in the medium to
high range.
Another industry very much interested in
innovation activities was the retail industry: it has
introduced the most new logistics and maintenance
systems and made the highest investment in formal
training. It also ranked as medium to high on the
remaining variables.
However, the fabricated metal industry was
considered least innovative in comparison: in
general, it had introduced fewer innovations
(products, services, process, logistics, maintenance
systems, structures and marketing). In addition, it
had the lowest percentage of marketing innovations
and investment in formal training was also the
lowest.
4 CONCLUSIONS
In the present day where knowledge is presented as
an essential tool for achieving competitive
advantages, this paper has analysed how Sweden
manages innovation. Sweden makes for an
interesting case study because it is considered a
knowledge country, and therefore an example for
others.
In order to analyse the Swedish strategy, this
paper summarised the strategy of the Swedish
government and provided an analysis of how
individual companies manage their internal process
of innovation. As a result of this analysis certain
conclusions were obtained:
The Swedish government has a proactive
vision for innovation, highlighting its
importance for the future and planning
actions within an innovative strategy.
The Swedish government strategy has a clear
aim: to contribute towards a climate with the
best possible conditions for innovations in
2020.
The presence of such a plan indicates that
Sweden has thought about the innovation
process, and gives the very positive
impression that they have taken the first step
in order to achieve the goals.
Analysing the behaviour of individual firms ,
there were no differences between regions in
how innovation was managed
However, significant differences were
obtained between industries in how this was
achieved.
The Machinery industry was found to be the
industry with the most proactive vision for
innovation.
The Retail industry also proved to be an
innovative industry.
The fabricated metal industry was considered
the least innovative in this comparison, based
on the analysis of relevant innovation activity
variables
Although there were differences between
industries, the majority of Swedish
businesses had a proactive vision linked to
innovative activity and/or R&D investment.
This study and its findings prove to be
interesting both for Sweden and other countries. .
For Sweden the contributions are clear: the analysis
has presented the situation for the country in 2013,
therefore it provides feedback for the government on
their strategy. This analysis is also useful because
Sweden is considered an example of “a knowledge
KMIS 2016 - 8th International Conference on Knowledge Management and Information Sharing
130

country” that serves as an example and a reference
for other regions.
The study has certain limitations. First, it is a
static analysis because it includes data form only a
single year: 2013. In addition, the role for public
administration has only been analysed only from a
theoretical viewpoint. With regards to the last
limitation, a future research possibility would be to
expand this research by carrying out an empirical
analysis of innovation in Sweden more generally. In
addition, it would be useful to do another analysis in
2020, the time horizon considered, and make a
comparison between the situation before and after
the implementation of the strategy. Another
limitation relates to the services industry, which was
not examined in much detail in this article due to a
lack of relevant data, despite its importance to the
wider economy. Another future possibility for
research would be an exploration of this industry.
ACKNOWLEDGEMENTS
The authors would like to thank the World Bank
Database and Enterprise Surveys for allowing access
to the data.
REFERENCES
Arango Londono, J. F., 2012. La gestion de la innovación
como un ecosistema heterogéneo y estructurado.
Cuadernos de Gestion, 12: 125-137.
Camio, M. I., Rebori, A., Romero, M. C., 2014. Gestion
de la innovación. Estudio de casos en empresas de
software y servicios electrónicos de la zona de
influencia de la UNICEN, Argentina. Revista de
Administraçao e Innovaçao, 11(2): 3-50.
Formichella, M. M., 2005. La evolución del concepto de
innovación y su relación con el desarrollo, Working
paper, Estacion Experimental Agropecuaria Integrada
(convenio MAAAyP-INTA).
Gondora, G., Garcia, D., Madrid, A., 2010. Efecto del
apoyo publico sobre el comportamiento innovador y el
rendimiento en PYMES. Revista de Ciencias Sociales
(RCS), XVI(3): 400-417.
Government Offices of Sweden, 2016, The Swedish
Innovation Strategy. http://www.government.se/
contentassets/cbc9485d5a344672963225858118273b/t
he-swedish-innovation-strategy (accessed: 7 May
2016).
Hair, J. F., Anderson, R. E., Tatham, R., Black, W., 1995.
Multivariate data analysis, Prentice Hall. Englewood
Cliffs, NJ.
Herkema, S., 2003. A complex adaptative perspective on
learning within innovation projects, The Learning
Organization, 10(6), 340-346.
Huber, F., 2013. Knowledge-sourcing of R&D workers in
different job positions: contextualising external
personal knowledge networks, Research Policy, 42:
167-179.
Hurmelinna-Laukkanen, P., Olander, H., Blomqvist, K.,
Panfilii, V., 2012. Orchestrating R&D networks:
Absorptive capacity, network stability and innovation
appropriability, European Management Journal, 30:
552-563.
Liao, C., Wang, H-Y, Chuang, S-H, Shih, M. L., Liu, C-C,
2010. Enhancing knowledge management for R&D
innovation and firm performance: An integrative view,
African Journal of Business Management, 4(14):
3026-3038.
Luengo, M. J., Obeso, M., 2012. Innovation as value key:
the Spanish case, Proceedings of the 7
th
European
Conference on Innovation and Entrepreneurship,
Santarem, Portugal.
Nonaka, I., Takeuchi, H., 1995. The knowledge-creating
company: How Japanese companies create the
dynamics of innovation, Oxford University Press. New
York.
OECD, 2010. The OECD Innovation Strategy; Getting a
Head Start on Tomorrow. http://www.oecd.org/sti/
inno/theoecdinnovationstrategygettingaheadstartontom
orrow.htm (accesed 3 May 2016).
Oslo Manual, 2005. Guidelines for colecting and
interpreting innovation data. OECD, Eurostat.
http://www.oecd-ilibrary.org/science-and-technology/
oslo-manual_9789264013100-en (accessed 15 May
2016).
Sakaiya, T., 1991. The knowledge value revolution or a
History of the future, Kodansha. Tokio.
Sarabia, M., Obeso, M., Sarabia, J.M., 2012. How do
European countries manage their knowledge? A cross
analysis of investment and performance, Innovation:
Management, Policy and Practice, 14(1): 129-142.
Schiuma, G., Lerro, A., 2008. Knowledge-based capital in
building regional innovation capacity, Journal of
Knowledge Management, 12(5): 121-136.
Schumpeter, J. A., 1934. The theory of economic
development: An inquiry into profits, capital, credit,
interest and the business cycle, Harvard University
Press. Cambridge, MA.
Von Krogh, G., 2012. How does social software change
knowledge management? Toward a strategic research
agenda, The Journal of Strategic Information Systems,
21(2): 154-164.
World Bank, 2016. http://www.worldbank.org/ (accessed
1 May 2016).
Analyzing a Knowledge Country - How is Sweden Managing its Innovation Process?
131
