
Classification of Emotional Signals from the DEAP Dataset
Giuseppe Placidi
1
, Paolo Di Giamberardino
2
, Andrea Petracca
1
, Matteo Spezialetti
1
and Daniela Iacoviello
2
1
A
2
VI_Lab, c/o Department of Life, Health and Environmental Sciences, University of L’Aquila,
Via Vetoio, 67100, L’Aquila, Italy
2
Department of Computer, Control and Management Engineering Antonio Ruberti, Sapienza University of Rome,
Via Ariosto 25, 00185, Rome, Italy
Keywords: BCI, Emotional Signals, DEAP Dataset, Machine Learning, PCA, SVM.
Abstract: A Brain Computer Interface (BCI) is a useful instrument to support human communication, frequently
implemented by using electroencephalography (EEG). Regarding the used communication paradigm, a very
large number of strategies exist and, recently, self-induced emotions have been introduced. However, in
general the actual emotion-based BCIs are just binary, since they are capable of recognizing just a single
emotion. A crucial node is the introduction of more than a single emotional state for improving the
efficiency of a BCI. In order to be used in BCIs, signals from different emotional states have to be collected,
recognized and classified. In the present paper, a method for mapping several emotional states was
described and tested on EEG signals collected from a publicly available dataset for emotion analysis using
physiological signals (DEAP). The proposed method, its experimental protocol, and preliminary numerical
results on three different emotional states were presented and discussed. The method, based on multiple
binary classification, was capable of optimizing the most discriminative channels and the features
combination for each emotional state and of recognizing between several emotional states through a polling
system.
1 INTRODUCTION
BCIs provide new channels of output for the brain,
(Shih, 2012), yielding an enormous help to disabled
people (Shih, 2012; Kubler et al., 2005; Hochberg et
al., 2006). The neural activity is often recorded by
EEG (Fisch, 1999) and is based on event-related
signals (Babiloni et al., 2000). Recently, in (Placidi
et al., 2015a) an EEG-based BCI that used the
stimulus generated by the disgust produced by
remembering an unpleasant odor has been proposed
and it has been demonstrated to be particularly
useful for severely disabled people (Pistoia et al.,
2015).
Being the signals resulting by a self-induced
emotion weak, a series of competitive classification
strategies have been proposed (Placidi et al., 2015b;
Iacoviello et al., 2015a; Iacoviello et al., 2015b;
Iacoviello et al., 2015c). However, the BCI obtained
by using just “disgust” versus “relax” was only
binary, (Placidi et al., 2015c). In order to improve
Figure 1: Electrodes used in the 10-20 international brain
positioning system.
the efficiency of an emotional BCI (i.e. to increase
the cardinality of the “alphabet” and to reduce the
time necessary for communication), a series of
Placidi, G., Giamberardino, P., Petracca, A., Spezialetti, M. and Iacoviello, D.
Classification of Emotional Signals from the DEAP dataset.
DOI: 10.5220/0006043400150021
In Proceedings of the 4th International Congress on Neurotechnology, Electronics and Informatics (NEUROTECHNIX 2016), pages 15-21
ISBN: 978-989-758-204-2
Copyright
c
2016 by SCITEPRESS – Science and Technology Publications, Lda. All rights reserved
15

different emotions should be recognized and used
(Guler and Ubeyli, 2007). Before using different
emotions on a BCI, their characteristic expressions
(activation sites and specific features) have to be
discovered and compared. In the present paper, the
classification strategy proposed in (Iacoviello et al.,
2015c) is used on EEG signals collected in the
DEAP dataset (Koelstra et al., 2012), a database
containing a collection of physiological EEG signals
of emotions from different subjects both for negative
and positive emotions. In particular the participants
watched music videos and rated each video in terms
of arousal, valence, like/dislike, dominance, and
familiarity. As the subjects watched the videos, their
EEG and physiological signals were recorded. The
stimuli used in the experiment were selected in
different steps: first, 120 initial stimuli were
selected; then, a one-minute highlight part was
determined for each stimulus; finally, through a
web-based subjective assessment experiment, 40
final stimuli were selected. Being DEAP a reference
database for tagged EEG emotional signals freely
usable, we selected some of the stored experiments
in order to study the brain activations due both to
negative and positive emotions and to recognize the
most significant. In particular, goals of this paper
are: a) to verify that, for a subset of subjects from
the DEAP dataset, the activated brain region for a
negative emotion (negative valence and high
arousal) is located in the right brain hemisphere; b)
to classify positive emotions (high valence and high
arousal) from the selected subjects; c) to verify the
separation, in terms of activated channels and
selected features, between negative and positive
patterns; d) to propose a method for classifying
several emotional states to be used in future multi-
emotional BCI. The paper is organized as follows. In
Section II, the DEAP dataset and the experimental
protocol adopted are described along with the
considered classification method. In Section III the
obtained results are proposed and discussed, whereas
in Section IV the conclusions and future works are
outlined.
2 MATERIALS AND METHODS
The DEAP database consists of the EEG
physiological signals of 32 participants (16 men and
16 women, aged between 19 and 37, average: 26.9)
recorded while watching 40 one-minute long music
videos on different arguments. Before starting the
viewing, a two-minutes long EEG signal was
collected by each subject while relaxing watching a
fixation cross on the screen. The EEG signals,
sampled at 512 Hz, were recorded from the follo-
wing 32 positions (according to the international 10-
20 positioning system, see Figure 1): Fp1, AF3, F3,
F7, FC5, FC1, C3, T7, CP5, CP1, P3, P7, PO3, O1,
Oz, Pz, Fp2, AF4, Fz, F4, F8, FC6, FC2, Cz, C4, T8,
CP6, CP2, P4, P8, PO4, and O2. The proposed
music videos were demonstrated to induce emotions
to different users (Koelstra et al., 2012) represented
in the valence-arousal scale (Russell, 1980). The
participants had to rate each video in terms of
arousal, valence, like/dislike, dominance and
familiarity (the degree of valence and arousal was
ranged by using the self-assessment manikins
questionnaire). The same videos had an on-line
evaluation that could be used for comparison. The
videos were the same for all the participants but the
sequence of visualization for each subject was
random. As a first step, in the present study just the
dimensions valence and arousal were considered.
Data were provided both as they were acquired (raw
data) and in the preprocessed form. In this study, the
raw data were used and, before their usage, they
were filtered between 1 Hz and 46 Hz.
2.1 The Experimental Protocol
The main goal of this study was to use DEAP to map
the emotions through the EEG signals from different
subjects, by considering the results on the
classification of a strong negative emotion, the
disgust (Placidi et al., 2015b). To this aim, we
started by selecting subjects that experienced the
“strongest” and reciprocally “farthest” couple of
emotions, one corresponding to minimum negative
valence and maximum arousal (in the following
indicated with NVHA) and the other corresponding
to the maximum valence and maximum arousal (in
the following indicated with HVHA). Between the
selected subjects, we further selected those whose
self-assessment of NVHA and HVHA corresponded
to videos having the same on-line evaluation: this
was done in order to eliminate careless subjects
(possible cases of wrong evaluations). From the
selected subjects, besides the EEG signals corres-
ponding to these two emotional states, we extracted
the EEG signals corresponding to the relaxing phase.
In fact, after the selection of the subjects and of the
signals of the chosen emotions, we aimed at
classifying these two emotional states both with the
corresponding relaxing signals and reciprocally. The
one-minute signals corresponding to the emotional
state elicited by a music video was broken into non-
overlapping trials, 3.52 seconds long, and separately
NEUROTECHNIX 2016 - 4th International Congress on Neurotechnology, Electronics and Informatics
16
used for classification. In the same way, also the
relaxing signals was divided in contiguous trials of
3.52 seconds.
2.2 The Classification Method
The method introduced in (Iacoviello et al., 2015a;
Iacoviello et al., 2015c) aimed at the classification of
EEG signals induced by remembering the disgust
produced by unpleasant odor: it was a self-induction,
without any external stimulation. One of the
conclusions of that research was that the most
involved channels were the T8 and P4 ones, both
belonging to the right brain hemisphere. In the
present study, the same method was used to classify
trials from two classes at once corresponding,
respectively, to NVHA (E1) versus Relax (R),
HVHA (E2) versus Relax (R) and E1 versus E2,
thus implicitly allowing a multiclass classification
(through the construction of a polling system). The
signals herein considered were not self-induced and
corresponded to the disgust elicited while watching
music videos. Data from the DEAP dataset were
produced by an external stimulation and, since the
stimulation involved different aspects (videos,
music, secondary emotions, and so on) they
guaranteed low specificity, from the localization
point of view.
Each acquired signal g (trial) was first processed by
diadic Wavelet decomposition to extract just the
useful information content (Daubechies, 1992;
Mamun et al., 2013). To this aim the Meyer wavelet
was used to provide the wavelet
ϕ
transform:
C
d
(k2
− j
,2
− j
) = 2
j /2
g(n)
ϕ
2
j
k − n
()
n
(1)
thus decomposing the signal in the approximation
and in the detail coefficients. The level l=3 allowed
to retain the gamma and alpha bands of the original
signal yielding the CD
3
details representation in the
band (250/2
3
, 250/2
2
] Hz. After bands selection, the
trial was divided into q sub-trials having an
overlapping zone of p points (points in common
between consecutive sub-trials) to maintain
continuity between pieces. The overlapping region
has been introduced to avoid the exclusion of useful
information that could be present on the tails of
consecutive sub-trials. The classification used the
division in sub-trials in order to discard the noisy
pieces of each signal while retaining and averaging
the useful information (Petrantonakis and
Hadjileontiadis, 2011). In this set of sub-trials, a
group of
f
N characteristics describing the signal,
the features, was calculated; the most common
features used in literature (Subasi, 2007; Cvetkovic,
2008) and considered herein were: the mean and the
median values, f
1
and f
2
respectively, the mode f
3
(i.e. the most frequent value in a sub trial), the
largest and the smallest elements, f
4
and f
5
respecti-
vely, the range f
6
of the values and their standard
deviation f
7
, the mean value f
8
and the median f
9
of
the absolute value of the difference between the
vector and its mean value, the sum f
10
of all the
elements, the norm f
11
and the maximum value f
12
.
Since the set of the original features could be
redundant, their number was reduced to s by
applying the Principal Component Analysis (PCA)
in the modified form proposed in (Song et al., 2010).
In particular, the covariance matrix of the
standardized data was computed and its largest
eigenvalues, and its corresponding eigenvectors,
were selected. The selected features were the ones
with the higher weights in the covariance matrix.
Hence the classification of the signal was performed
through Support Vector Machine (SVM) by using
the remaining features.
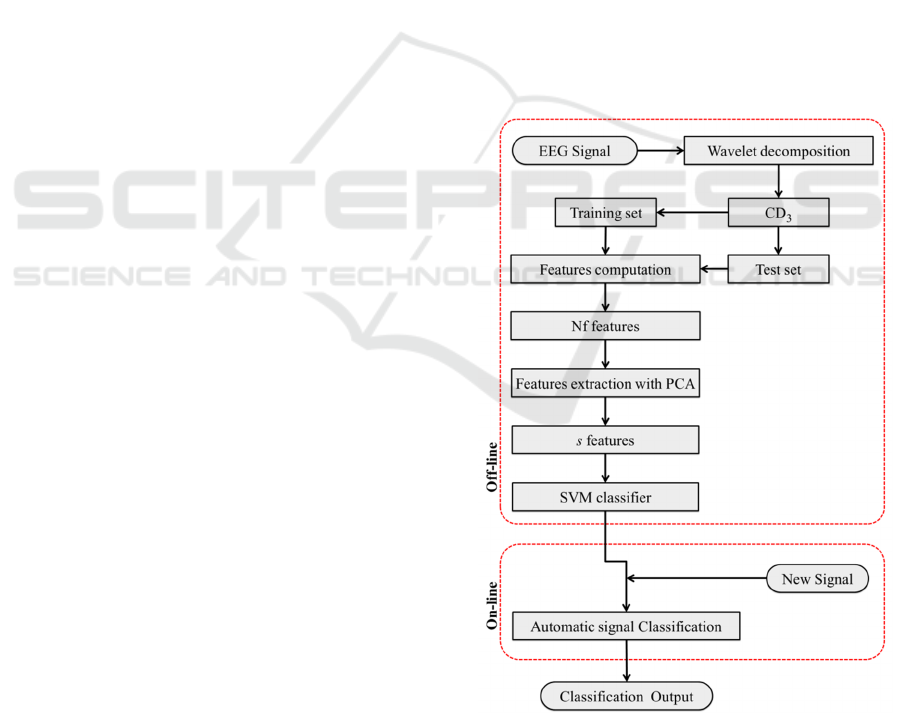
Figure 2: Block diagram of the classification procedure.
The SVM determined the optimal hyperplane to
separate data in two classes, Class 1 and Class 2, and
Classification of Emotional Signals from the DEAP dataset
17
it was obtained as a trade-off between the
requirement of maximizing the Euclidean distance
between the closest points and the requirement of
minimizing the error on misclassified points. The
classification method is summarized in the block
scheme of Figure 2.
The off-line step was the calibration: the most
predominant features referring to the two different
conditions, namely, to an activation stage (class #1)
or to another (class #2), were selected by conside-
ring that the class of the given signal was known in
advance; then the SVM classifier was trained. The
on-line step was the classification of a signal of
which the placement to the class #1 or #2 was
unknown in advance. More details can be found in
(Iacoviello et al., 2015c).
3 RESULT AND DISCUSSION
As specified above, the proposed classification
procedure was applied to a set of 32 trials for the E1
(NVHA) emotion, 32 for the E2 (HVHA) emotion
and 32 trials for the relaxing state R for each subject
(in the DEAP database, they corresponded to the
subjects #1, 2, 22, 24, 25, and 9 indicated by S
1
– S
6
,
respectively, in this study) in a single test. The
extracted signals were analyzed in order to verify the
absence of abnormal spikes. In particular, the subject
#9 (S
6
) was discarded since his EEG signals
contained very high spikes of difficult explanation
and reduction; a more sophisticated method to
discard a subject was proposed in (Petrantonakis and
Hadjileontiadis, 2011). For each of the selected
subjects, the same emotion was associated to at least
two videos. The corresponding signals were inserted
in the same set of trials (in the same class). Of the
whole set of trials, 16 were leaved for calibration of
the methods (in particular, 8 trials were used for
training and 8 for validation) and 48 were used to
simulate real-time classification.
Parameters for the classification method: Each
trial was divided into q=7 sub-trials, each
corresponding to 300 elements, by considering p=50
overlapping points. The number of retained sub-
trials was 5.
The SVM was applied on a subset of features
extracted by PCA on the basis of the averaged
values of the features calculated on the selected 5
sub-trials. The considered emotions were clearly
recognizable (classification accuracy close to 100%)
from the relaxing condition, for most of the
considered subjects, both from the left and from the
right hemisphere of the brain. This occurred also
when considering the classification of the two
emotions reciprocally. However, by considering just
the channels whose accuracy was exactly 100%, it
may be noted that the right hemisphere was
prevalent. Moreover, the channel PO4 recurred in all
the subjects and was useful both to classify the two
emotions from “relax” and the two emotions
reciprocally. This was particularly evident for the
subject S
3
that represented the worst case, among the
considered subjects, in terms of accuracy
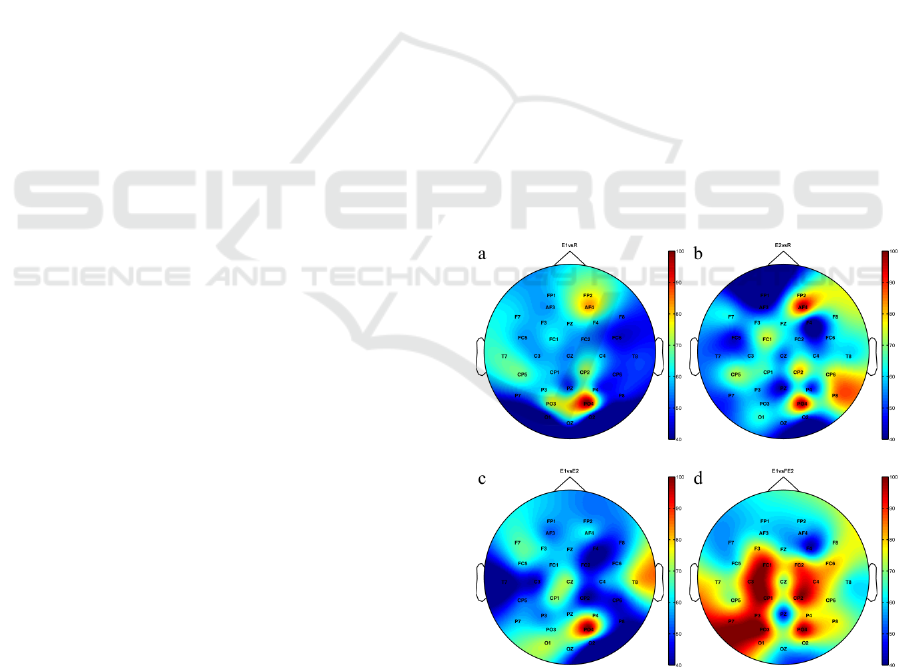
distribution between channels (Figure 3).
Also in this worst case, the two emotions
activated mostly the right hemisphere, and the
channel PO4 was the most important (100% of
accuracy) both to recognize the considered emotions
from “relax” and to recognize the emotions each
other, though with different feature sets. In this case,
also the channel AF4 (80% in accuracy) was useful
to recognize both the emotions with respect to relax,
though it was not specific to recognize one emotion
with respect to the other. These results confirmed
what was previously found in (Placidi et al., 2015a)
and (Placidi et al., 2015b) with respect to the
activation of the right hemisphere for a negative
emotion but, differently from other works (Song et
al., 2010; Davidson et al., 1979), the brain
lateralization between the two types of emotions was
not clearly evident.
Figure 3: Accuracy values for each channel for the subject
S3 (our worst case). The reported maps are referred to
binary classifications between: negative emotion vs relax
(a), positive emotion vs relax (b), negative vs positive (c),
and negative vs flipped positive (left-right brain
hemispheres) (d), respectively.
NEUROTECHNIX 2016 - 4th International Congress on Neurotechnology, Electronics and Informatics
18

For better clarifying this aspect, we also tried to
classify the signals of the first emotion with those of
the second one having flipped the two brain
hemispheres of the second emotion. In this case, we
observed that most of the channels were
recognizable to one another (accuracy close to
100%), thus demonstrating that a correlation
between channels of opposite hemispheres were
absent. In particular, Figure 3d shows the good
symmetry of the accuracy distribution for the subject
S
3
, confirming the absence of a relationship between
channels of opposite hemispheres. The activation of
a considerable number of channels could be due to
the elicitation protocol: being an external
stimulation, it would activate multiple mental
processes corresponding to the activation of
different brain regions. Conversely, in the case of
self-induced emotions (Placidi et al., 2015), the
activation, being generated by a concentration task
that reduces the possibility of distraction, was
concentrated in a specific brain location.
It is useful to evaluate the importance of the
features after the PCA selection. Table I shows the
channels in which the accuracy was above 80% and
the corresponding 4 most important features used for
classification, reported in order of descending
importance.
The most activated channels were those with
higher accuracy, expressed as the ratio between the
number of right answers with respect to the total
number of trials in percentage. It is important to note
that, due to the protocol used to collect the data of
the DEAP database (audio-videos were used to elicit
emotions), both temporal (influenced by listening
audios) and occipital (influenced by viewing videos)
channels were left out. Moreover, just accuracy
above 80% was considered.
From the analysis of Table I it can be further
observed that, even between the 4 most influent
features used for classification in different channels
there was a sort of recurrence: features 5, 7, 9 and 10
occurred very often, though with different order.
The previous results demonstrated that the
proposed method could be effectively used for
finding the proper, optimized and minimal
combination of channels/features for effective
classification of the 3 considered emotional states.
The choice of leaving separated the EEG channels in
the classification process was finalized at the
evaluation of the contribution of each channel to the
whole classification process. The obtained results
demonstrated also that the method could be applied
for effective classification of the 3 considered
emotional states by using a polling system after the
application of 3 mutual binary classification
methods.
Table 1: Best channels (accuracy above 80%) and the
corresponding 4 best features used for classification.
Temporal and occipital channels were not considered.
E1vsR E2vsR E1vsE2
Ch Features Ch Features Ch Features
S
1
AF35910 7 AF395 10 7 CP1 8 6 3 1
F3 5 9 10 2 F3 5 9 10 2 F4 9 5 1 3
C3 5 9 7 10 C3 9 5 7 10 C4 5 9 3 1
CP1 9 5 10 7 CP1 8 9 2 10 PO4 9 5 10 8
F4 5910 7 F4 45 10 3
C4 9 5 7 10 C4 9 5 7 10
PO4 5 9 7 10 PO4 5 9 7 10
S
2
CP1 5 9 7 1 FC1 5 9 10 7 FC1 9 5 3 1
FC1 9 5 3 1 CP2 5 9 10 7 C3 5 9 10 1
C3 9 5 10 7 F4 9 5 10 7 PO4 9 5 7 10
F3 5 9 7 10 PO4 9 5 7 10
CP6 9 5 7 10
C4 5 9 7 3
PO4 9 5 7 10
S
3
AF4 9 5 7 3 FC1 9 5 7 2 PO4 3 1 2 10
CP2 9 5 7 10 CP5 9 5 8 6
PO4 9 5 2 7 AF4 9 5 7 2
CP2 9 5 7 1
PO4 3 1 2 10
S
4
FC5 5 9 7 10 AF3 5 9 10 7 FC1 9 5 10 7
FC1 9 5 7 10 FC1 9 5 7 10 CP1 5 9 10 7
FC2 5 9 7 10 CP5 4 5 10 7 PO3 9 5 10 7
P4 5 9 7 10 CP6 5 9 2 10 CZ 9 5 3 1
PO4 5 9 7 4 PO4 9 5 7 4 FC6 6 8 10 7
C4 5 9 1 3
PO4 5 9 10 7
S
5
AF39510 7 AF395 10 7 F3 9 5 7 3
F3 5 9 7 10 C3 9 5 7 10 FC5 9 5 7 10
AF4 5 9 3 1 CP1 5 9 10 7 CP1 5 9 10 7
C4 5 9 10 7 AF4 5 9 7 10 FC6 9 5 10 7
PO45910 7 F4 95 10 7 C4 5 9 7 10
CP2 5 9 10 7 PO4 5 9 10 7
PO4 5 9 10 7
The choice of considering simple binary
classifications instead of more articulated multi-class
strategies (ternary in our case) was twofold: first,
binary classification was really simple and its results
could be more reliable than those of a multi-class
strategy (in that phase, we were still trying to
comprehend the neurophysiologic complex mecha-
nisms and the brain/features mapping of different
emotions and we would avoid biases from the
classification strategy); second, the extension of the
proposed method to the classification of more than 3
classes could be very simple (the addition of a class
simply involves the addition of a series of binary
classifiers). Finally, the results showed that the
proposed method could be easily applied for
Classification of Emotional Signals from the DEAP dataset
19

classification of emotions that have similar spatial
activation pattern because they could be recognized
through their specific features combination.
Regarding the computational time, the algorithm
was implemented in Matlab® on a personal
computer (Intel(R) Core(TM) i7-4790 CPU @3.60
GHz 3.60 GHz RAM: 16,0 GB): the classification
method took 17.2 minutes for processing all the
trials used for the calibration step, 36.4 minutes for
the training, 35 sec for the validation and 2.2x10-
3
sec for processing a single trial. Time could be
strongly reduced by using just a single channel for
classification (PO4).
4 CONCLUSION AND FUTURE
DEVELOPMENTS
A comparison of EEG emotional signals from differ-
rent subjects of the DEAP database was performed
by using a competitive machine learning based
classification method. The compared emotions were
NVHA and HVHA both with the relaxing state and
reciprocally.
The obtained results showed that, though
defining different feature sets for different channels,
most of the measured channels allowed high
classification accuracy. This was true both by
comparing each emotion with “relax” and by
comparing the two emotions. In order to highlight if
there was a lateralization between the brain
hemispheres when subjected to opposite emotions,
we also compared the data of the first emotion with
those of the second after the flipping of the right
hemisphere data with those of the left hemisphere of
the second emotion. The results showed that, being
the classification accuracy very high for most of the
channels, the activation was not differently
distributed between hemispheres for different
emotions. The obtained results demonstrated that the
proposed classification method could be efficiently
applied both to discover the neurophysiological
mechanisms of different emotional states and to
efficiently recognize the minimal channels/features
set for recognizing each of the considered emotions
from the others and from the relaxing state.
Moreover, the method could be efficiently used for
classification of an incremental number of emotions
through the further introduction of a set of binary
classifiers and a proper polling scheme.
Future work will be spent in
1) refining the strategy of subjects selection
(Petrantonakis and Hadjileontiadis, 2011),
2) mapping the channels/features pattern of
new emotional states,
3) inserting the previous emotional states in
the classification process,
4) classifying the considered emotional states
in groups (more than two emotions at once)
5) exploring a deeper wavelet prefiltering,
assuming the decomposition that better
enhance the significant part of the elicited
signal,
6) selecting the most informative subset of
channels,
7) selecting a strategy of self-induction of a
set of emotions in order to allow also the
usage of the neglected channels,
applying the obtained channels-features maps to
implement a classification strategy for multi-
emotions based BCIs to be used for communication
purposes or for affective computing applications.
ACKNOWLEDGEMENTS
The authors wish to thank Mrs Carmelita Marinelli
for her help in preparing the figures.
REFERENCES
Shih, J., Krusienski, D. and Wolpaw, J., 2012. Brain-
Computer Interfaces in Medicine. Mayo Clinic
Proceedings, 87(3), pp.268-279.
Kubler, A., Nijboer, F., Mellinger, J., Vaughan, T.,
Pawelzik, H., Schalk, G., McFarland, D., Birbaumer,
N. and Wolpaw, J., 2005. Patients with ALS can use
sensorimotor rhythms to operate a brain-computer
interface. Neurology, 64(10), pp.1775-1777.
Hochberg, L., Serruya, M., Friehs, G., Mukand, J., Saleh,
M., Caplan, A., Branner, A., Chen, D., Penn, R. and
Donoghue, J., 2006. Neuronal ensemble control of
prosthetic devices by a human with tetraplegia.
Nature, 442(7099), pp.164-171.
Fisch, B. and Spehlmann, R., 1999. Fisch and
Spehlmann's EEG primer. Amsterdam: Elsevier.
Babiloni, F., Cincotti, F., Lazzarini, L., Millan, J.,
Mourino, J., Varsta, M., Heikkonen, J., Bianchi, L.
and Marciani, M., 2000. Linear classification of low-
resolution EEG patterns produced by imagined hand
movements. IEEE Transactions on Rehabilitation
Engineering, 8(2), pp.186-188.
Placidi, G., Avola, D., Petracca, A., Sgallari, F. and
Spezialetti, M., 2015a. Basis for the implementation of
an EEG-based single-trial binary brain computer
interface through the disgust produced by
remembering unpleasant odors. Neurocomputing, 160,
pp.308-318.
NEUROTECHNIX 2016 - 4th International Congress on Neurotechnology, Electronics and Informatics
20

Pistoia, F., Carolei, A., Iacoviello, D., Petracca, A., Sacco,
S., Sarà, M., Spezialetti, M. and Placidi, G., 2015.
EEG-detected olfactory imagery to reveal covert
consciousness in minimally conscious state. Brain
Injury, 29(13-14), pp.1729-1735.
Placidi, G., Petracca, A., Spezialetti, M. and Iacoviello,
D., 2015b. Classification strategies for a single-trial
binary Brain Computer Interface based on
remembering unpleasant odors. 2015 37th Annual
International Conference of the IEEE Engineering in
Medicine and Biology Society (EMBC).
Iacoviello, D., Petracca, A., Spezialetti, M. and Placidi,
G., 2015a. A real-time classification algorithm for
EEG-based BCI driven by self-induced emotions.
Computer Methods and Programs in Biomedicine,
122(3), pp.293-303.
Iacoviello, D., Pagnani, N., Petracca, A., Spezialetti, M.
and Placidi, G., 2015b. A Poll Oriented Classifier for
Affective Brain Computer Interfaces. Proceedings of
the 3rd International Congress on Neurotechnology,
Electronics and Informatics.
Iacoviello, D., Petracca, A., Spezialetti, M. and Placidi,
G., 2015c. A Classification Algorithm for
Electroencephalography Signals by Self-Induced
Emotional Stimuli. IEEE Trans. Cybern., pp.1-10.
Placidi, G., Petracca, A., Spezialetti, M. and Iacoviello,
D., 2015c. A Modular Framework for EEG Web
Based Binary Brain Computer Interfaces to Recover
Communication Abilities in Impaired People.J Med
Syst, 40(1).
Guler, I. and Ubeyli, E., 2007. Multiclass Support Vector
Machines for EEG-Signals Classification.IEEE
Transactions on Information Technology in
Biomedicine, 11(2), pp.117-126.
Koelstra, S., Muhl, C., Soleymani, M., Jong-Seok Lee,
Yazdani, A., Ebrahimi, T., Pun, T., Nijholt, A. and
Patras, I., 2012. DEAP: A Database for Emotion
Analysis; Using Physiological Signals. IEEE Trans.
Affective Comput., 3(1), pp.18-31.
Russell, J., 1980. A circumplex model of affect. Journal of
Personality and Social Psychology, 39(6), pp.1161-
1178.
Daubechies, I., 1992. Ten lectures on wavelets.
Philadelphia, Pa.: Society for Industrial and Applied
Mathematics.
Mamun, M., Al-Kadi, M. and Marufuzzaman, M., 2013.
Effectiveness of Wavelet Denoising on
Electroencephalogram Signals. Journal of Applied
Research and Technology, 11(1), pp.156-160.
Subasi, A., 2007. EEG signal classification using wavelet
feature extraction and a mixture of expert model.
Expert Systems with Applications, 32(4), pp.1084-
1093.
Cvetkovic, D., Übeyli, E. and Cosic, I., 2008. Wavelet
transform feature extraction from human PPG, ECG,
and EEG signal responses to ELF PEMF exposures: A
pilot study. Digital Signal Processing, 18(5), pp.861-
874.
Song, F., Guo, Z. and Mei, D., 2010. Feature Selection
Using Principal Component Analysis. 2010
International Conference on System Science,
Engineering Design and Manufacturing
Informatization.
Petrantonakis, P. and Hadjileontiadis, L., 2011. A Novel
Emotion Elicitation Index Using Frontal Brain
Asymmetry for Enhanced EEG-Based Emotion
Recognition. IEEE Transactions on Information
Technology in Biomedicine, 15(5), pp.737-746.
Davidson, R., Schwartz, G., Saron, C., Bennett, J. and
Goleman, D., 1979. Frontal versus parietal EEG
asymmetry during positive and negative affect.
Psychophysiology, 16(2), pp.202-203.
Classification of Emotional Signals from the DEAP dataset
21
