
Sentiment Analysis of Breast Cancer Screening in the
United States using Twitter
Kai O. Wong
1
, Faith G. Davis
1
, Osmar R. Zaïane
2
and Yutaka Yasui
1,3
1
School of Public Health, University of Alberta, Alberta, Canada
2
Department of Computing Science, University of Alberta, Alberta, Canada
3
St. Jude Children’s Research Hospital, Memphis, U.S.A.
Keywords: Cancer Screening, Social Media, Data Visualization, Sentiment Analysis, Spatial Analysis, Twitter.
Abstract: Whether or not U.S. women follow the recommended breast cancer screening guidelines is related to the
perceived benefits and harms of the procedure. Twitter is a rich source of subjective information containing
individuals’ sentiment towards public health interventions/technologies. Using our modified version of Hutto
and Gilbert (2014) sentiment classifier, we described the temporal, geospatial, and thematic patterns of public
sentiment towards breast cancer screening with 8 months of tweets (n=64,524) in the U.S. To examine how
sentiment was related to screening uptake behaviour, we investigated and identified significant associations
between breast cancer screening sentiment (via Twitter) and breast cancer screening uptake (via BRFSS) at
the state level.
1 INTRODUCTION
Breast cancer is the most prevalent cancer among
women in the United States (U.S.) (American Cancer
Society, 2015). Regular breast cancer screening is
important in detecting early stages of breast tumors.
Screening mammogram, clinical breast exam (CBE)
performed by health professionals, breast self-exam,
and breast magnetic resonance imaging (MRI) are
examples of breast cancer screening tests. A
systematic review concluded that among women with
average risk (i.e., no personal or family history of
breast tumor/lesion, or genetic mutations such as
those in BRCA1 and BRCA2 genes), mammogram
screening was associated with 20% reduction in
breast cancer mortality (Myers et al., 2015). The
American College of Obstetricians and
Gynecologists (2011) guidelines recommended U.S.
women aged 40-74 with average risk to attend a
screening mammogram and CBE annually, while the
U.S. Preventive Services Task Force (2016) added
that the net benefits of breast cancer screening for
women aged 40 to 49 is less conclusive than that for
women aged 50 to 74 (Centers for Disease Control
and Prevention, 2016b). Women aged 75 and above
with average risk should consult with physician to
decide whether or not to continue receiving a
mammogram.
Not all U.S. women adhere to the recommended
breast cancer screening guidelines. The uptake of
breast cancer screening vary across residence location
(Mai et al., 2009), social class (Borugian et al., 2011),
and ethnicity (Mahamoud, 2014). Whether or not to
seek breast cancer screening often depended on one’s
perception regarding the quality of care, competency
of health professionals, discomfort level during the
procedure, and length of time waiting for the
procedure and test results (Cruz-Castillo et al., 2014).
Women not attending regular breast cancer screening
listed their main reasons as being busy, unaware of
breast cancer risk, fearful of receiving a true cancer
diagnosis or a false diagnosis, and deterred by the
pain and discomfort from the procedure
(HealthTalkOnline, 2013). Many of these reasons can
be explained by the health belief model (HBM) (Janz
and Becker, 1984) which states that individuals’
readiness and commitment to adopt or continue a
healthy behaviour are built on four perception-based
constructs: perceptions of susceptibility, severity,
benefits, and barriers. Individuals’ subjective
perception about breast cancer screening, including
influence of face-to-face physician recommendation
and perceived effectiveness and safety of breast
cancer screening (Fulton et al., 1991, Wang et al.,
2014, Austin et al., 2002), plays a crucial role in
determining if a woman would participate in the
procedure. Yet real-time and unfiltered perception
data on medical procedures are often unavailable in
Wong, K., Davis, F., Zaïane, O. and Yasui, Y.
Sentiment Analysis of Breast Cancer Screening in the United States using Twitter.
DOI: 10.5220/0006047102650274
In Proceedings of the 8th International Joint Conference on Knowledge Discovery, Knowledge Engineering and Knowledge Management (IC3K 2016) - Volume 1: KDIR, pages 265-274
ISBN: 978-989-758-203-5
Copyright
c
2016 by SCITEPRESS – Science and Technology Publications, Lda. All rights reserved
265

public health surveillance, administrative, and other
health-related databases (Bryson et al., 2016).
Twitter is a rich data source of perception data.
Twitter is used by hundreds of millions of active
users, continuously broadcasting their uncensored
opinions, experiences, thoughts, and feelings in a
form of a tweet, a short text message of 140 characters
or less (PewResearchCenter, 2015, Zhao and Rosson,
2009). A considerable portion of tweets is health-
related (Dredze, 2012, Paul and Dredze, 2011) and
has contributed to various health monitoring
applications such as public awareness of influenza
(Smith et al., 2015), worldwide influenza incidence
(Paul et al., 2015), self-reported mental illnesses
(Coppersmith et al., 2015), medical complaints
(Nakhasi et al., 2012), and safety monitoring for
hospital patients (Passarella et al., 2012). As for
cancer communities, Twitter serves as a popular
digital platform to bring together different groups of
key stakeholders. Medical professionals use Twitter
to disseminate scientific findings and connect with
patients (Vance et al., 2009). Cancer patients use it to
share experience, gain support, and educate one
another (Lapointe et al., 2014, Sugawara et al., 2012).
The general public uses it to advocate and raise
funding (Thackeray et al., 2013). Currently, no study
was found to examine Twitter’s potential in gauging
public perception on preventive public health
interventions such as breast cancer screening.
Sentiment analysis is a sub-domain of natural
language processing that extracts subjective
information from a text and assigns a sentiment score
or a sentiment polarity classification (i.e., neutral,
positive, and negative) (Pang and Lee, 2008).
Sentiment analysis helps determine the attitude or
perception of a writer with respect to a specific topic
in a systematic and quantifiable manner. We propose
a sentiment analysis that not only demonstrates the
visualization of sentiment patterns using breast
cancer screening tweets in the U.S. (descriptive
analysis), but also explores the relationship between
breast cancer screening sentiment from Twitter and
actual breast cancer screening uptake behaviour
derived from an external data source from the U.S.
government (hypothesis-based analysis).
2 METHODS
2.1 Tweet Processing
Twitter allowed public access to 1% random subset
of tweets via Twitter REST Application
Programming Interface (API) (Kumar et al., 2013).
Via Twitter API, tweets related to breast cancer
screening published from 17
th
September 2014 to 10
th
May 2015 were collected using the following filtering
terms:
"mammogram", "mammography", "breast imaging",
"breast screening", “breast mri”, “breast
ultrasound”, "breast self-exam", "breast
examination", "breast exam", and their
corresponding hashtags (i.e., “#breastimaging” and
“#breastexam”)
Extracted information from each breast cancer
screening tweet included user name, time of tweet,
published tweet content, and two types of geographic
information including user-described location and
user-enabled global positioning system (GPS)
location in longitude and latitude (Twitter, 2014).
The content of each tweet was processed by
removing any retweet tag (“RT”), hashtag symbol
(“#”), user-mention tag (“@”), and Uniform Resource
Location (URL) links. Not all Twitter users have
described location information or enabled the GPS
option. If both location inputs were available, the
more precise GPS location was used; otherwise the
user-described location was used. When available,
the user-described location was converted into GPS
coordinates using Python module Geocoder (by
accessing MapQuest) (MapQuest, 2014). The
location information was then standardized by
reverse-geocoding the coordinates into corresponding
country, state, county, and city.
2.2 VADER Sentiment Classifier
There are a number of existing automated sentiment
classifiers (Hutto and Gilbert, 2014), such as
Linguistic Inquiry and Word Count (LIWC), General
Inquirer (GI), Affective Norms for English Words
(ANEW), SentiWordNet (SWN), SenticNet (SCN),
Word-Sense Disambiguation (WSD), and Hu-Liu-
2004. However, these sentiment classifiers were not
developed specifically for microblogging platforms
such as Twitter. Tweets generally employed unique
communication patterns (i.e., hashtag, user-mention,
all-capitalization, acronyms, emoticons, slangs, and
repeated punctuations) to better express emotions and
fit into the microblogging culture. Hutto and Gilbert
(2014) developed and made publically available a
sentiment classifier, called Valence Aware
Dictionary for sEntiment Reasoning (VADER)
classifier, specifically tailored to microblogging
platforms such as Twitter. The sentiment lexicon of
VADER classifier was based on well-established and
human-validated sentiment lexicons (i.e., from
KDIR 2016 - 8th International Conference on Knowledge Discovery and Information Retrieval
266

LIWC, GI, and ANEW) and extended by adding
common microblogging vernaculars (i.e., acronyms,
slangs, and emoticons). In addition, grammatical and
syntactical aspects of text (i.e., use of repeated
punctuation such as “!!!!” and all-cap such as
“EXTREMELY GOOD day”) were incorporated by
systematically adjusting the baseline sentiment value
using a rule-based model (Hutto and Gilbert, 2014).
To classify the sentiment of a text, the VADER
classifier examines the sentiment polarity and
intensity of each word of the text against its lexicon,
and then outputs four VADER sentiment scores:
neutral, positive, negative, and composite scores. The
neutral, positive, and negative scores correspond to
the proportion of text containing a particular
sentiment polarity. For example, a 1.0 positive
sentiment score indicates that every word in a text
contains positive sentiment while 0.0 positive score
indicates there is no positive word, and likewise for
neutral and negative sentiment scores. The composite
score is computed by summing the sentiment
intensity score of each word from the text that has a
match with the VADER lexicon, adjusted with
grammatical and syntactical rules, and then
normalized to be between -1 (most negative) and +1
(most positive). The composite score can be used as a
single uni-dimensional measure of sentiment. Hutto
and Gilbert (2014) concluded the VADER classifier
considerably outperformed all seven established
sentiment classifiers (i.e., LIWC, GI, and ANEW).
The VADER classifier achieved a 0.99 precision,
0.94 recall, and 0.96 F1 score, which were
comparable to human accuracy.
2.3 Modifications of VADER
Although VADER was validated on general tweets by
Hutto and Gilbert (2014), its performance to classify
sentiment of tweets related to public health
intervention, specifically breast cancer screening,
required further validation. Such validation was
conducted in our study by drawing a random subset
of 250 tweets from the original breast cancer
screening tweets pool. The composite score was
categorized into neutral (-0.3 to +0.3), positive (>
+0.3 to +1.0), and negative (-1.0 to < -0.3). The
sentiment polarity (neutral, positive, and negative) of
each of the 250 tweets was determined by a blind-
rater K.W. as the gold standard. A poor accuracy
(<40.0%) was observed from the VADER
classification initially and the primary reason was
identified.
In the original VADER lexical dictionary, the
lexicon “cancer” contained a highly negative
sentiment value (-3.4). This resulted in VADER
universally assigned highly negative composite
sentiment score to virtually all tweets since they were
related to breast cancer by default. Similarly, other
words including “die”, “died”, and “death”
containing highly negative default sentiment values
(i.e., -2.9, -2.6, and -2.9, respectively) were identified,
yet these lexicons often appeared in our collected
tweets as part of the conversations on breast cancer
statistics without any default positive or negative
connotation. The effect on sentiment classification
accuracy was examined by removing these four
lexicons from the original lexical dictionary, resulting
in more favourable accuracy (77.2%). The remaining
classification discrepancy between VADER and the
human rater was derived from more advanced
sentiment classification challenges such as sarcasm,
sentiment ambiguity, and mixed sentiments that were
difficult for even human raters, and thus unlikely to
be addressed by further minor modifications in the
VADER classifier. The aforementioned modified
version of the VADER classifier was used to compute
sentiment scores of breast cancer screening tweets.
2.4 Descriptive Sentiment Analysis
Temporal, geospatial, and thematic patterns of
sentiment from breast cancer screening tweets were
examined as descriptive sentiment analyses. For
temporal patterns, the daily volume of breast cancer
screening tweets and daily average of composite
sentiment scores were plotted in a line graph.
For geospatial patterns, tweets with available
geographic information were used to generate
cartographic and hot-spot maps based on composite
sentiment scores. Hot-spot analysis identifies spatial
clusters with significantly high or low sentiment
values, using the Getis-Ord Gi* statistics (ArcGIS,
2015):
where,
Gi* statistics is calculated at each location point i that
has a feature (sentiment) value. The x
j
is the sentiment
value for feature j, w
i,j
is the spatial weight between
features i and j, and n is the total number of features.
Inverse square distance is used such that closer
features are weighted more heavily than features that
Sentiment Analysis of Breast Cancer Screening in the United States using Twitter
267

are further away. That is, w
i,j
is equal to M/(d
ij
2
),
where M is a constant and d
ij
is the distance between
features i and j. Conceptually, Gi* statistics compares
the sum of feature values within a neighbouring
region around location i against the expected sum of
feature values derived from global average
(numerator), and then standardized with the variance
(denominator). The Gi* statistics returns a z-score for
each location i. Significant hot-spots contain highly
positive z-score value and small p-value, indicating
location i is surrounded by high sentiment value
neighbours, while significant cold-spots contain
highly negative z-score and small p-value, indicating
location i is surrounded by low sentiment value
neighbours.
For thematic patterns, an example word-cloud
was generated which consisted the most frequent
words amongst all and only negative tweets
(excluding positive and neutral tweets). A
comprehensive list of common but non-informative
words such as “the”, “it”, and “what” were omitted
from the word-cloud creation. The font size of each
word shown in a word-cloud corresponded to the
frequency of that word (i.e., the larger the word, the
more frequently it appears). Example themes were
extracted qualitatively as a demonstration.
2.5 Hypothesis-based Sentiment
Analysis
To evaluate possible association between breast
cancer screening sentiment and actual breast cancer
screening uptake at an ecological level, a hypothesis-
based sentiment analysis was conducted. While
information on breast cancer screening sentiment was
provided by Twitter, information on breast cancer
screening uptake was obtained from a separate dataset
collected by the Centers for Disease Control and
Prevention (CDC) called the Behavioral Risk Factor
Surveillance System (BRFSS) survey (Centers for
Disease Control and Prevention, 2016a). The BRFSS
is one of the largest recurring national health surveys
that collects data via phone interviews on U.S.
residents regarding health-related risk behaviours,
chronic health conditions, and use of preventive
services. During the study period, the latest available
BRFSS survey was the BRFSS 2014 (calendar year).
From the BRFSS 2014, interested individual-level
variables were extracted and recoded as 1)
mammogram received within the last two years
(Mamm, 1 – yes and 0 – no), 2) CBE received within
the last two years (CBE, 1 – yes and 0 – no), 3)
highest education achieved (Edu, 1 – have at least
some college education, 0 – do not have any college
education), 4) general health (GenHlth, 1 – good, very
good, or excellent, 0 – fair or poor), and 5) race (Race,
1 – non-Hispanic white only, 0 – all others). Women
aged less than 40 years old, women with missing key
variables (i.e., mammogram and CBE), and men were
removed from the analysis. Explanatory and outcome
variables were aggregated by states, where individual
sentiment values were grouped as averages by state
(i.e.,
,
,
, and
), and
individual BRFSS variable values were aggregated as
percentage of “1” for each state (i.e., %Mamm as
percent women reported having a mammogram
within two years, and likewise for %CBE, %Edu,
%GenHlth, and %Race). We hypothesized that U.S.
states with more positive sentiment score values
towards breast cancer screening (via tweets) are more
likely to have higher overall uptake of breast cancer
screening (via BRFSS). This hypothesis was
examined qualitatively and quantitatively.
Qualitatively, the cartographic maps of state-level
breast cancer screening sentiment and breast cancer
screening uptake patterns were compared.
Quantitatively, since the values of the dependent
variables (%Mamm and %CBE) fall between 0 and 1,
beta regression model was used to statistically test the
relationship between sentiment scores and
mammogram/CBE uptake. States with less than 100
tweet count (including Hawaii, Vermont, and
Montana) were excluded from the analysis.
In multivariable beta regression, the outcome
variable was either %Mamm or %CBE, and the
explanatory variable of interest was one of the four
average VADER sentiment scores (i.e.,
,
,
, and
) plus other
covariates including %Edu, %GenHlth, and %Race to
adjust for potential confounding. Beta regression
assumes y
k
(i.e., %Mamm or %CBE), for k=1,2,…,
n
state
(number of individual U.S. states), to be
distributed in a beta distribution whose probability
density function is given as:
where Γ is the gamma function, and 0<y<1, 0<u<1,
and z>1. The u is the mean and z is the precision
parameter. The systematic component of beta
regression is:
where E(y
k
)=u
k
is the expected value of y
k
, or mean
u
k
, in each state. It is linearly linked to the explanatory
variables via the logit link function, g
1
(u)=log(u/(1-
u)). The random component of beta regression states
that y
k
is distributed in a beta distribution with its
KDIR 2016 - 8th International Conference on Knowledge Discovery and Information Retrieval
268
mean specified as above and z as a constant. The
estimation of β and z was done by maximum
likelihood estimation.
3 RESULTS
3.1 Descriptive Analysis
There were 3,544,328 breast cancer-related (both
breast cancer screening and non-breast cancer
screening) tweets collected in the data collection
period. A total of 61,524 tweets were found to be
specifically related to breast cancer screening in the
U.S., and 54,664 of these tweets contained specific
geographic information allowing for spatial analysis.
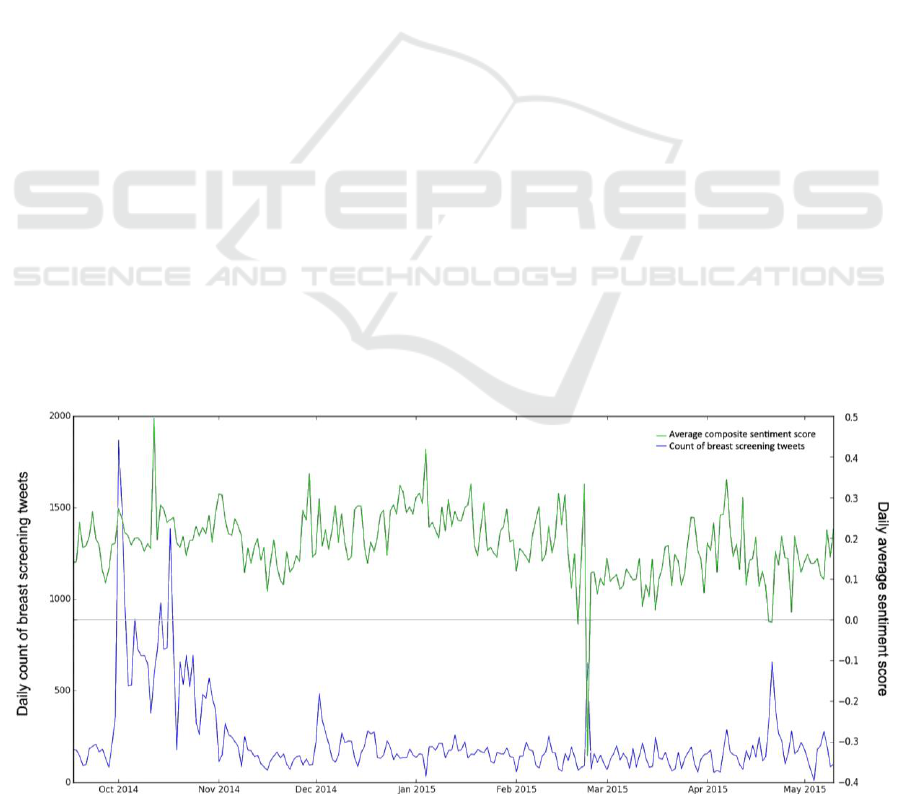
The baseline daily breast cancer screening tweet
volume fluctuated between 100 and 200, with an
explosive volume started in the beginning of October
(also Breast cancer awareness month) and then
gradually declined back to baseline (Fig 1). For the
remaining portions of this paper, “sentiment score”
refers to “composite sentiment score” unless
specified otherwise. There were 29,034 neutral (-0.3
≤ sentiment score ≤ 0.3), 21,561 positive (sentiment
score > 0.3), and 4,069 negative (sentiment score < -
0.3) tweets. The daily average sentiment score was
above the zero line during almost the entire period,
indicating that the overall sentiment towards breast
cancer screening was neutral-to-positive (Fig 1).
Figure 2 depicts the location and sentiment
polarity classification of each breast cancer screening
tweets. A larger volume of tweets was published in
the eastern states, which coincided with states with
higher population densities (MapOfUSA, 2007). The
states with the highest volumes of breast cancer
screening tweets were California, Texas, New Jersey,
Ohio, and Illinois in decreasing order (9,640 ≤ n
tweet
≤
2,639). The states with the lowest volumes of breast
cancer screening tweets were Vermont, Montana,
Hawaii, Wyoming, and South Dakota in increasing
order (71 ≤ n
tweet
≤ 145).
Figure 3 shows hot-spot analysis using individual
composite sentiment scores, regions in red (99%
confidence), orange (95% confidence), and light pink
(90% confidence) were statistically significant
clusters of low sentiment value, and they were named
the cold-spots. Regions in dark green (99%
confidence), medium green (95% confidence), and
light green (90% confidence) were significant
clusters of high sentiment values, and they were
named the hot-spots. While cold-spots appeared to be
occurring throughout the country with higher
concentration on the eastern side of the country, hot-
spots rarely appeared on the western side of the
country (with exceptions occurring in the south-
western coast of the country).
Three quintile maps as average sentiment score,
percent of recent mammogram, and percent of recent
CBE by states are shown in Figure 4. The top quintile
map ranked states by their average composite
sentiment score (with red being the lowest and green
being the highest) based on tweets, with three states
having less than 100 tweet counts removed. The
bottom left quintile map depicts the percent of women
aged 40 and above who had received a mammogram
within the last two years, and the bottom right quintile
map depicts the percent of women aged 40 and above
who had received a CBE within the last two years,
according to BRFSS 2014. Qualitatively, the bottom
Figure 1: Temporal trends of breast screening tweet volume and sentiment in the U.S. (n
tweet
=54,664).
Sentiment Analysis of Breast Cancer Screening in the United States using Twitter
269
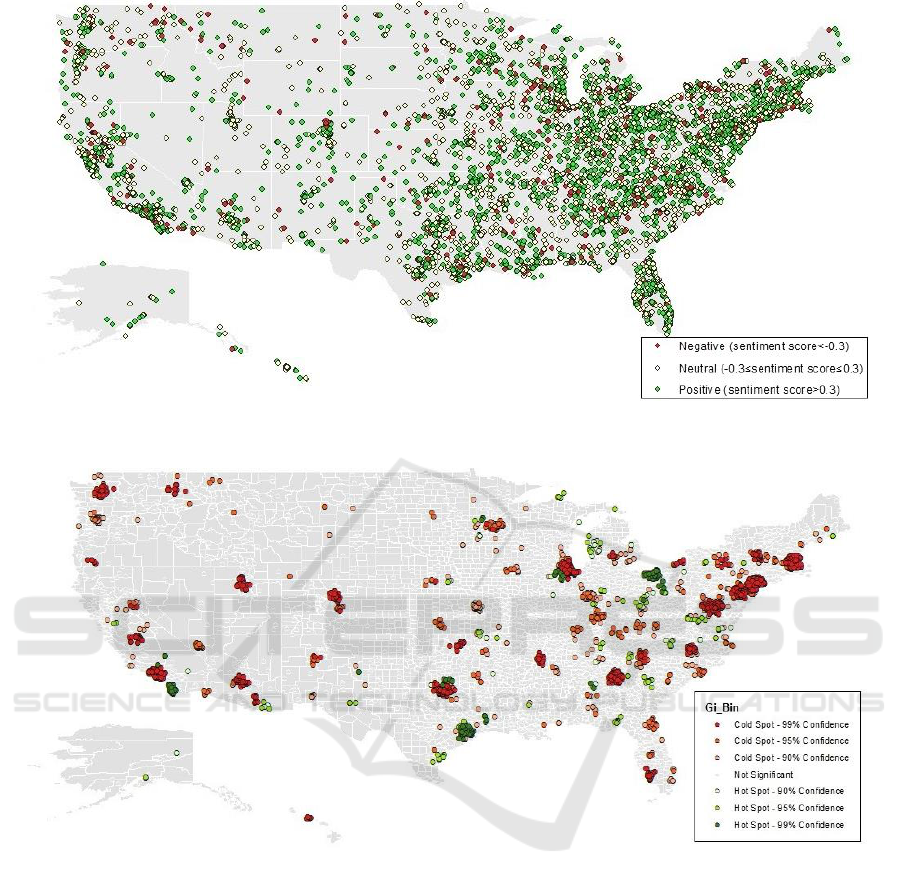
Figure 2: Sentiment of breast screening tweets in the U.S. (n
tweet
=54,664).
Figure 3: Hot Spot map based on sentiment score value in the U.S. (n
tweet
=54,664).
two maps show similar and strong horizontal
gradient, lowest to highest quintiles from west to east
across the country. While not as identical and
prominent compared to the bottom maps, the
sentiment-based quintile map does show an
increasing gradient from western to eastern part of the
country.
The word-cloud using only negative breast cancer
screening tweets is shown in Figure 5. Some of the
key words were circled manually and grouped
together thematically by a human inspector (K.W.)
subjectively. For example, “discomfort”, “scary”,
“hate”, “hurt”, “forced”, and “pain” together
suggested many people might feel negatively about
breast cancer screening due to the perceived or
experienced physical and psychological discomfort
with the procedure. On the other hand, “Obamacare”,
“coverage”, “excluded”, “cost”, “insurance”, and
“access” together might suggest many people with
negative sentiment about breast cancer screening
viewed inaccessibility and financial obstacles as
deterrence of obtaining a breast cancer screening.
3.2 Hypothesis-based Analysis
Ecological association between each of the four
average sentiment scores on breast cancer screening
and outcome variables (i.e., %Mamm and %CBE)
KDIR 2016 - 8th International Conference on Knowledge Discovery and Information Retrieval
270
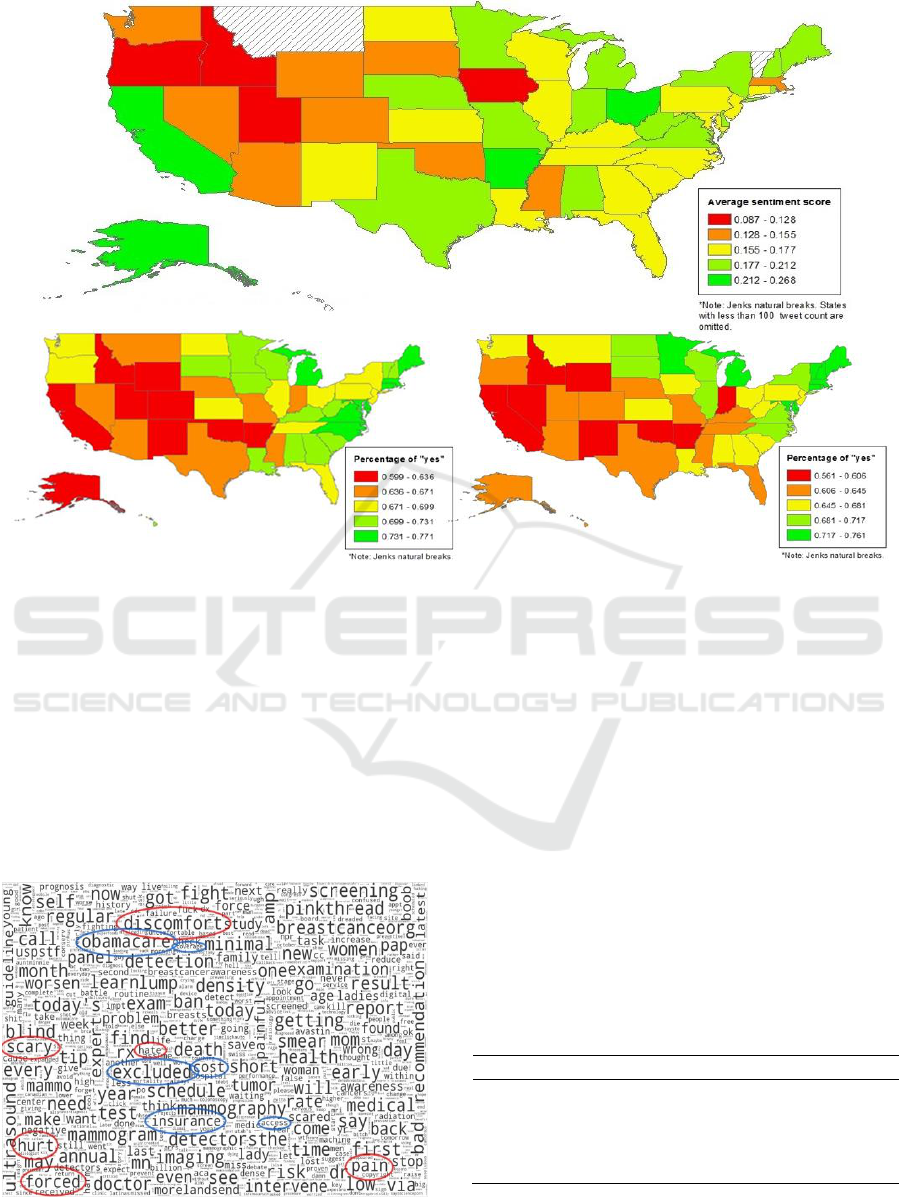
Figure 4: Quintile maps of average sentiment score of breast screening tweets (n
tweet
=54,416, top), percent women aged ≥40
years with recent mammogram (n
BRFSS
=217,503, bottom left), and percent women aged ≥40 years with recent CBE
(n
BRFSS
=217,503, bottom right).
were explored using multivariable beta regressions
(Table 1). States with less than 100 tweets were
removed, including Hawaii, Vermont, and Montana.
At the state level,
is the average composite
sentiment score,
is the average neutral
sentiment score,
is the average positive
sentiment score,
is the average negative
sentiment score, %Mamm is the percent women (≥40
years) received mammogram within two years,
Figure 5: Word-cloud using only negative breast cancer
screening tweets in the U.S. (n
tweet
=4,069).
and %CBE is the percent women (≥40 years) who
have received CBE within two years. Significant
positive association (p<0.05) was observed between
and recent CBE uptake, and significant
negative associations (p<0.05) were observed
between
and recent mammogram uptake and
recent CBE uptake. For example, 10% increase in
average negative sentiment score was associated with
0.57 and 0.75 decrease in log odds of recent-
mammogram-uptake being “yes” and recent-CBE-
uptake being “yes”, respectively, adjusted for
education, general health, and race.
Table 1: Regression coefficients from multivariable beta
regression examining average sentiment scores and
outcome variables of recent mammogram and CBE uptakes
by states (n
state
=48).
%Mamm
-0.01 (-1.89
to 1.78)*
2.69 (-0.17
to 5.56)
-2.46 (-
7.06 to
2.13)
-5.65 (-
10.84 to -
0.47)
%CBE
0.65 (-1.20
to 2.50)
3.27 (0.47
to 6.08)
-2.45 (-
7.00 to
2.10)
-7.53 (-
12.47 to -
2.58)
*β-coefficient (95% C.I.) adjusted for education, general health,
and race.
Sentiment Analysis of Breast Cancer Screening in the United States using Twitter
271

4 DISCUSSION
This study demonstrated how Twitter might serve as
a potentially useful tool in fulfilling public health
needs that require data on public perception. Twitter
provides a rich source of real-time, instantaneous, and
uncensored public perception data, which may be
utilized to monitor public sentiment towards health
interventions/technologies. The descriptive sentiment
analysis illustrated how Twitter depicts temporal,
geospatial, and thematic patterns of sentiment.
Temporally, the quantity and average sentiment
typically fluctuated within a baseline range, which
can help detect instances with abnormal level of tweet
volume and/or sentiment score value. Cartographic
and hot-spot maps visualized general geographical
trends and specific clusters based on sentiment
values, respectively. A vast number of negative
sentiments in a location towards breast cancer
screening might indicate an underlying public
misconception, unaddressed concerns, ineffective
health promotion, or lack of accessible infrastructure.
Thematically, qualitative interpretation of a word-
cloud revealed potentially important thematic
elements that might lead to better understanding of
the root causes of the observed sentiment in the whole
country or specific regions.
In the hypothesis-based sentiment analysis,
significant associations were found between some of
the average sentiment scores (via Twitter) and actual
mammogram and CBE uptake behaviours (via
BRFSS 2014) at the state level. Average negative
sentiment scores were negatively associated with
mammogram and CBE uptakes, as expected.
However, positive association was not observed
between average composite and positive sentiment
scores and breast cancer screening uptakes. This
might be due to several methodological and data-
limitation challenges: for example, data in Twitter
and BRFSS did not overlap over the exact time
period; subjects in these data sources did not
represent the same individuals (i.e., Twitter users
might not be representative to the target general
population); relationship existed at the ecological
(state) level could be different from those of the
individual level; uptake behaviours influenced by
factors other than sentiment could be at play; certain
states only had a small numbers of tweets; and
positive tweets published by commercial or non-
commercial organizations rather than individuals
might not link to individuals’ uptake patterns. Some
of these Twitter data limitations were also mentioned
by other studies including (Paul and Dredze, 2011),
(Mitra et al., 2016), and (Brooks, 2014). Nonetheless,
our finding suggested the existence of meaningful
associations that negative sentiment tweets on breast
cancer screening might be particularly useful in
identifying or predicting regions with lower breast
cancer screening uptake.
We suggest future studies to develop strategies to
minimize background noise such as tweets published
by organizations instead of individuals, and examine
more fine-grained categorization of sentiment that
also captures a person’s feelings and moods such as
anger, worry, disgust, fear, happiness, surprise, and
sadness (Pulman, 2014). Future studies may also
explore and validate a systematic approach to add
public health- and/or cancer-specific lexicons into the
existing VADER’s sentiment lexical dictionary to
further improve its context-specific utility in public
health and/or cancer research.
5 CONCLUSIONS
Based on the health belief model, one’s perception
about a health intervention/technology could
influence one’s ultimate action in adopting it. Twitter
sentiment data may fill an important gap by providing
health researchers and other stakeholders real-time
and unfiltered data essential to gauge public
perception on health interventions/technologies. The
knowledge of such public perception might help
predict subsequent utilization in the population. This
study not only demonstrated the use of Twitter to
visualize rich breast cancer screening sentiment
information, but also linked the sentiment derived
from Twitter to actual breast cancer screening uptake
patterns from BRFSS 2014. This suggests that
knowledge about public perception of health
intervention/technology might help predict future
public utilization, which holds important values in
public health policy development, community
planning, and resource allocation.
With better understanding and distillation of
useful tweets from the background noise, Twitter
could potentially be used as a uniquely important
public health surveillance tool to monitor public
perception. Spatial clusters with highly negative
sentiment should be monitored closely over time and
the reasons for their negative sentiment might be
extracted using thematic tools such as word-cloud.
Specific programs or policies can be tailored in
attempt to alleviate the specific negative sentiment,
which may subsequently improve public acceptance
and utilization of a target health intervention/
technology.
KDIR 2016 - 8th International Conference on Knowledge Discovery and Information Retrieval
272

REFERENCES
American Cancer Society. (2015). Cancer facts and figures
2015. Atlanta: American Cancer Society.
ArcGIS. (2015). How optimized hot spot analysis works.
Environmental Systems Research Institute, Inc. URL
http://desktop.arcgis.com/en/desktop/latest/tools/spati
al-statistics-toolbox/how-optimized-hot-spot-analysis-
works.htm.
Austin L., Ahmad F., McNally M., Stewart D. (2002).
Breast and cervical cancer screening in Hispanic
women: a literature review using the health belief
model. Women's Health Issues, 12, 122-128.
Borugian M., Spinelli J., Abanto Z., Xu C., Wilkins R.
(2011). Breast cancer incidence and neighbourhood
income. Health Reports. Statistics Canada.
Brooks B. (2014). Using Twitter data to identify geographic
clustering of anti-vaccination sentiments. Master of
Public Health, University of Washington.
Bryson E., Schafer E., Salizzoni E., Cosgrove A., Favaro
D., Dawson R. (2016). Is perception reality? Identifying
community health needs when perceptions of health do
not align with public health and clinical data. SM
Journal of Community Medicine, 2, 1013.
Centers for Disease Control and Prevention. (2016a).
Behavioral risk factor surveillance system. Atlanta,
GA: CDC. URL http://www.cdc.gov/brfss/.
Centers for Disease Control and Prevention. (2016b).
Breast cancer screening guidelines for women. Atlanta,
GA: Centers for Disease Control and Prevention. URL
http://www.cdc.gov/cancer/breast/pdf/BreastCancerSc
reeningGuidelines.pdf.
Coppersmith G., Dredze M., Harman C., Hollingshead K.
(2015). From ADHD to SAD: analyzing the language
of mental health on Twitter through self-reported
diagnoses. NAACL Workshop on Computational
Linguistics and Clinical Psychology.
Cruz-Castillo A., Hernández-Valero M., Hovick S.,
Campuzano-González M., Karam-Calderón M.,
Bustamante-Montes L. (2014). A study on the
knowledge, perception, and use of breast cancer
screening methods and quality of care among women
from central Mexico. Journal of Cancer Education.
Dredze M. (2012). How social media will change public
health. IEEE Intelligent Systems, 27, 81-84.
Fulton J., Buechner J., Scott H., DeBuono B., Feldman J.,
Smith R., Kovenock D. (1991). A study guided by the
health belief model of the predictors of breast cancer
screening of women ages 40 and older. Public Health
Reports, 106, 410-420.
HealthTalkOnline. (2013). Reasons for not attending breast
screening. URL http://www.healthtalk.org/peoples-
experiences/cancer/breast-screening/reasons-not-
attending-breast-screening.
Hutto C., Gilbert E. (2014). VADER: a parsimonious rule-
based model for sentiment analysis of social media text.
Association for the Advancement of Artificial
Intelligence.
Janz N., Becker M. (1984). The health belief model: a
decade later. Health Education Quarterly, 11, 1-47.
Kumar S., Morstatter F., Liu H. (2013). Twitter data
analytics, Springer.
Lapointe L., Ramaprasad J., Vedel I. (2014). Creating
health awareness: a social media enabled collaboration.
Health and Technology.
Mahamoud A. (2014). Breast cancer screening in racialized
women: implications for health equity. Advancing
Urban Health. Wellesley Institute.
Mai V., Sullivan T., Chiarelli A. (2009). Breast cancer
screening program in Canada: successes and
challenges. Salud Publica Mex, 51, S228-S235.
MapOfUSA. (2007). US population density map. URL
http://www.mapofusa.net/us-population-density-
map.htm.
MapQuest. (2014). Geocoding API. URL
https://developer.mapquest.com/products/geocoding.
Mitra T., Counts S., Pennebaker J. (2016). Understanding
anti-vaccination attitudes in social media. Tenth
International AAAI Conference on Web and Social
Media. AAAI.
Myers E., Moorman P., Gierisch J., Havrilesky L., Grimm
L., Ghate S., Davidson B., Mongtomery R., Crowley
M., McCrory D., Kendrick A., Sanders G. (2015).
Benefits and harms of breast cancer screening: a
systematic review. JAMA, 314, 1615-1634.
Nakhasi A., Passarella R., Bell S., Paul M., Dredze M.,
Pronovost P. (2012). Malpractice and malcontent:
analyzing medical complaints in Twitter. AAAI Fall
Symposium on Information Retrieval and Knowledge
Discovery in Biomedical Text.
Pang B., Lee L. (2008). 4.1.2 Subjectivity detection and
opinion identification. Opinion mining and sentiment
analysis. Now Publishers Inc.
Passarella R., Nakhasi A., Bell S., Paul M., Pronovost P.,
Dredze M. (2012). Twitter as a source for learning
about patient safety events. Annual Symposium of the
American Medical Informatics Association (AMIA).
Paul M., Dredze M. (2011). You are what you tweet:
analyzing Twitter for public health. International
Conference on Weblogs and Social Media (ICWSM).
Paul M., Dredze M., Broniatowski D., Generous N. (2015).
Worldwide influenza surveillance through Twitter.
AAAI Workshop on the World Wide Web and Public
Health Intelligence.
PewResearchCenter. (2015). Social media update 2014.
Pew Research Center. URL http://
www.pewinternet.org/2015/01/09/social-media-
update-2014/.
Pulman S. (2014). Multi-dimensional sentiment analysis.
Oxford: Dept. of Computer Science, Oxford University.
URL http://www.lt-
innovate.org/sites/default/files/lt_accelerate_files/13.3
0%20Stephen_Pulman_UNIV_OXFORD.pdf.
Smith M., Broniatowski D., Paul M., Dredze M. (2015).
Tracking public awareness of influenza through
Twitter. 3rd International Conference on Digital
Disease Detection (DDD).
Sugawara Y., Narimatsu H., Hozawa A., Shao L., Otani K.,
Fukao A. (2012). Cancer patients on Twitter: a novel
Sentiment Analysis of Breast Cancer Screening in the United States using Twitter
273

patient community on social media. BMC Research
Notes, 5, 699.
Thackeray R., Burton S., Giraud-Carrier C., Rollins S.,
Draper C. (2013). Using Twitter for breast cancer
prevention: an analysis of breast cancer awareness
month. BMC Cancer, 13, 508.
Twitter. (2014). Geo guidelines. Twitter. URL
https://dev.twitter.com/overview/terms/geo-developer-
guidelines.
Vance K., Howe W., Dellavalle R. (2009). Social internet
sites as a source of public health information.
Dermatologic Clinics, 27, 133-136.
Wang W., Hsu S., Wang J., Huang L., Hsu W. (2014).
Survey of breast cancer mammography screening
behaviors in Eastern Taiwan based on a health belief
model. Kaohsiung Journal of Medical Sciences, 30,
422-427.
Zhao D., Rosson M. (2009). How and why people Twitter:
the role that micro-blogging plays in informal
communication at work. 243-252.
KDIR 2016 - 8th International Conference on Knowledge Discovery and Information Retrieval
274
