
Information Search in Ontology Visualization – An Eyetracking User
Study of Indented List on Desktop and Tablet Computers
Anh Huynh and Bo Fu
Department of Computer Science, California State University, Long Beach, Long Beach, California
Keywords: Eye-tracking, Indented List Visualization, Usability, Biomedical Ontologies.
Abstract: A large amount of research efforts have focused on designing and developing ontology visualization methods
over the years, but less effort in comparison has been put on evaluating usability support of these existing
ontology visualization techniques particularly in rising interaction mediums such as touchscreen devices. This
paper investigates the visual support of indented list visualization - traditionally designed for desktop
computers - in the context of class search activities using traditional desktop computers as well as tablet
computers. Using task-based user studies conducted on desktop and tablet computers, we analysed the
difference between task success, task speed, eye gaze, as well as qualitative data collected from usability
questionnaires, we found that the indented list visualization is not as effective on tablet computers with
increased gaze activities, where many users preferred using it on desktop computers.
1 INTRODUCTION
Traditional desktop computers (configured with mouse
and keyboard) have provided a main platform for
human computer interaction for several decades. In
recent years, the increased usage
1
of tablet computers
brings a much needed examination of the effectiveness
of touchscreen interactions in suppor-ting information
search activities in comparison to tradition desktop
computers.
Ontology visualization typically assumes that the
users are interacting with these visualizations using
traditional desktop computers. With an ever-increa-
sing number of users accessing the web via mobile and
tablet devices instead of personal computers, this
assumption may no longer be representative of the vast
amount of users today.
Given this current user characteristic, there is a
pressing need to investigate whether established
ontology visualization techniques such as indented lists
are providing the desired interactive support to users
using tablet computers. More specifically, this paper
investigates whether touch screen interactions change
how users browse pertinent information, and whether
1
The Pew Research Center reported in 2015, the number of adults
who own a tablet computer increased from 3% to 45% between
2010 and 2015, see: http://www.pewinternet.org/2015/10/29/
technologydevice-ownership-2015/pi_2015-10-29_device-
ownership_0-01/
search accuracy and efficiency differ from that of
desktop computer interactions.
Through user studies with tasks focusing on
searching for specific ontology classes using indented
list visualizations, we measure user success and task
speed using desktop and tablet computers. In addition,
eye tracking is used to supplement observations of
search behaviours, such as gaze efficiency and
navigation. Furthermore, participants are asked to
complete the System Usability Scale (SUS)
questionnaire as described by (Brook., 1996) to
evaluate “the effectiveness (ability to complete tasks),
efficiency (the level of resource consumed by tasks),
and satisfaction (user’s subjective reactions to the
system) of the interfaces”.
2 RELATED WORK
Visualizations are used to convey various different
kinds of data in the real world, from health related data
(Brown et al., 2016), genetic sequencing data (Kearse
et al., 2012), to database information (Stolte, Tang and
Hanrahan, 2012). Visualizations that are originally
designed for desktop computers are often transferred to
tablet computers with little modification. Previous
research (Chittaro, 2006) has found that mobile
visualization is significantly different from desktop
visualizations due to physical limitations such as
Huynh A. and Fu B.
Information Search in Ontology Visualization â
˘
A ¸S An Eyetracking User Study of Indented List on Desktop and Tablet Computers.
DOI: 10.5220/0006053101290135
In Proceedings of the 8th International Joint Conference on Knowledge Discovery, Knowledge Engineering and Knowledge Management (IC3K 2016), pages 129-135
ISBN: 978-989-758-203-5
Copyright
c
2016 by SCITEPRESS – Science and Technology Publications, Lda. All rights reserved
129
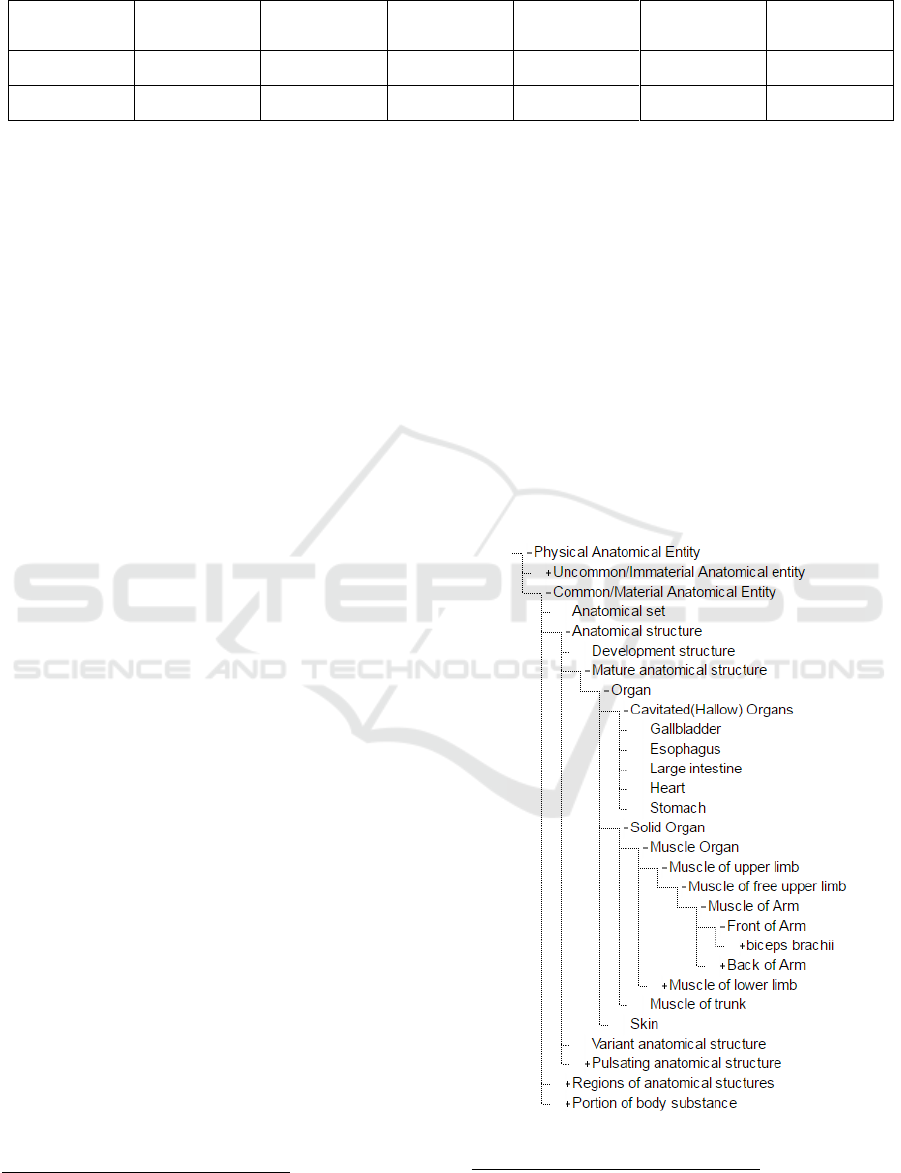
Table 1: Characteristics of Anatomy and Disease Ontology.
Ontology
Classes
Maximum
Subclasses
Longest Path
Object Property
Data Property
Multiple
inheritance
Disease
46
6
6
15
-
1
Anatomy
76
7
12
140
30
1
smaller screen size, less powerful hardware to render
visualizations, and different inputs methods (e.g. finger
tap, stylus). It is thus of interest for us to evaluate
established ontology visualization techniques such as
indented lists, whether they remain effective on tablet
computers.
A significant amount of research effort has focused
on comparing different visualization techni-ques on
desktop interfaces (Katifori et al., 2007). In
comparison, less attention has been placed on
examining whether visualization techniques primarily
designed for desktop computers are transferable to
tablet interfaces. Prior research in (Rivadeneira and
Bederson, 2003), (Plaisant, Grosjean and Bederson.
2002) and (Katifori et al., 2006), suggests indented list
visualization as an efficient method for searching
ontology class information, with dominant user
preferences as stated by (Fu, Noy and Storey, 2013)
and (Golemati, 2008), and (Fu, Noy and Storey, 2015)
claims it is more effective at supporting information
search activities. A related question naturally arises as
to whether the indented list visualization remains
effective for information search activities carried out
on tablet computers.
3 EXPERIMENT
To investigate the aforementioned research question,
we carried out task-based user studies using
biomedical ontologies. Participants are asked to search
for specific classes of the given ontologies using
indented lists visualizations. The remainder of this
section discusses further details of the ontologies, the
visualizations, eye tracking, and the experiment
protocol used in our study.
3.1 Ontologies
To minimize potential bias that may be a result of
domain expertise, we chose two domains such as the
disease and the anatomy ontology, which are taken
from BioPortal (Whetzel et al., 2014). The disease
2
http://bioportal.bioontology.org/ontologies/DOID/?p=summary
3
http://bioportal.bioontology.org/ontologies/FMA/?p=summary
ontology
2
has 9247 classes, the maximum number of
children 88 and the maximum depth of 12; the anatomy
ontology
3
contains 104145 classes, the maximum
number of children 225 and the maximum depth of 23.
In our experiment, we used a subset of the
aforementioned ontologies. As shown in table 1, the
disease ontology
4
used in our study contains 46 classes
with a maximum of 6 subclasses for a class, 15 object
properties, no data property and 1 occurrence of
multiple inheritance. The anatomy ontology
5
used in
our study contains 76 classes with a maximum of 7
subclasses for a class, 140 object properties, 30 data
property, and 1 occurrence of multiple inheritance.
The anatomy ontology is relatively more complex
than the disease ontology, with more classes, a higher
number of subclasses per class, and longer paths to
Figure 1: Example Indented List Visualization.
4
https://aqueous-spire-79089.herokuapp.com/
5
https://infinite-brushlands-54265.herokuapp.com/
KEOD 2016 - 8th International Conference on Knowledge Engineering and Ontology Development
130
root. To ensure the ontologies are comprehendsible to
a wide range of participants, we used novice
terminologies as opposed of scientific terminologies
where appropriate. For example, for the purpose of
our experiment, the class: Cavitated Organs is
renamed to Hallow Organs, and the class Material
Anatomical Entity is renamed as Common/Material
Anatomical Entity in the anatomy ontology.
3.2 Indented List Visualization
The indented list visualizations are implemented
using the D3.js library and presented in a web
browser. Figure 1 shows an example visualization of
the anatomy ontology. Classes are presented in a
vertical list, and indentations are used to illustrate is-
a relationships. The dotted lines illustrate superclass-
subclass relationships and siblings. The + icon
expands a class and reveals its subclasses. The – icon
collapes a class and hides its subclasses. The absence
of an + or – indicates a class has no subclasses.
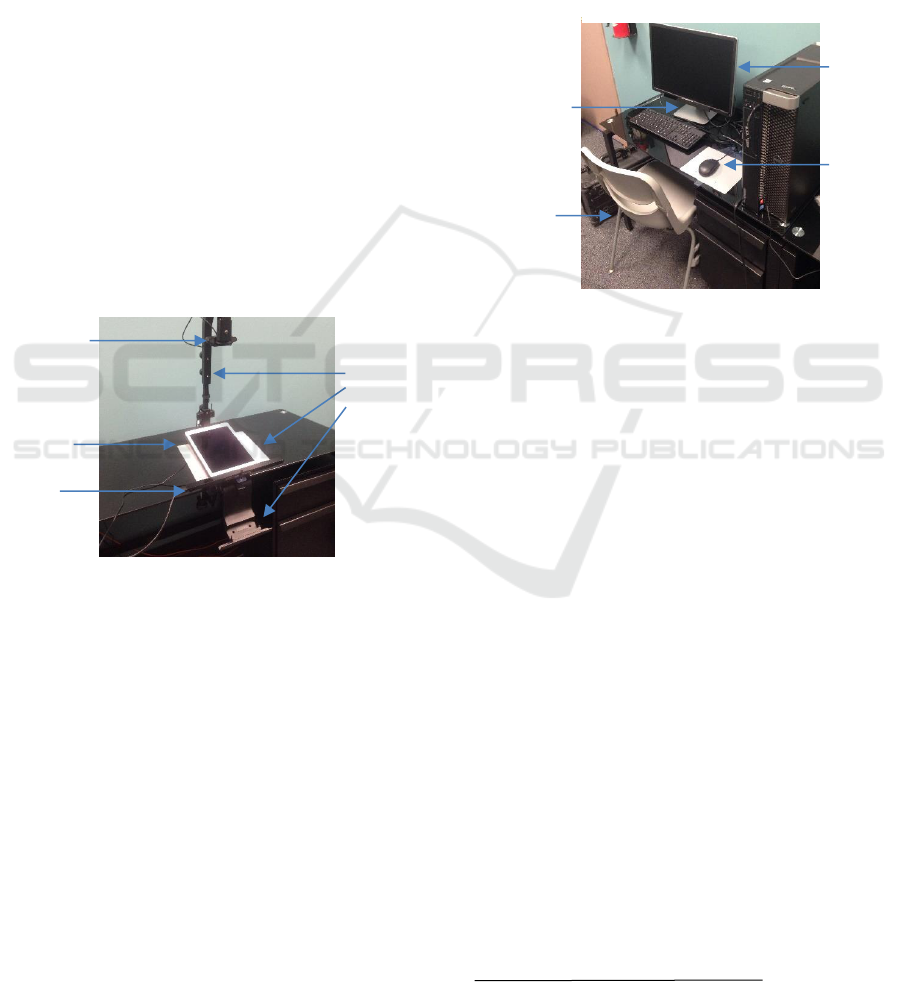
3.3 Equipment and Setup
We used a Tobii Pro X3-120 eye tracker to capture
gaze data. For the tablet interface, an Apple iPad Air
2 is placed upon the Tobii Mobile Stand X2. The
tablet has a dimension of 16.95 x 24 cm and uses a
2048 x 1536 pixel resolution. For the desktop
configuration, a Dell Precision Tower 5810
workstation with a 24” monitor, mouse, peg-leg chair
are used. The monitor has a dimension of 56.5 x 49.9
cm, and a resolution of 1920 x 1080 pixels.
The Tobii Pro X3-120 eye tracker is situated at the
bottom of the monitor in the desktop interface (shown
in Figure 2), and below the tablet in the mobile
interface (shown in Figure 3). The eye tracker has a
sampling rate of 120Hz, with operating distance at
50-90cm. The eye tracker verifies the data recorded
by assigning validity codes (a number from 0-4) to
every row of data throughout a recording. In this
study, only data with 0 validity codes (meaning both
eyes are found and tracked by the eye tracker) are
used in the analysis to reduced bias. The data parsing
and cleaning code used in this study can be found
online
6
. Calibration is carried out before each
recording. Subtle head movements are tolerated by
the Tobii Pro X3-120 eye tracker, and participants
were instructed to refrain from large movements after
successful calibration. This setup simulates a typical
usage and common interaction with desktop monitors
and tablet screens.
3.4 Eye Tracking Metrics
In the context of information search, shorter scan path
may be considered as an indication of an optimal
route of navigation when the search is completely
directed to the required information (Goldberg,
1999). Scan path gives insight to gaze behaviour by
examining the physical trace of alternating fixations
and saccades sequences. By treating fixations as gaze
points and saccades as edges between these points,
scan path measures the visual distance a participant’s
gaze travel on a screen by summing the distance
between gaze points, or the total length of the
saccades measured in pixels. In other words, scan
path is an eye productivity measurement in the sense
that it measures eye activity. Goldberg claims a small
scan path typically means the search is directed and
methodological, and a large scan path indicates
undirected or possibly exhaustive search behaviour.
In contrary, exhaustive search behaviours tend to
systematically visit all possible candidates for the
solution. Ideal search behaviours may be understood
as those that produce smaller task time and shorter
scan path, suggesting that the task was completed
faster with fewer eye movements. In other words,
time was used efficiently and eye gazes were used
strategically.
6
https://github.com/HDSCLabSource/Source
Monitor
Mouse
Chair
Figure 3: Desktop Setup.
Eye
Tracker
Mobile
stand
Ipad
Eye
Tracke
r
Figure 2: Tablet Setup.
Camera
Information Search in Ontology Visualization â
˘
A¸S An Eyetracking User Study of Indented List on Desktop and Tablet Computers
131

3.5 Participant Recruitment and
Experiment Protocol
Undergraduate and graduate students from the
Department of Computer Engineering and Computer
Science with background in ontologies and
interactive visualization were asked to participate in
this experiment.
Each participant was given an overview on the
interactive features, such as zooming and selecting
for the tablet interface, and mouse control and
clicking for the desktop interface. Note that font sizes
were set to the same zoom level on both the desktop
and tablet interface before each recording.
Additionally, participants were given instructions on
the tasks to be accomplished. They are encouraged to
be as fast as they can to complete the given tasks and
once the eye tracking recording begins, they can no
longer ask questions or interact with the researcher.
Table 2 shows a list of the tasks used in our study.
Table 2: Anatomy and Disease Ontology Tasks.
Anatomy Ontology Tasks
1. Name three muscle in the ‘Leg’.
2. What are the two parents of ‘Heart’?
3. Find the parent of ‘Left Triceps’.
4. What is the parent of ‘Fissure of Tooth’?
Disease Ontology Tasks
1. Find parent of ‘Down Syndrome’.
2. What are the two parents of ‘Diabetes’?
3. What is the child of ‘Obesity’?
4. What is the parent of ‘sleep disorder’?
To reduce potential bias that may be a result of
increased familiarity with a given domain, each
participant is shown two ontologies. Also, to
minimize potential bias caused by whether a
participant was given the tablet or desktop interface
first, we alternated the following 4 combinations
between experimental runs and participants, e.g.
disease/tablet, disease/desktop, anatomy/tablet, and
anatomy/desktop. After completing one of these four
combinations, participants partake in a second
combination being the other ontology and the other
interface, e.g. a participant would answer questions
about the disease ontology using the tablet interface,
and then answer questions about the anatomy
ontology using the desktop interface.
The time a participant takes to complete all the
questions is recorded. Task accuracy (e.g. a success
score about how many questions were answered
correctly) and gaze data are also collected from each
participant. In addition, participants also completed
the SUS questionnaire for each interface, having
questions rated on a scale of 1-5. These scores are
normalized in the range of 0-100, higher scores
indicate more favourable perception of that interface.
Furthermore, we asked each participant’s overall
preference between desktop and tablet computers,
with the goal of eliciting qualitative feedback.
4 RESULTS
A total of 24 participants took part in our study. A
total of 463.1 megabyte of text file eye tracking data
were collected, and 1,281,271 valid gaze points were
analysed after data cleaning. Unpaired two-tailed t-
tests with the standard confidence level of .95, or
significance level, α of .05 were applied to verify
statistical differences (if any).
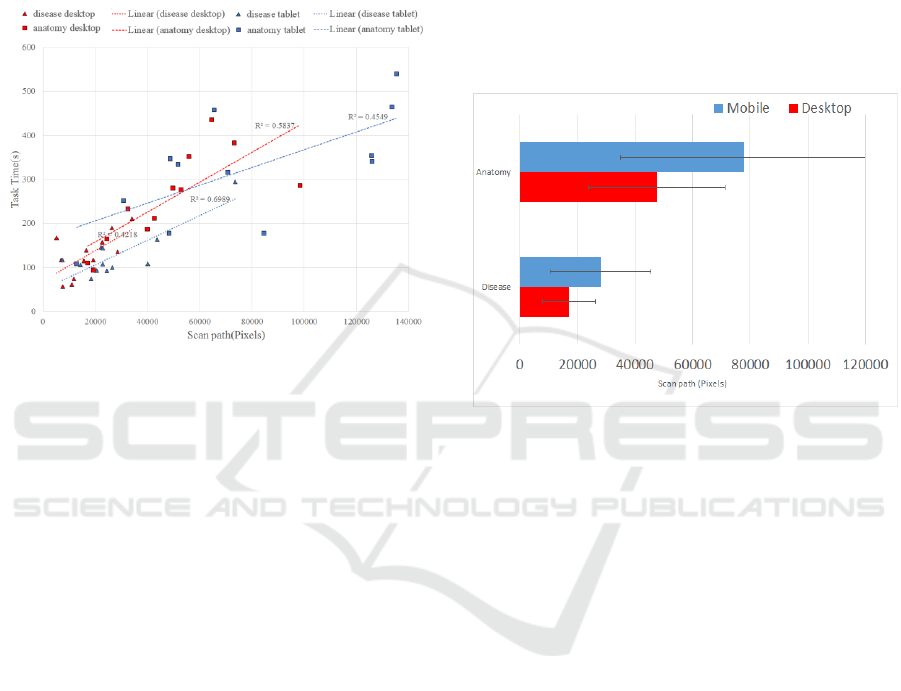
4.1 Task Time Vs Scan Path
Correlation
Since task time typically represents search efficiency
and scan path typically is an indication of search
productivity, together they may give a holistic view.
Figure 4 shows a positive correlating relationship
between the two, with r-values: .4218
(disease/desktop), .6989 (disease/tablet), .5847
(anatomy/desktop), .4549 (anatomy/tablet). General-
ly, when task time increases, scan path also increases.
Interestingly, we observed some participants have
comparable task time but noticeably longer scan path,
most notable in the anatomy/tablet group (blue
squares in Figure 4). Specifically, these are data
points within their respective group that lies in the
lower and further right region of Figure 4, meaning
shorter task time and longer scan path. This result
suggests an exhaustive search method in which
participants systematically visit all possible
candidates to find the solution.
However, our data also shows a lengthy scan path
does not always lead to a shorter task time. In fact,
lengthier scan path does not predict a long or short
task time, as seen by points being high on the scan
path axis, and low (efficient exhaustive search) or
high (inefficient exhaustive search search) on the time
axis. Another possible search method is a directed
search. Likewise, this sort of directed search
behaviour, typically having shorter scan path, could
have low (efficient methodological search) or high
(inefficient methodological) task times. Our results
exhibits a little of each of these behaviours, and it
suggest any difference, if any, found in our
KEOD 2016 - 8th International Conference on Knowledge Engineering and Ontology Development
132
experiment between desktop and tablets, will not be
task time. In other words, indented list visualization
on the tablet does not encourage an approach that
reduces task time, and there are no statistically
significant differences in task time between desktop
and tablet interfaces. This does not mean the two
interfaces are equal in terms of usability since scan
path is another important metric that affects usability.
Figure 4: Scatter plot of task time versus scan path.
4.2 Scan Path Length
We found the anatomy ontology has statistically
significant scan path difference when comparing the
desktop and tablet interfaces. In Figure 5, for the
desktop interface, participants’ average scan path is
47540±23755 pixels (blue bar), and for the tablet
interface, average scan path is 77806±42766 pixels
(red bar); a statistically mean defence of -7566 (95%
CI, -15015,-18) pixels, t (12) = -2.14 and p-value <
0.047. Also, we found that the disease ontology has
no significant scan path difference between desktop
and tablet interfaces at p-value = 0.072; nevertheless,
the scan path length is 17148±9269 (red bar) and
28086±17382 (blue bar) pixels respectively. We
speculate that the simple nature of the disease
ontology did not sufficiently augment the difference
between desktop and tablet computers. For example,
the entirety of the disease ontology can be fitted on
the tablet and desktop monitor, but the entirety of the
anatomy ontology cannot fit on the tablet.
In comparison to desktop monitor, on the tablet
interface, participants’ average scan path increased by
a factor of 1.64 for both ontologies, and scan paths
exhibit a factor of 1.80 and 1.86 increase in variance
for anatomy and disease ontology respectively. In
relation to average scan path, it may be expected that
mobile devices have larger fonts than desktop
computers using the zoom feature of tablet interface
and this may be the obvious reason for longer scan
path. In relation to scan path variance, this may be a
result of uncertainty caused by frequent scrolling
back and forth, which leads the eyes to acutely travel
more (i.e. increased scan paths), and some
participants may scroll more than others to
comprehend the task at hand. This result suggests that
indented list visualizations on tablet computers may
have led to confusion for some participants, as
reflected by additional gaze activities in the process
of information search.
Figure 5: Scan path length (pixels). For the both the
anatomy and disease ontology, the tablet interface has a
much larger scan path, and a significant amount of variance.
4.3 User Preference
For the desktop and tablet interface, shown in Figure
6, the SUS score is 86.4±10.2 and 79.2±11.2 points
respectively with a statistical mean difference of 7.17
(95% CI, (.80, 13.55), t (24) = 2.27 and p-value <
0.028. This finding suggests that participants
preferred the desktop interface, because it is easier to
use and they find it familiar. For example, one
participant says, “Despite, having experience with
both interface, the tablet was difficult to use”, another
says, “The desktop is less cumbersome and easier to
use”, and a third says, “The desktop mouse is handier
to use than the touch screen, and manipulation with
the tablet was harder. Touching sometimes need to
tap twice, and it is not as responsive as I would like.
You have to be accurate with your hand”. Overall
user preference also showed a significant difference
in favour of the desktop interface, with 16 out of 24
participants stated they preferred the desktop
interface.
Information Search in Ontology Visualization â
˘
A¸S An Eyetracking User Study of Indented List on Desktop and Tablet Computers
133
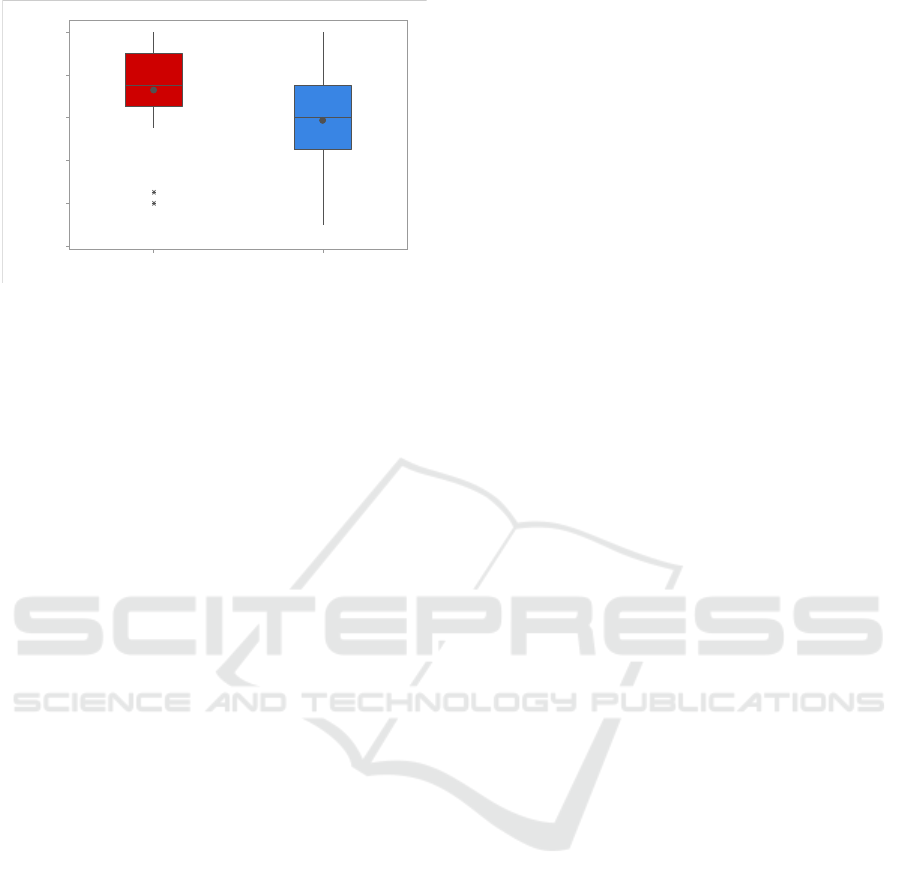
Figure 6: Box Plot of SUS of desktop and mobile scores. *
are outliers. The square contains 50% of all data points.
Horizontal line inside the square is the median, and the dot
is the mean.
5 CONCLUSIONS AND FUTURE
WORK
Although we did not find statistically significant
difference in task time or task accuracy, we have
found some evidence suggesting that the indented list
visualization is more effective on desktop computers
than tablet computers, such as overall user preference,
scan path discrepancy, e.g. more consistent scan path
for desktop, and shorter scan paths when using
desktop computers. Although our statistical tests did
not show any significant in task accuracy or speed,
this does not imply desktop and tablets are the same
in supporting the given tasks. For example, perhaps
increased user engagement or mental processing
power on the tablet may have equalized speed and
accuracy and offset the advantages otherwise gained
on a desktop. Potential future research could
investigate exclusively whether this speculation is
true.
Secondly, there may be a critical point where an
exhaustive search (large scan path) may outperform
directed search (small scan path), and vice versa. If an
ontology is relatively but not overly simple, it may be
more efficient to engage users in exhaustive searches
simply because it will not take a long period of time
to traverse the entire ontology. On a tablet device, it
may also be more efficient to encourage participants
to conduct an exhaustive search, going through the
expanded portions and then collapsing after
traversing them to allow greater focus on a single
section. For example, the ontology visualizations on
the tablet computer may not be seen in its entirety,
and it may be frustrating to use a directed search
method because of the limited view. On the other
hand, if the ontology is very complex and contains a
lot of classes, an exhaustive search approach can
produce long task time if some classes are missed by
the participant and needs many more rounds of
searching. Depending on the characteristics of the
ontologies, interaction designs may focus on guiding
users in either exhaustive or directed search.
It should be noted that there are several factors not
explicitly tested in the design of this experiment. For
instance, we discussed searching behaviours and
patterns that participants engage in, but we did not
confine them to searching in a particular way, i.e.
exhaustive, or directed search. In addition, age,
gender, and cognitive styles were not explicitly
investigated. Future experimentation can include
these factors to determine if any of the
aforementioned variables could have a significant
effect on user speed or accuracy, such as grouping
participants by age or gender may show differences
in user preference and gaze activities. In addition,
future experiments could examine various screen size
and whether an ideal size exists for the desktop or
tablet environment. Furthermore, it may be useful to
consider stylus versus finger tapping as another
influential factor in touchscreen interaction design.
Lastly, participants have significantly rated the
desktop interface to be superior, some have
mentioned inconveniences using the tablet interface,
such as “accidentally clicking interactive objects in
the visualization”, “confusion from scrolling”, and
“the smaller screen space made it harder than the
desktop”. For these reasons, and increased gaze
activities, we found that indented list visualization on
tablets is less effective than on desktop machines.
REFERENCES
Brooke 1996. SUS: A “Quick and Dirty” Usability Scale,
In: P.W. Jordan, B. Thomas, B.A. Weerdmeester,
McClelland. Usability Evaluation in Industry, pp. 189–
194.
Brown B., Chetty M., Grimes A., and Harmon E 2006.
Reflecting on Health: A System for Students to Monitor
Diet and Exercise. In CHI '06 Extended Abstracts on
Human Factors in Computing Systems ACM.
Kearse M., Moir R., Wilson A., Stones-Havas S., Cheung
M., Sturrock S., Buxton S., Cooper A., Markowitz S.,
Duran C., Thierer, T. Ashton B., Meintjes P., and
Drummond Alexei 2012. Geneious Basic: An
Integrated and Extendable Desktop Software Platform
for the Organization and Analysis of Sequence Data.
Bioinformatics, vol.28, no. 12, pp 1647-1649.
Stolte C., Tang D., and Hanrahan P., 2002. Polaris: a
system for query, analysis, and visualization of
multidimensional relational databases. In IEEE
MobileDesktop
100
90
80
70
60
50
Score
KEOD 2016 - 8th International Conference on Knowledge Engineering and Ontology Development
134

Transactions on Visualization and Computer Graphics,
vol. 8, no. 1, pp. 52-65.
Chittaro L 2006. Visualizing Information on Mobile
Devices, Computer, vol.39, no. 3, pp. 40-45.
Katifori A., Halatsis C., Lepouras G., Vassilakis C. and
Giannopoulou E 2007. Ontology Visualization Methods
- A Survey. ACM Computing Surveys, vol.39, no.4,
Article 10.
Rivadeneira W. and Bederson B.B 2003. A Study of Search
Result Clustering Interfaces: Comparing Textual and
Zoomable Interfaces.
Plaisant C., Grosjean J. and Bederson B.B. 2002.
SpaceTree: Supporting Exploration in Large Node Link
Tree, Design Evolution and Empirical Evaluation.
Proceedings of IEEE INFOVIS ’02, Boston, pp 57-64.
Katifori A., Torou E., Halatsis C., Vassilakis C., Lepouras
G 2006. A Comparative Study of Four Ontology
Visualization Techniques in Protégé: Experiment Setup
and Preliminary Results. Proceedings of IV’06.
Fu, B., Noy, N.F., Storey, M.-A. 2013. Indented tree or
graph? A usability study of ontology visualization
techniques in the context of class mapping evaluation.
In ISWC 2013, Part I. LNCS, vol. 8218, pp. 117–134.
Springer, Heidelberg.
Fu, B., Noy, N.F., Storey, M.-A. 2015. Eye Tracking the
User Experience - An Evaluation of Ontology
Visualization Techniques. Semantic Web Journal.
Golemati M 2008. An Interview-Based User Study on the
use of Visualizations for Folder Browsing. 12th
International Conference Information Visualisation,
London, pp. 106-112.
Whetzel P.L., Noy N.F., Shah N.H., Alexander P.R.,
Nyulas C, Tudorache T, Musen M.A 2011. BioPortal:
enhanced functionality via new Web services from the
National Center for Biomedical Ontology to access and
use ontologies in software applications. Nucleic Acids
Res.
Goldberg J 1999. Computer Interface Evaluation using Eye
Movement: Methods and Constructs. International
Journal of Industrial Ergonomics, vol.24, no.6, pp 631-
645.
Information Search in Ontology Visualization â
˘
A¸S An Eyetracking User Study of Indented List on Desktop and Tablet Computers
135
