
A Tracing System for User Interactions towards Knowledge
Extraction of Power Users in Business Intelligence Systems
Safwan Sulaiman
1
, Tariq Mahmoud
1
, Stephan Robbers
1
, Jorge Marx Gómez
1
and Joachim Kurzhöfer
2
1
Department of Computing Science, Oldenburg University, Oldenburg, Germany
2
Lufthansa Industry Solutions, Norderstedt, Germany
Keywords: User Interactions, Knowledge Extraction, Power User, Self Service, Business Intelligence.
Abstract: Business intelligence has been widely integrated in enterprises to help their employees in their decision
making process by delivering the needed information at the right time. Statistics from Gartner Group
showed that the investment in the business intelligence domain has recently been very high. However,
different studies and market researches showed that the pervasiveness and the usage percentage rate of
business intelligence are still very low. The reason behind that is the complexity of the usage of business
intelligence systems. Moreover, enterprise users lack analytical skills. To mitigate this problem, a new
concept of self-service business intelligence has been developed. Within this system, the knowhow of power
user is extracted and delivered to business users in form of recommendations. In this paper, we present the
conception and development of the tracing module of this new system. This module has the goal of tracing
the interactions of power users as the first step to extract their procedural knowledge in form of analysis
paths. This is done by creating a user interaction catalogue in which the interactions are defined based on
their relevance to the knowledge extraction process. Finally, this paper presents the internal architecture of
this tracing module and its components.
1 INTRODUCTION
In the 60s of the last century, the first efforts were
made to support decision makers and managers in
enterprises through the use of information systems.
Later in the 80s, the term “Management Support
Systems” was established by Scott Morton as “the
use of computers and related information technolo-
gies to support managers” (Morton, 1983; Kemper et
al., 2010). Following that, the term Business
Intelligence (BI) was emerged and coined by
Howard Dresner of the Gartner Group in 1989
(Power, 2008). BI includes technologies that supply
an enterprise-wide information with analysis
functionalities (Gluchowski and Chamoni, 2016). It
plays a critical role for enterprises and it had been
changed from a helper to a prerequisite for their
success (Wixom and Watson, 2012). Enterprises live
today in a very competitive business environment
within a dynamic market and to ensure continued
success in their business, they recognize the
importance of providing their employees with an
accurate relevant and timely information by
effectively use of BI tools (Hawking and Sellitto,
2015). The CIOs survey done by Gartner in 2016
showed that BI and analytics still came in the last
years on the top of CIOs’ technology priority
(Gartner, 2015). Accordingly, the importance of
implementing BI systems is widely accepted by
enterprises and therefore, they spend a lot of money,
16,9 billion USD in 2016, to invest in this domain
(T. E. Yoon et al., 2014; Gartner, 2016).
The rest of this paper is structured as follow: The
next section will give a background knowlegde in BI
and self-service BI domains. After that, in section 3
the problem statement is defined. Then section 4
comprises an analysis phase in which different BI
systems are investigated regarding their existing log
mechanisms, also with regard to the possible user
interactions with the system. After that, the
requirements of this module are defined. Followed
by designing of user interaction catalogue.
Afterward, based on the requirements the concept
and the architecture of the tracing module are
designed. As a proof of concept, a prototype has
been implemented and based on business scenarios
Sulaiman, S., Mahmoud, T., Robbers, S., Gómez, J. and Kurzhöfer, J.
A Tracing System for User Interactions towards Knowledge Extraction of Power Users in Business Intelligence Systems.
DOI: 10.5220/0006053601990207
In Proceedings of the 8th International Joint Conference on Knowledge Discovery, Knowledge Engineering and Knowledge Management (IC3K 2016) - Volume 3: KMIS, pages 199-207
ISBN: 978-989-758-203-5
Copyright
c
2016 by SCITEPRESS – Science and Technology Publications, Lda. All rights reserved
199

and expert interview, the concept has been evaluated
and discussed.
2 BACKGROUND KNOWLEDGE
In BI systems, we can differentiate among Power
User (PU) and Business User (BU). In our research,
the user who can fully administer all the capabilities
of BI system from IT and analytical perspective is
classified as PU. Otherwise, the user is classified as
BU. Recently, the desire of BUs have increased to
get support in dealing with BI systems particularly
in the field of complex analysis (Sulaiman et al.,
2015). Thus, enterprises desire to democratize
analytics capabilities through using of self-services
to meet the time-to-insight required by competitive
business environments (Gartner, 2016).
The key factor in the success of implementing
new information systems and especially BI systems
is based on the effective use of such systems by their
employees (Boyer et al., 2010). In addition, besides
the large investment in implementing BI systems,
the acceptance and adoption of the end user for such
IT systems is very important to insure the success of
their investment (Hart et al., 2007). therfore, BI
systems can provide full value for enterprises just if
they are completely pervasive (Bijker and Hart,
2013).
After the introducing of the self-service BI from
the Data Warehousing Institute in 2011, the goal was
to empower BUs to get the information they need
without relying on IT staffs (Imhoff and White,
2011). Self-service was a buzz-word for most of BI
vendors. In 2013 and 2014, self-service BI was the
main feature to market BI tools. Moreover, statistic
from different BI surveys and market studies like the
BI survey conducted by BI Scorecard showed that
the adoption of BI systems is still very low at 22%
of the users in the enterprise (McLean, 2015).
According to the “BI Survey 15”, the median
percentage of employees who use BI systems in
enterprises had increased by more than 2% to reach
13% in total (BARC Research, 2016).
3 PROBLEM STATEMENT
BI systems are complex business information
systems. This complexity is coming from the
complex data model that integrates data from many
internal and external resources to be consolidated
into one single point, which is the data warehouse.
Accordingly, this led to a weak usage of such system
by BUs. The main reason behind that is the lack of
required analytical and IT skills or knowhow of
BUs. Such lack leads to the point that PUs get a
large number of requests from BUs to answer their
questions to help them using BI system to make
better decision. Therefore, the main problem
addressed in this research is that the number of
requests sent to PUs is very excessive and they
might not be able to respond to these requests in the
right time. This leads to the need of enhancing the
analytical and IT skills of BUs to use the BI systems
(Infor, 2013; Evelson, 2013; Sulaiman et al., 2015).
BI systems include wide range of tools that cover
different needs of various user groups. These tools
are categorized based on the ease of use perspective
from dashboard, standard reports up to interactive
reports (with more flexibility in the analysis). On top
of these tools, there are the advanced tools like
OLAP tools, which give the decision maker the
ability of free navigation in a whole multidimen-
sional data model of the business data. Data mining
tools, which need a special knowledge from the user,
are considered more complex (Bange, 2016). The
advanced tools are characterized via the large
amount of domain-independent operations, proce-
dures and visualizations (Mertens, 2013). PUs don’t
have a predefined path to follow while using these
tools. Therefore, granting more flexibility to the
users will lead to a more usage complexity of such
tools (closer to PU skills than BU skills) (Mertens,
2013).
Based on the above problems of using BI
systems, it is clear that there is a need to conduct a
research to overcomes these problems. A new BI
architecture is designed in this research to enhance
the IT and analytical skills of BUs based on the
recommendations derived from PUs was already
proposed by (Sulaiman et al., 2015). The idea behind
this architecture is to extract and capture the
procedural knowledge (knowhow) of PUs to be
stored in a knowledge repository and then making it
available to BUs in form of recommendations. This
architecture includes four modules namely: tracing
module, analysis module, knowledge repository and
recommendation engine. These modules have been
integrated to the traditional reference model of BI
system. In this paper, we will present the conception
and development of the tracing module. The main
research question behind this module is: “How can
we trace the PUs while they are performing data
analysis using BI systems with the goal to extract
their procedural knowledge (knowhow)?” Therefore,
the main goal of this module is to find a mechanism
KMIS 2016 - 8th International Conference on Knowledge Management and Information Sharing
200

to trace and store all the interactions of the PUs with
the BI system while they are using it, which is
directly related to their knowhow, and without
interrupting their works. This phase represents the
first step to extract the knowhow of PUs. After that,
the stored interactions of PUs’ will be made
available to the analysis module to be analyzed by
applying sequential pattern mining algorithms as the
second phase of the knowhow extraction, but this
module is not considered in this paper. In the
discussion section of this paper we will explain the
possibility to use this tracing system in other
domains like learning management system and E-
Learning.
4 ANALYSIS PHASE
In this section, two kinds of analysis of various BI
systems were done. Firstly, the existing logging
mechanisms were investigated and analyzed. The
goal of this analysis is to check if it is possible to
derive the user interactions from the existing log
files of the BI systems. Secondly, the analysis was
done for the user interface of different BI systems to
check what user interactions are possible to perform
in these BI systems from BI users. Based on these
analyses, we will decide later to choose between
server-side or client-side method for the collection
of the interaction’s data.
4.1 BI Systems Analysis
We had defined a number of criteria to select BI
systems to be analyzed. These criteria will help us
later in choosing one of them for the implementation
of the designed architecture as a proof of concept.
The criteria are software type (closed vs. open
source), license, the supported Web-based user
interface, support of complex analysis (OLAP),
readability and the access to the source code. Based
on the above-mentioned criteria, we have chosen
three BI systems to be analyzed. These systems are
Pentaho Server Community Edition 5.3,
JasperReports Server Community Edition 5 und
SpagoBI 5.1. We will use the following short names
in rest of this paper Pentaho, JasperReports and
SpagoBI respectively.
4.1.1 Pentaho
Pentaho is one of the most powerful open source BI
systems. In addition to Pentaho commercial open
source BI-Platform, Pentaho offers a community
edition, which can be freely used under the Open
Source GPL license (Haneke et al., 2010).
Logging Mechanism
Pentaho BI system locates in the log folder the
following five text files: localhost, pentaho, catalina,
host manager and manger. Essentially, these files are
used to log error messages that occur when starting
or using the system. However, there are additional
log files like the Mondrian ones. By configuring the
BI system, it is possible to create log files for the
analysis component of Mondrian. These are divided
into the three text files mondrian, mondrian_mdx
and mondrian_sql. The Mondrian log file records the
structure of the multidimensional data model while
creating an analysis. However, this data cannot be
matched or assigned to a user, since no information
like an IP address or a session ID are logged with it.
User Interface
Two analyses were done for the User Interface
(UI) of Pentaho. On the one hand, UI was analyzed
related to its visual components, which can be
interacted from a BI user. On the other hand, the
components were analyzed on the level of HTML
elements to investigate what metadata can be
collected from them.
The analyzing of the interactions with the UI
components was done by simulating the behavior of
the PU while he uses BI system. That means,
different scenarios were defined to simulate PU
behavior like creating new OLAP analysis to answer
a business question. Or to open an existing analysis
to get various views of the business data, which
already requested from a BU. While doing these
scenarios all the interactions with Pentaho were
documented to be compared later with the
interactions from the other BI systems to build a
standard interaction catalogue.
The second analysis was done on the level of
HTML element. If we consider by example the form
of the login page, as we could recognize from the
HTML code of this form that the both input
elements can be identified based on the ID and the
name of the element. The button “login” has also an
ID and an event. By monitoring this event, the
logging in of the user can be detected and many
relevant interactions data can be collected by reading
the user name, the system time, the properties of the
HTML element, the properties of the parent
container and the browser data through monitoring
the events.
4.1.2 JasperReports
Like Pentaho, JasperReports is one of the largest
A Tracing System for User Interactions towards Knowledge Extraction of Power Users in Business Intelligence Systems
201

open source BI systems. JasperReports is available
in three different versions (Community, Professional
and Enterprise Editions) (Haneke et al., 2010).
Logging Mechanism
Similar to Pentaho, JasperReports runs on the
famous Apache Tomcat server. Accordingly, there
are similar logging mechanisms to Pentaho. The
tomcat log files of JasperReports are distributed in
the following log files: commons daemon, host
manager, jasperreportstomcat stderr,
jasperreportstomcat stdout, localhost, localhost
access log and manager. In these files, error
messages are mainly logged. In contrast to Pentaho,
the localhost access log file logs the GET and POST
requests to the server, and the following information
can be read from this log: the IP address of the user,
the time, the query method, the resource to which
he/she has access. Moreover, JasperReports doesn’t
provide logs about the entire structure of the
multidimensional data model.
User Interface
Similar to the analyses were done for Pentaho,
different scenarios were done by creating various
analysis to investigate the interactions between the
PUs and the UI of JasperReports. It was found that
the general design of JasperReports UI is a bit
different from Pentaho UI, but the main part for
analysis is similar to each other, especially because
both systems use the Mondrian OLAP engine as a
backend.
Unlike Pentaho, the analysis of the HTML of the
UI components in JasperReports HTML code is
structured somewhat differently. The input element
is not enclosed in a div-container, but placed directly
as part of a cell in the table. It was found that the
name of dimension member can be extracted from
the span element located in the innerHTML property
of the same cell. InnerHTML is described as a
property that sets or returns content of an HTML
element.
4.1.3 SpagoBI
In contrast to Pentaho and JasperReports, SpagoBI is
absolute an open Source BI system. SpagoBI falls
entirely under the GNU LGPL license (Gioia et al.,
2008).
Logging Mechanism
The amount of log files in SpagoBI system is
greater than the other two systems. It was found that
the system creates the famous Pentaho and
JasperReports default Tomcat log files like catalina,
localhost or host-manager. In addition, a separate
text file for logging is created for each
subcomponent. Essentially, these are used for
logging error messages in the system. Moreover,
SpagoBI has another log file called
SpagoBI_(x)_OperatorTrace. It includes information
like user’s name, its role in the system, timestamp,
used browser and the operating system.
In conclusion, SpagoBI has similar logging
mechanisms as in Pentaho and JasperReports.
However, the log files are divided into the individual
sub-components of the system.
User Interface
For analyzing the interactions of the UI the same
scenarios, which already done for the other two
systems, were done using SpagoBI. All the possible
interactions were documented. As a result of the
analysis, it was found that SpagoBI has a bit
different design in the navigation bar. However, it is
similar to the both BI systems in the analysis part.
In conclusion of the analysis phase: It can
certainly identify different logging mechanisms that
sometimes have a higher or have a lower level of
details. In addition, it allows special log files by
configuring the logging. However, the data are often
written in different files independently. Thus, a
combination of the data is very difficult. Another
disadvantage is that usually just a few data are
available on the user and her/his actual interactions.
This is because the main goal of these logging
systems is to log the troubleshooting and the error
occurrences in the BI system. Therefore, a result of
the analysis indicates that the client-side data
collection is better suited for the collection of
relevant data of the user’s interaction.
5 CONCEPTION OF BI-Tracer
In this section, the requirements of the tracing
module are defined. After that, the user interaction
catalogue is described. Finally, the architecture of
the tracing module (which we named BI-Tracer) is
illustrated and its components are explained in
details.
5.1 Requirement Definitions
The requirements of the tracing module in this
section are investigated based on its functions. The
requirements target the client and server
applications. The main processes identified in this
context are: the extraction or capturing of
interactions of the PU to store them in an appropriate
KMIS 2016 - 8th International Conference on Knowledge Management and Information Sharing
202
form and the forwarding of BU interactions to the
recommendation engine at run-time. This latter is
needed to register in the system what the BU is
trying to do by storing the made steps and
comparing them with the analysis paths from the
knowledge repository.
5.1.1 Requirements for the Client
Application
The client application is responsible for detecting
interactions at run-time for complex analysis,
distinguishing between BU/PU and sending
interactions to the connected modules. While
capturing the interactions, the client application
distinguishes between PU and BU and based on the
user type, the interaction is processed. In case of PU,
the interactions are stored for later analysis (in the
analysis module). As for BU, the captured
interactions data are sent via an interface to the
recommendation engine. The client application
communicates with the server application via an
interface that transmits the interaction data to the
server application and retrieves the data back from
it.
5.1.2 Requirements for the Server
Application
Here, the main requirement is that the identified PU
interactions are stored. The server application has an
interface to receive/send data from/to the client
application and an interface to send the stored PU
data to the analysis module.
5.2 User Interaction Catalogue
Before we design the user interaction catalogue,
there is a need to know what data are relevant to
perform a complex analysis. In general, as much
data as possible are better for the collection. Peters
had described three kinds of relevant data for
interaction: user, usage and environment data
(Peters, 2014).
User data are about the user of the BI system.
User data play an important role to
differentiate between PU and BU.
Usage Data are defined as the interaction of
the user with the user interface of BI system.
Such data are the fundamental information to
be traced and stored via the tracing module.
Environment Data describe the data, which
are not directly connected to the BI user and
include timestamp or browser data.
Besides these three types, a fourth type is
relevant, that is the interaction’s Descriptive Data.
It includes the interaction ID, name and description.
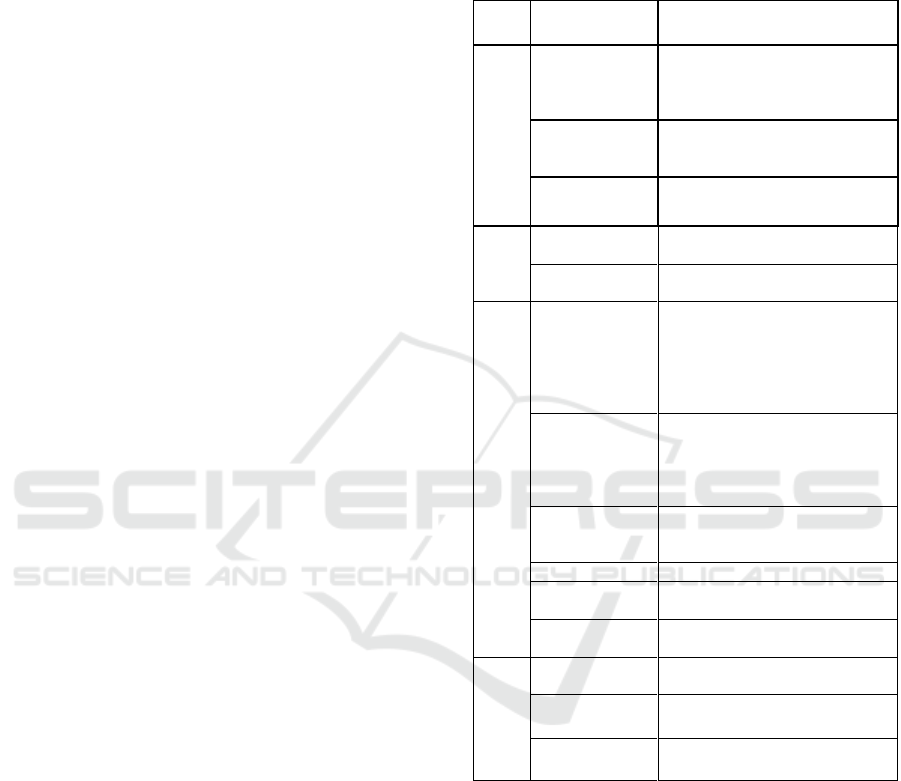
Table 1: Interaction’s Types of Data.
Type of
data
Attribute
Description
Descriptive data
ID
The ID is a unique identification
code of interaction. It consists of a
three-character code like for
example 'P01'.
NAME
The name is a brief description,
which usually identifies the
interaction in a word.
DESCRIPTION
The description is a detailed text
that describes the interaction.
User data
USER-NAME
The user name is the name of the
user who logs into the system.
USER-ROLE
The role of the user in the system
that can be either BU or PU.
Usage data
OLAP_OPERAT
OR
This type of usage data may occur
only for interactions which relate
to a complex analysis. It indicates
what OLAP operator was
executed. It is established in the
phase of creating the catalogue.
DIMENSIONS_
ELEMENT
This attribute identifies the
dimension element that is affected
by this interaction. It can also only
occur with interactions in the
context of complex analysis.
HTML_ELEME
NT
This attribute describes the type of
HTML element within an
interaction.
HTML_ID
The ID of the HTML element.
INNER_HTML
The InnerHTML of the element
text.
EVENT
The event that triggers the
interaction.
Environment
data
BI_SYSTEM
The name of the BI system.
SESSION_ID
The session ID of the user’s
session.
ZEIT_STEMPEL
The system time at which the
interaction occurred.
Descriptive data are defined in the creation
process of the interaction catalogue.
Based on this classification of the relevant
interaction data and the analysis described in Section
4, a concept for a generic interaction catalogue is
presented here. Table 1 lists the four types of
relevant date with their attributes and descriptions.
The rest of the data can be extracted from the
metadata description of the BI system. This
description consists of different tags written in
square brackets. They provide information where the
data are read out in the UI. Table 2 provides an
overview of the tags used in the interaction
catalogue.
A Tracing System for User Interactions towards Knowledge Extraction of Power Users in Business Intelligence Systems
203
Based on the analysis of the different UI of BI
systems, an interaction catalogue with 58 entries is
defined. It represents the important interactions
needed to perform data analysis. As mentioned
before, the ID should be unique to reference a
specific PU step in BI system. The IDs will be
analyzed then with the sequential pattern mining to
extract patterns (analysis paths).
And the rest of attributes and tags are used later
in the recommendation engine to identify the
element in the user interface. Moreover, they are
also used to filter the results of recommendations
based on the attribute like “name” that can be
“cube”, “dimension” or “fact name”.
Table 2: Tags of the Interaction Catalogue.
Tag
Description
[USER_NAME]
This tag is for the user name that is read
from the system.
[USER_ROLE]
This tag describes the source of data to
read the user role.
[SYSTEM_TIME]
This tag represents the system time.
[HTML_ELEMENT]
The type of the HTML element is read
through this tag.
[HTML_ID]
This tag represents the ID of the HTML
element.
[HTML_NAME]
The name of the HTML element is read
through this tag.
[HTML_PARENT_
INNERTEXT]
Via this tag, the innerHTML text of the
parent container is read out.
[BI_SYSTEM]
Via this tag, the name of the BI system
is read out.
[EVENT]
This tag reads out the event that triggers
the interaction.
[HTML_ELEMENT_
INNERHTML]
Via this tag, the InnerHTML of the
element text is read out.
[DOCUMENT_COO
KIE_SESSION_ID]
The session ID of the browser is read out
through this tag.
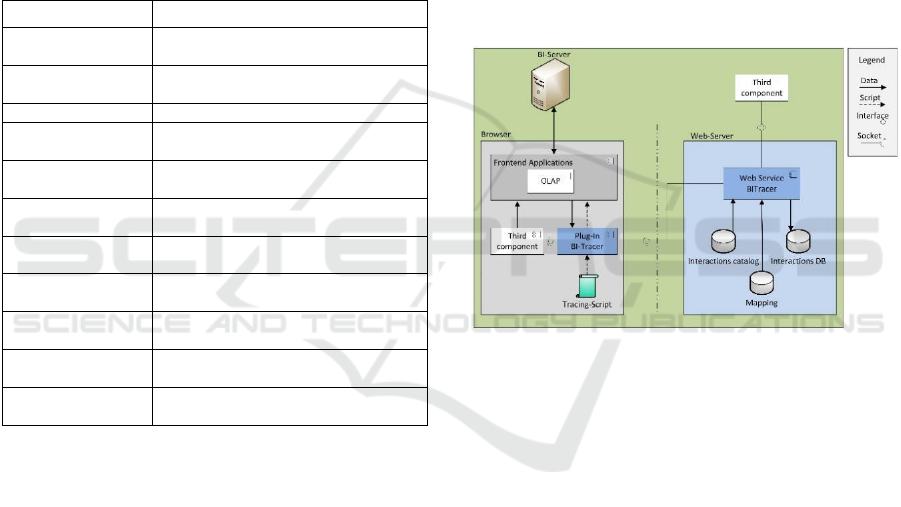
5.3 BI-Tracer Architecture
The BI-Tracer is based on the client-server
architecture. Three-tier client-server architecture is
divided into three layers: the presentation, applica-
tion and data storage layers. The presentation layer
in the client application is represented in form of
both a browser plug-in and a tracing script. These
both serve for detecting user interactions. The
application layer is represented by a Web service
responsible for providing and recording data. The
data layer is represented as a database. The
individual components of BI-Tracer are connected to
other components and must be able to interact with
other modules. For example, the plug-in is not only
responsible for giving the detected interaction data
to the Web service. Rather, it communicates also
with the recommendation engine. Figure 1 shows
how BI-Tracer’s components communicate with
each other and how they are integrated with the
other components of other modules.
The BI Server provides via HTTP the contents of
the frontend application in the browser. The plug-in
integrates a tracing script in the frontend application
to record the interactions of users. In addition, the
plug-in provides an interface through which the
interaction data are made available for a third
component (like component from recommendation
engine) in case of BU. As for PU interaction, the
interaction data are provided via an interface to the
Web service. On the other hand, the Web server will
provide the plug-in with the interaction catalogue
and the mapping data. The mapping data are needed
to reference the defined metadata descriptions from
the interaction catalogue with user interface
elements to extract the data accordingly.
Figure 1: Architecture of the BI-Tracer.
5.3.1 Presentation Layer
As can be seen in Figure 1, the presentation layer
consists of the plug-in and the tracing script. The
plug-in calls the current version of the interaction
catalogue and the mapping from the Web server.
The interaction catalogue contains the metadata that
describe the data collected by an interaction and
where these data are read out. The mapping
references the user interface’s elements for the
interactions described in the interaction catalogue.
This step is necessary because the definition of the
interaction catalogue is generic and does not have
references to the UI elements.
Interactions are detected by events that are
triggered in the UI element by the user. Such an
event contains information about the item that has
been triggered. These data are compared with the
mapping and checked for matches. If a match is
found, an object is generated according to the
metadata description, which represents an
KMIS 2016 - 8th International Conference on Knowledge Management and Information Sharing
204

interaction. This object is provided then based on the
role of user in the BI system (PU or BU) to the Web
service or to an interface for third-party components.
5.3.2 Application Layer
The application layer consists of the Web service
that receives, distributes and transfers data from and
to the data layer. The Web service has two
interfaces. The first interface is responsible for
sending the metadata of interaction catalogue and
the mapping data to the plug-in besides retrieving
the recorded interaction data from it. The second
interface is responsible for retrieving stored data by
third-party components such as the analysis
component. Via the communication with data layer,
it is possible to send different data to other modules
and to receive data from them.
The data layer is also addressed by an internal
interface that links it with the application layer
5.3.3 Data Storage Layer
The data storage layer is responsible for storing the
resulting data. It provides access to the interaction
catalogue and the mapping data. In addition, the
interaction data produced by PU are stored in a
separate data source. The possible storage formats
for such kind of data can be the common file format
like CSV or XML as well as the storage in a
relational database.
6 BI-Tracer PROTOTYPE
Based on the requirements and the architecture of
BI-Tracer explained before, a prototype for BI-
Tracer was implemented as a proof of concept.
Firstly, a BI system had been chosen based on the
criteria mentioned in Section 4. After that, a short
description is explained about the technologies used
in the implementation in the server and client sides.
Pentaho Business Analytics Platform was chosen
because it is an open source BI system under the
GPL license. Moreover, it includes different BI
Tools like reporting, dashboard and OLAP analytics,
which can be accessed via a Web browser.
6.1 Implementation and Technologies
Client Technologies: The client application has
been implemented as an extension for the
Google Chrome browser. Moreover, the plug-
in itself was implemented using JavaScript and
JQuery. JSON has been used as a lightweight
format for exchanging data between the Web
server and Web pages. It has been used as a
basis for the development of the Chrome
extension.
Server and Storing Technologies: The
Representational State Transfer (RESTfull)
Web service was selected as a lightweight
technology in the server side. The presented
interaction catalogue and the mapping data
have a strong tabular form of metadata for
describing interaction data. Therefore, the
following three storing forms are suitable:
CSV, XML and relational database. CSV has
been chosen because it is human readable.
Compared with the other formats, CSV is
considered more as a lightweight technology.
Based on this, the extracted interactions are
stored in the Web server as CVS files for every
PU session.
6.2 Evaluation and Discussion
The evaluation of this work was divided into two
phases. The first evaluation was conducted to verify
the correctness and completeness of the
functionalities of the BI-Tracer. The second
evaluation was done to check the applicability of the
BI-Tracer in the praxis based on expert’s interviews.
In the first phase, the prototype was verified
against the functional requirements. Firstly, different
business scenarios for OLAP analysis were done in
Pentaho. After that, the resulted trace files (CSV)
were checked and compared with the steps
performed in Pentaho. It was found that BI-Tracer
has captured all the interactions defined in the
interaction catalogue. Moreover, another plug-in for
Google Chrome was implemented to verify the
forwarding of interaction data to the recommenda-
tion engine in real time and showed that the interface
between both components works correctly.
The second evaluation was done based on an
expert interview together with business scenarios.
Firstly, an OLAP modelled test data were created
and imported to Pentaho. The test data represent a
company, which managed distributed super markets.
We have presented our concept and the implemented
prototype to a BI expert. Based on defined business
scenarios, we had tested the BI-Tracer by simulating
PU usage of Pentaho. A PU wants to create a new
JPivot analysis to send required information to a BU.
The matching is then done between the interactions
in Pentaho UI and the resulted CSV log file of PU
interactions. It was found similar to our tests that the
A Tracing System for User Interactions towards Knowledge Extraction of Power Users in Business Intelligence Systems
205

BI-Tracer has captured all the interactions defined in
the interaction catalogue. In addition, the interface
functionality was demonstrated based on logging in
as a BU and BU interactions were demonstrated
using the extra plug-in. In the next step, we made the
interview with the expert based on question dialog
about the presented results. We have got a good
feedback that the introduced scenarios are a typical
business scenario in praxis. Moreover, the captured
interaction data can be a good basis for the
extraction of knowhow (analysis paths) of the PUs.
As an improvement and extension of the BI-Tracer,
we have a good outlook. It was suggested to give the
PU the possibility to add comments to the analysis
she/he performs. This will improve the quality of the
extracted analysis paths. However, this might
interrupt PUs while doing their job. In Addition, we
should consider in our work the data privacy in the
company as the BI-Tracer captured all the
interactions of the user. Hence, such legal
perspectives should be taken into account while
using it in the company.
There were some limitations by conducting this
work. Firstly, the analyzed BI systems are limited to
the open source systems, because of licensing issues
and the fact that we are not allowed to change their
code. Secondly, it is not possible now to guarantee
that the interaction catalogue as a standard and
generic catalogue includes 100% of all possible
interactions for all BI systems. But based on its
structure, it is possible to extend it in easy way if
new interactions are recognized without the need to
change anything in the code of BI-Tracer. This is
because, as already explained in Section 5, the
catalogue is loaded every time from the server to the
client when the plug-in is activated.
Another point to discuss is the generalization of
this works. We already designed the tracing system
as a Web-based system with a standard interaction
catalogue, which can be extended or rebuilt based on
the new user interface. Therefore, this system can be
used by another Web-based system like learning
management and E-Learning systems, which have
also the goal to provide students (similar to BU)
with teachers’ knowledge (similar to PU). In this
case the teacher could be traced to build the right
paths to solve a given problem. Moreover, student
could be traced to find where they have always
problems to improve the E-Learning system
structure accordingly. Finally, based on this
discussion, it is possible to use the tracing system in
every Web-based system that has similar
classification of its users like expert and beginner
users.
7 CONCLUSIONS
This paper presented a new approach for tracing the
interactions of PU while using BI systems. The
stored interactions form the basis of the PU
procedural knowledge (knowhow) extraction.
Firstly, different BI systems were analyzed based on
their logging mechanisms to investigate the
possibility of extracting user interactions from the
existing log files. In addition, the BI systems’ UIs
had been analyzed to check what interactions are
possible to be captured while using the system.
Based on that, a standard interaction catalogue had
been designed. The requirements then for the BI-
Tracer architecture had been defined. Based on these
requirements, three-layer client-server architecture
was designed and a BI-Tracer prototype had been
implemented. Finally, this prototype had been
evaluated based on expert interview and a business
case scenario.
In our future work, we will investigate different
algorithms from the sequential pattern mining
domain. The goal is to find the appropriate
algorithm, or to adapt one of them to be applied to
our developed PUs’ interactions data to extract
patterns that represent the analysis paths of the PUs.
These will be used by a recommender engine to
generate recommendations for the BUs.
REFERENCES
Bange, C. (2016), Werkzeuge für analytische
Informationssysteme, in Gluchowski, P. and Chamoni,
P. (Eds.), Analytische Informationssysteme, Springer
Berlin Heidelberg, Berlin, Heidelberg, pp. 97–126.
BARC Research (2016), The BI Survey 15, available at:
http://barc-research.com/bi-survey-15/ (accessed 28
April 2016).
Bijker, M. and Hart, M. (2013), Factors Influencing
Pervasiveness of Organisational Business Intelligence.
Boyer, J., Frank, B., Green, B., Harris, T. and van de
Vanter, K. (2010), Business Intelligence Strategy: A
Practical Guide for Achieving BI Excellence, MC
Press, LLC.
Evelson, B. (2013), Top 10 BI Predictions for 2013 and
Beyond, available at: http://blogs.forrester.com/
boris_evelson/12-12-12-top_10_bi_predictions_for_20
13_and_beyond (accessed 6 April 2016).
Gartner (2015), Flipping to Digital Leadership, Insights
from the 2015 Gartner CIO Agenda Report.
Gartner (2016), Gartner Says Worldwide Business
Intelligence and Analytics Market to Reach $16.9
Billion in 2016”, available at: http://www.gartner.
com/newsroom/id/3198917.
Gioia, A., Cazzin, G. and Damiani, E. (2008), SpagoBI: A
KMIS 2016 - 8th International Conference on Knowledge Management and Information Sharing
206

distinctive approach in open source business
intelligence, Phitsanuloke, Thailand.
Gluchowski, P. and Chamoni, P. (2016), Analytische
Informationssysteme, Springer Berlin Heidelberg,
Berlin, Heidelberg.
Haneke, U., Trahasch, S. and Al., T.H.e. (2010), Open
Source Business Intelligence (OSBI): Möglichkeiten,
Chancen und Risiken quelloffener BI-Lösungen, 1.
Aufl., Carl Hanser Fachbuchverlag, [S.l.].
Hart, M., Esat, F., Rocha, M. and Khatieb, Z. (2007),
Introducing students to business intelligence:
acceptance and perceptions of OLAP software,
Informing Science: International Journal of an
Emerging Transdiscipline, Vol. 4 No. 1, pp. 105–123.
Hawking, P. and Sellitto, C. (2015), Business Intelligence
Strategy: A Utilities Company Case Study, Int. J.
Enterp. Inf. Syst., Vol. 11 No. 1, pp. 1–12.
Imhoff, C. and White, C. (2011), Self-Service Business
Intelligence, TDWI Best Practices Report, Third
Quarter.
Infor (2013), The democratization of data. How
information can give power to your people, available
at:
http://www.infor.com/content/whitepapers/democratiz
ation-of-data.pdf (accessed 6 April 2016).
Kemper, H.-G., Baars, H. and Mehanna, W. (2010),
Business Intelligence – Grundlagen und praktische
Anwendungen, Vieweg+Teubner, Wiesbaden.
McLean, V. (2015), Investment in Self-Service Analytics
to Increase, Finds 2015 State of Self-Service BI
Report, available at: https://www.logianalytics.com/
news/investment-in-self-service-analytics-to-increase-
finds-2015-state-of-self-service-bi-report/ (accessed 9
April 2016).
Mertens, M. (2013), KNOBI - knowledge-based business
intelligence for business user information-self-service,
Oldenburg computer science series, Vol. 26, OlWIR,
Oldenburger Verl. für Wirtschaft, Informatik und
Recht, Edewecht.
Morton, M.S.S. (1983), State of the art of research in
Management Support Systems, Center for Information
Systems Research, Sloan School of Management,
Massachusetts Institute of Technology.
Peters, D. (2014), Adaptive Lehr- und Lernsysteme zur
Unterstützung der praktischen Ausbildung an ERP-
Systemen, Oldenburger Schriften zur Wirtschafts-
informatik, Bd. 13, Shaker, Aachen.
Power, D.J. (2008), Decision Support Systems: A
Historical Overview, in Burstein, F. and W.
Holsapple, C. (Eds.), Handbook on Decision Support
Systems 1, Springer Berlin Heidelberg, Berlin,
Heidelberg, pp. 121–140.
Sulaiman, S., Mahmoud, T., Gómez, J.M. and Kurzhöfer,
J. (2015), Automatic Knowledge Transfer-based
Architecture towards Self-Service Business
Intelligence, Rome, Italy.
T. E. Yoon, B. Ghosh and Bong-Keun Jeong (2014), User
Acceptance of Business Intelligence (BI) Application:
Technology, Individual Difference, Social Influence,
and Situational Constraints.
Waisberg, D. and Kaushik, A. (2009), Web Analytics 2.0:
empowering customer centricity, The original Search
Engine Marketing Journal, Vol. 2 No. 1, pp. 5–11.
Wixom, B. and Watson, H. (2012), The BI-Based
Organization, in Herschel, R.T. (Ed.), Organizational
Applications of Business Intelligence Management,
IGI Global, pp. 193–208.
A Tracing System for User Interactions towards Knowledge Extraction of Power Users in Business Intelligence Systems
207
