
Stress Level Monitoring in Car Racing
Examples of Measurements during Races
Joachim Taelman
1
, Pieter Joosen
1
, Jean-Marie Aerts
2
, Vasileios Exadaktylos
1
and Daniel Berckmans
2
1
BioRICS nv., Technologielaan 3, 3001 Heverlee, Belgium
2
M3-BIORES, Division Animal and Human Health Engineering, Department of Biosystems, KU Leuven,
Kasteelpark Arenberg 30, 3001 Heverlee, Belgium
Keywords: Stress Monitoring, Racing, Physiological Monitoring, Psychophysiology.
Abstract: Car racing at a high level is a physically and mentally intensive sport. Despite the fact that a large number of
variables are measured on the car during racing, nothing is measured on the driver. It is well known that to
achieve peak performance in competitive sports it is important that the athlete is at their peak both physically
and mentally. The objective of this work is to monitor the mental state of the driver in real-time and provide
this information to the pit crew. A number of interesting cases are presented that show the potential of real-
time stress monitoring in race car driving as a means for driver performance optimisation and as a means to
reduce accidents.
1 INTRODUCTION
Car racing on a circuit is a complex and challenging
sport. Many aspects are influencing the potential
success of winning the race: Not only does the driver
need a competitive car which is pushed to the limits,
but also the driver needs to have the skills to push the
car during the complete race.
In practice, considerable effort and money is spent
by teams to monitor each part in the car with a very
high accuracy: Gears, engine rotations, engine and oil
temperature, accelerations and decelerations,
suspensions, tyre pressure, steering wheel angles, etc.
This information is used to modify and setup the car
perfectly. However, no information is collected from
the driver who is assumed to be sufficiently prepared
while driving this fully monitored car.
Racing is not only a very skilful sport, it is also
very demanding mentally. Each small error can have
a significant impact not only on performance (e.g.
losing the race) but also on safety (e.g. crashing with
potential risks for severe injuries of the driver) and
economic (e.g. financial losses for the team).
Therefore, it is important that not only the car, but
also the (mental) status of the driver is monitored.
Knowing the actual mental state (focused, distracted,
stressed, etc.) of the driver can help improve the
performance of the team in terms of both results and
safety. Monitoring both the car and driver is therefore
beneficial for the individual driver as well as the
team.
Due to the complex conditions, limited research
has been conducted during actual racing situations
(e.g. the works of Schwaberger (1987) and of
Tsopanakis et al. (1998) have looked at stress
hormones, while Matsumura et al. (2011) has focused
on karting) while simulator studies are also limited
(e.g. Katsis et al. (2008) and Katsis et al. (2011)). As
a result, no system is available to monitor the mental
state and the stress levels of race drivers in real-time,
and much less provide this information to the race-
engineers in the pit box for improving performance of
the driver.
In this study, a system was developed and tested
that is monitoring the stress level of the driver in real-
time while the driver is in the race and transmitting
this information to the pit crew. The system is
measuring the stress levels of the drivers and
translates these stress levels to a performance
measure. This is a follow-up of earlier research that
focused on horses (Jansen et al. (2009), Piette et al.,
(2015)) and football (Smets et al., 2013).
The rest of the paper, briefly addresses the system
and methodology while focusing on presenting
interesting cases where the potential of such a system
is shown in relation to increasing performance and
safety in car racing.
Taelman, J., Joosen, P., Aerts, J-M., Exadaktylos, V. and Berckmans, D.
Stress Level Monitoring in Car Racing - Examples of Measurements during Races.
DOI: 10.5220/0006084500590062
In Proceedings of the 4th International Congress on Sport Sciences Research and Technology Support (icSPORTS 2016), pages 59-62
ISBN: 978-989-758-205-9
Copyright
c
2016 by SCITEPRESS – Science and Technology Publications, Lda. All rights reserved
59
2 MATERIAL AND METHODS
2.1 System Description
The stress monitoring system consists of the Mio
ALPHA (Mio Global, Canada) heart beat monitoring
device and the Wiko GOA (Wiko SAS, France)
smartphone.
The heartbeat of the driver is measured by the Mio
ALPHA and is sent via Bluetooth to the smartphone
with a frequency of 1 Hz. A custom built app is
combining the heartbeat of the user with the internal
3D accelerometer of the smartphone to calculate the
stress level of the driver as is described below.
Subsequently, this information is sent to a server via
the 4G network where the information is further
processed to calculate the focus zone of the driver as
described below. Finally, the information is
communicated to the pit crew via a custom made app
on a tablet.
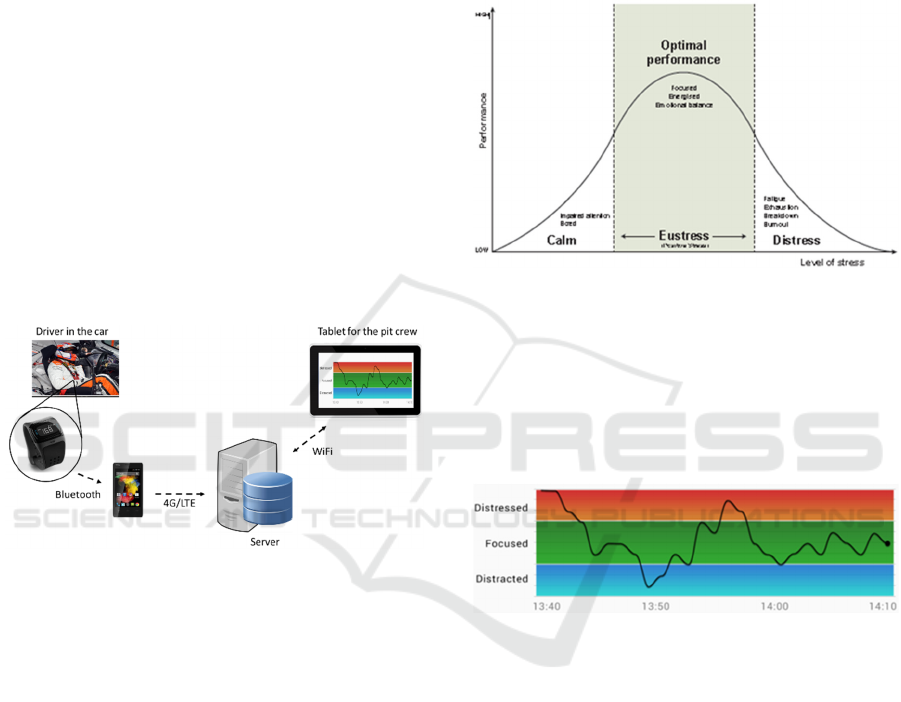
This is depicted in Figure 1.
Figure 1: Schematic diagram of the system.
2.2 Stress Level Monitoring
The principle of stress level monitoring of the driver
is the same as the one presented by Piette et al. (2015)
for monitoring the stress level of the horse rider (with
the model adapted for the car driver). More
specifically, the Heartbeat of the driver is
decomposed into the different components (basic
metabolism, thermoregulation, physical and mental)
and subsequently, the mental component is used to
estimate the stress level of the driver.
The mathematical model used for the estimation
of the physical component of the heartbeat has the
form of a first order input/output transfer function
with activity as input and heart rate as output.
2.3 Focus Zone
In sports applications, some minimum stress level is
required to perform, as shown in Figure 2. If there is
too much stress, the athlete is in a distress stress zone,
while if the athlete is not stressed, the athlete might
be too calm and is not performing as well (Diamond
et al., 2007).
For each driver, the curve, as shown in Figure 2,
is made and the optimal performance zone is
estimated.
Figure 2: Relationship between stress and performance in
sports. The optimal performance zone is highlighted.
During the race, the stress levels of the drivers are
shown in real time in 3 different zones: calm or
distracted zone, optimal performance zone and
distressed zone (Figure 3). The stress level of the
driver is projected in these three zones.
Figure 3: Mapping of the stress level in three zones relating
to focus.
2.4 Data Collection
The system was used in collaboration with the
GetSpeed racing team over more than 2 seasons of the
VLN competition (www.vln.de) and 24h races at the
Nürburgring in Germany on the 28km long track.
Fragments of interesting cases are selected and shown
here.
3 INTERESTING CASES
Several interesting cases are presented to here to
show the potential.
icSPORTS 2016 - 4th International Congress on Sport Sciences Research and Technology Support
60
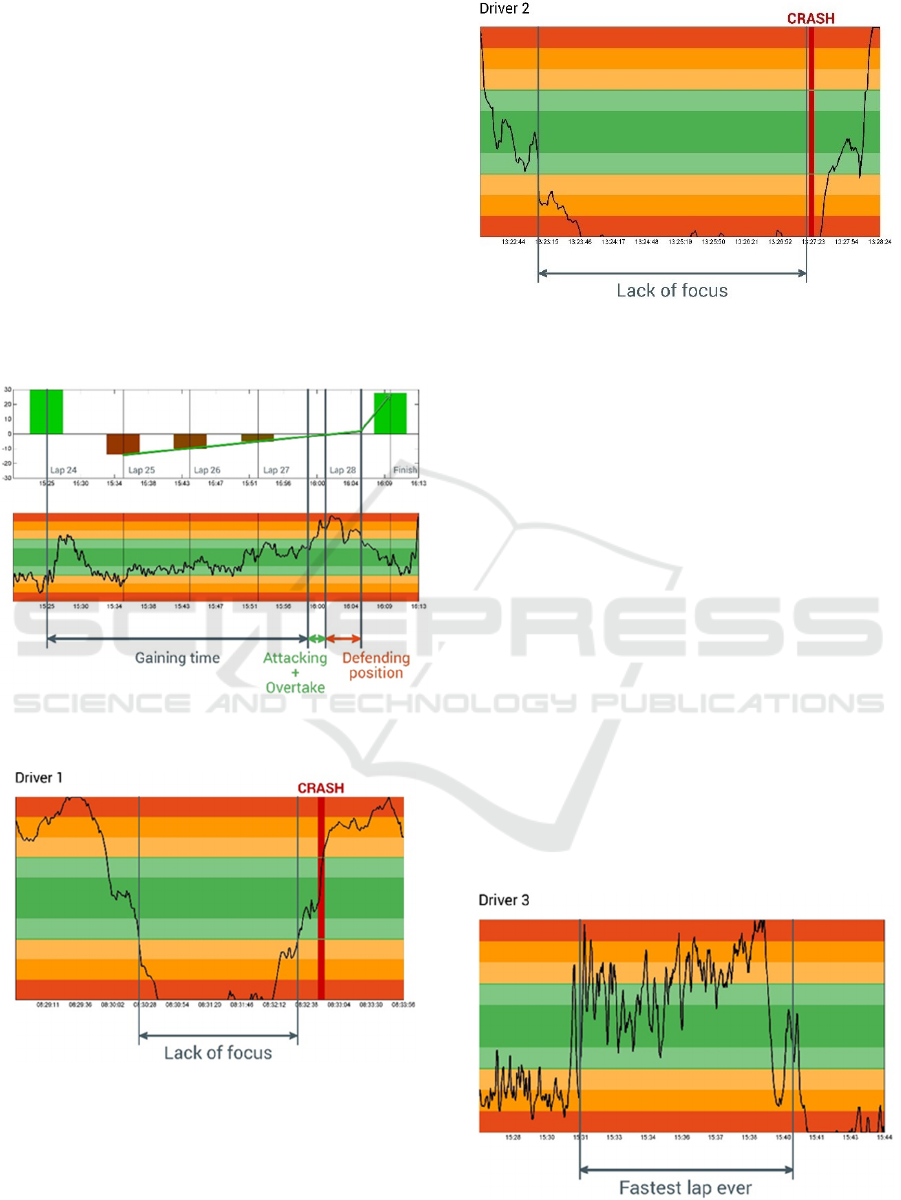
3.1 Battle with Competitor in Eustress
Zone
Figure 4 shows a signal during a close battle between
the monitored driver and his closest competitor. The
top graph is showing the time difference in seconds
between both cars. The lower graph is showing the
stress levels of the driver, projected in his optimal
performance zone (green). After a pit stop in lap 25,
the car is back on the track about 25 seconds behind
his competitor (driving at the first place). The driver
is than for a longer period driving in his optimal
performance zone gaining back time. While
overtaking his competitor, the driver is going in his
distressed zone, but is going back to his optimal zone
once he has taken some advantage.
Figure 4: Top graph shows the time difference with the
competitor, bottom graph shows the performance indicator.
Figure 5: Crash of driver 1 after being in the distracted zone
for 2.5 minutes.
3.2 Crash While the Driver Is Not
Focused
Figure 5 and Figure
6 show two similar events with
different drivers on different moments in the season.
Figure 6: Crash of driver 2 after being in the distracted zone
for 4 minutes.
On both figures, the driver is for a longer period, (2.5
minutes and 4 minutes respectively), in their distracted or
‘under focused’ zone. In these two cases, the car crashed
because of a driver mistake, leading in both cases to a total
loss of the car.
3.3 Personal Best during a Race
This last example (Figure 7) is showing the graph of
a young driver while he was leading the race with a
difference of more than 2 minutes. He was asked by
his race engineer to drive in a controlled way to avoid
any accidents. The graph starts while the driver is
very low in his performance curve. At a certain
moment, the projected stress level of the driver is
increasing to the top of his optimal performance zone
and even crossing. At the end of the lap, the driver has
driven his fastest lap ever on the circuit, breaking his
previous record with 5 seconds. It is clear that the
driver was pushing the car and himself to the limits,
leading to potential risks as his was in the distressed
zone for quite some time.
Figure 7: Young driver outperforming himself and
achieving his fastest lap on the track.
Stress Level Monitoring in Car Racing - Examples of Measurements during Races
61

4 DISCUSSION
In this paper, several interesting cases of using a
mental monitor in car racing are presented. These are
cases monitored during a real competition at the VLN
competition and the 24h races at the Nürburgring. in
Germany.
The system is measuring the mental activity of the
race driver using an optical heart rate sensor on the
wrist of the driver and the internal sensors of a
smartphone.
From these activity and heart rate signals, the
mental activity of each driver is calculated in real-
time. From each driver, three different performance
zones, distracted or under focused, optimal perfor-
mance or eustress and distressed, are calculated.
The cases discussed in this text show the potential
of this approach, by revealing interesting information
of the driver. Being in the optimal zone show that the
driver is performing at this best. By going out of this
optimal zone, the driver is not necessarily performing
at his best level. Both cases with the crashes reveal
that in racing, being too relaxed or under focused is
potentially a serious risk leading in these two specific
cases to a severe accident with a total loss of the car.
The next step of this development is proving the
value of this system with more of these cases. The
potential value is to assist the driver to prevent errors,
which can occur when the driver is out of his optimal
performance zone for a long enough period and to
help the driver to improve his overall driving
performance. Being too stressed for a long period can
also cause problems.
The performance of this system is continuously
improved by adding more car information to calculate
the stress and the optimal performance zone.
ACKNOWLEDGEMENTS
The authors would like to thank the drivers and team
crew of the GetSpeed racing team for their full
collaboration during this work.
REFERENCES
Diamond, D., Campbell, A., Park, C., Halonen, J., Zoladz,
P., 2007. The temporal Dynamics Model of Emotional
Memory Processing: A synthesis on the
Neurobiological Basis of Stress-Induced Amnesia,
Flashbulb and Traumatic Memories, and the Yerkes-
Dodson Law. Neural Plasticity, Article ID 60803.
Katsis, C., Katertsidis, N., Ganiatsas, G., Fotiadis, D., 2009.
Toward Emotion Recognition in Car-Racing Drivers: A
biosignals Processing Approach. IEEE Trans on Syst,
Man and Cybernetics – Part A: Systems and Humans,
38:502-512.
Katsis, C., Goletsis, T., Rigas, G., Fotiadis, D., 2011. A
wearable system for the affective monitoring of car
racing drivers during simulated conditions. Trans Res
Part C: emerging technologies, 19:541-551.
Matsumura, K., Yamakoshi, T., Yamakoshi, Y., Rolfe, P.,
2011. The effect of competition on heart rate during kart
driving: A field study. BMC Research Notes, 4:342.
Piette, D., Exadaktylos, V., Berckmans, D., 2015.
Automated stress monitoring and suitability assessment
in candidate police horses. International Equitation
Science Conference. Vancouver, Canada, 5-8 August
2015.
Smets, E., Joosen, P., Taelman, J., Exadaktylos, V.,
Berckmans, D., 2013. Monitoring the mental status of
football players. Proceedings of the International
Congress on Sports Science Research and Technology
Support. icSports. Villamoura, Portugal, 20-22
September 2013 (pp. 206-213).
Schwaberger, G., 1987. Heart rate, metabolic and hormonal
responses to maximal psycho-emotional and physical
stress in motor car racing drivers. Int Arch Occup
Eviron Health, 59:579-604.
Tsopanakis, C., Tsopanakis, A., 1998. Stress hormonal
factors, fatigue, and antioxidant responses to prolonged
speed driving. Pharmacol Biochem Behav, 60:747-751.
icSPORTS 2016 - 4th International Congress on Sport Sciences Research and Technology Support
62
