
Physically Inspired Digital Predistortion for Dual Input Doherty
Power Amplifiers and Automatic in-Situ Identification
Giovanni Donati, Christian Musolff, Giuseppe Gottardo, Daniel Popp and Georg Fischer
Friedrich Alexander University of Erlangen-Nuremberg, Cauerstrasse 9, 91058 Erlangen, Germany
{giovanni.donati, christian.musolff, giuseppe.gottardo, daniel.popp, georg.fischer}@fau.de
Keywords: Digital Signal Processing, Digital Predistortion, Dual Input Doherty, Power Amplifiers
Abstract: A novel approach for the linearization of dual input Doherty power amplifier (DPA) is derived by taking
inspiration from the operation of the device. A new point of view is evaluated and an automatic
identification procedure is developed, reducing the complexity of the predistorter, improving linearity and
eciency at the same time and avoiding the usage of crest factor reduction (CFR). It is also emphasized the
importance of a power dependent phase relationship between the inputs of the dual input DPA. A validation
of the theory is performed by means of a MATLAB/ADS envelope co-simulation.
1 INTRODUCTION
Modern telecommunication systems are aiming for
very high performance demanding high linearity,
eciency and wide bandwidth. A key component of
the Base-Station (BS) operation is the power
amplifier, which is the major contributor to the
whole power consumption of the system. The
signals used in order to improve the spectral
eciency have high peak to average power ratio
(PAPR) and are decisive in terms of the average
eciency of the whole system. For this reason
Doherty Power Amplifiers (DPA) are representing a
primary choice for BS applications. DPAs deliver an
extended eciency range and are perfect candidates
for amplification of signals with a very high
dynamic range. Furthermore, the advances in the
design techniques led to new power amplifier (PA)
architectures able to deliver high eciency over a
large bandwidth of operation. Class J and JF
realizations of the DPA are making use of harmonic
terminations to improve the bandwidth. It has
already been demonstrated that separating the input
branches and driving them separately is of huge
benefit in terms of bandwidth and reconfiguration of
the power added eciency (PAE) (Gustafsson,
Anderson and Fager, 2012; 2013). Also the concept
behind the algorithms for digital pre-distortion
(DPD) of dual input DPA were documented
(Cahuana et al., 2014), reporting very good
performance and showing the advantages of using
this architecture in BSs. The previous research has
demonstrated the advantage of driving MAIN and
PEAK amplifiers by means of a static splitter,
implemented in the digital domain, delivering the
optimal combinations of the inputs signals to the PA
in order to obtain high eciency (up to 42%).
Despite the improvements, the eect of the phase
dierence between the two input branches is still not
fully characterized yet. In this article we are showing
the importance of the power dependent phase
correction to be applied at the input of the dual input
DPA architecture, and we are presenting a way to
automatically identify the optimum combinations of
the inputs in-situ. We have reached an average
power eciency of 51%, and we developed a simple
physics-inspired algorithm for the pre-distortion that
we tested with a 5 MHz LTE signal. The results are
demonstrated and validated using envelope
simulations in Advanced Design System (ADS).
2 THEORY
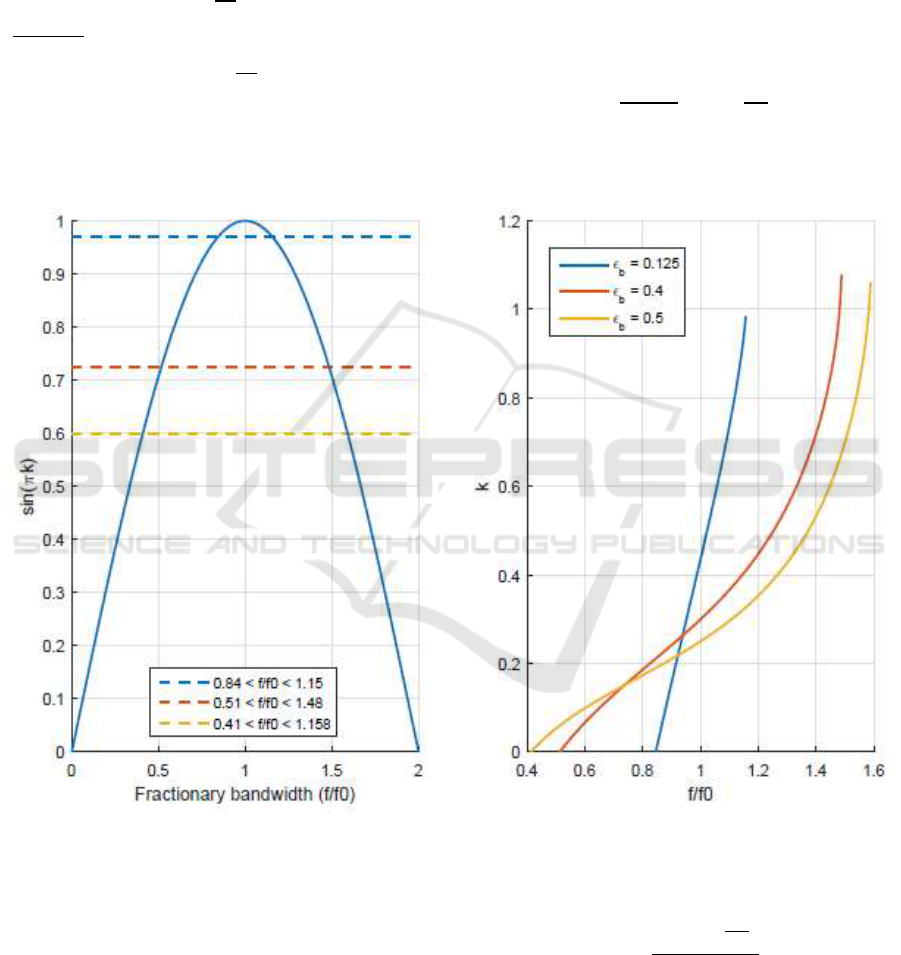
In the work of Gustafsson, Anderson and Fager,
(2013) it was demonstrated how, the eciency in
power back-o (PBO) of a DPA could be improved
and maintained over a wide fractional bandwidth, by
introducing the back-o point εb as a design
parameter. All the control parameters of the device
53
Donati G., Musolff C., Gottardo G., Popp D. and Fischer G.
Physically Inspired Digital Predistortion for Dual Input Doherty Power Amplifiers and Automatic in-Situ Identification.
DOI: 10.5220/0006227100530060
In Proceedings of the Fifth International Conference on Telecommunications and Remote Sensing (ICTRS 2016), pages 53-60
ISBN: 978-989-758-200-4
Copyright
c
2016 by SCITEPRESS – Science and Technology Publications, Lda. All rights reserved
can be expressed as a function of the normalized
drive level ε, in particular the output power is
expressed as:
(1)
where
is the maximum current deliverable by
the MAIN PA, εb < ε < 1, θ is the phase dierence
between MAIN and PEAK amplifier input, f is the
fractional bandwidth and k is the drive level of the
PEAK that sets the eciency bandwidth of the
DPA. In particular, as also demonstrated by the
work of Gustafsson, Anderson and Fager (2013), the
relationship determining the acceptable values for
is:
(2)
.
Figure 1: Dependency of the DPA bandwidth on back off poin choice
Figure 1 is graphically showing how the choice
of
is decisive for determining the eciency
bandwidth. In addition it was presented a closed
formula (Gustafsson, Anderson and Fager, 2013),
for the phase relationship between main and peak
power amplifier (PA), where the dependency on the
fractional bandwidth and the drive level of the
PEAK is exploited (3):
(3)
It is clear that the ability to control the input
signals of the DPA architecture makes it possible to
reach high eciency both at maximum power and
Fifth International Conference on Telecommunications and Remote Sensing
54
PBO, causing a active load modulation that assures
high performance on an extended frequency range.
The theory previously developed by Gustafsson,
Anderson and Fager (2013) states that improving the
eciency bandwidth of the DPA architecture leads
to a degree of freedom in the reconfiguration of the
PA eciency, depending on the particular frequency
where a signal is residing. This is very important for
modern BS where we are continuously dealing with
multistandard signals and scenarios involving
multiband transmission. In Cahuana et al. (2014),
this theory was used to implement a digital power
splitter to get the maximum power eciency out of
the designed DPA
3 REVISION OF THE
IDENTIFICATION PROBLEM
The previous scientific work has opened a lot of
possibilities in terms of reconfiguration and
bandwidth enlargement. Also if the articles in
literature are giving a very good insight of the
problem and deliver a solution, it is still unclear how
to identify the input combinations in a flexible and
automatic way. If we imagine the problem as the
identification of a drive function for the DPA, we
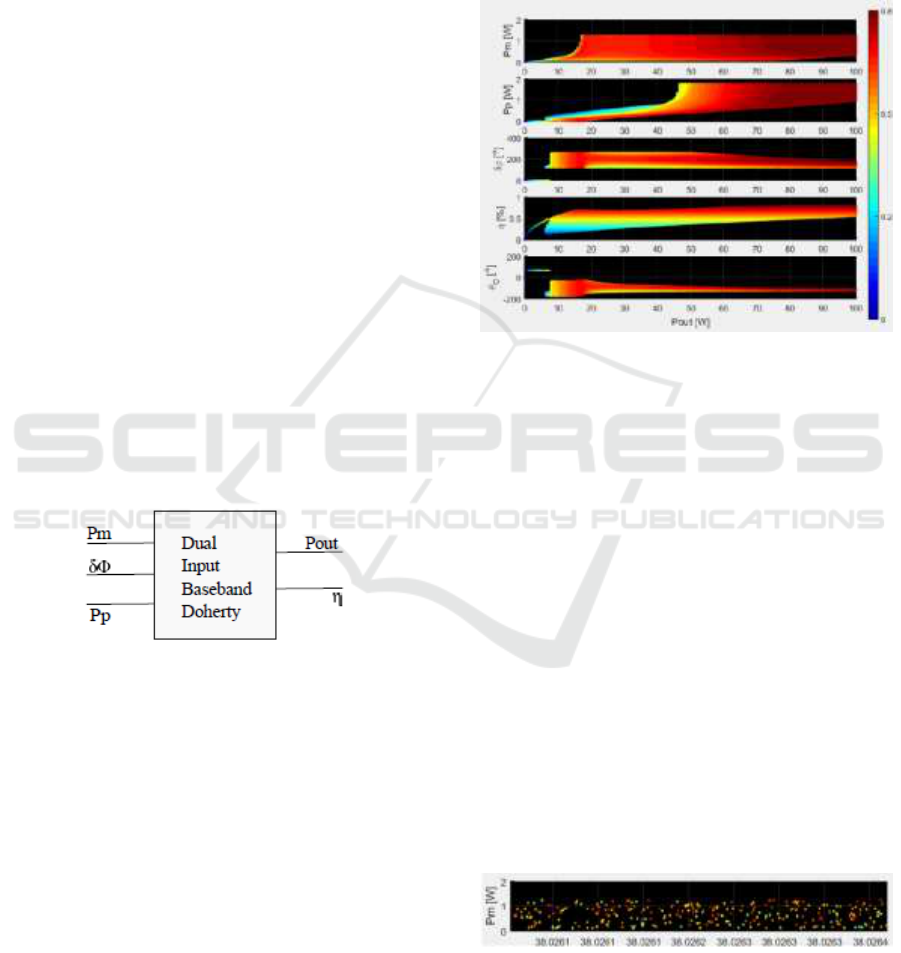
could depict it as the black box (Figure 2):
Figure 2: Block scheme for the identification of a drive
function.
where Pm, Pp and δϕ are respectively the values of
the input powers for MAIN and PEAK amplifier,
and the phase relationship between them. At the
output of the model we have the power and the
power added eciency. Seen in this way, the
identification of a single drive function can be
exploited as a multidimensional optimization
problem. Specifically if we could try all the possible
triplets (Pm, Pp, δϕ), we would end up discovering
that there is a theoretically infinite number of
combinations leading to the same output power. The
challenge relies in identifying the triplets
maximizing the eciency for a specific power level
and frequency. In order to do so performed an
analysis on the model of a dual input DPA with 300
MHz of bandwidth (700 to 1000 MHz) and a
maximum output power of 100 W. A set of
measurements in ADS was obtained by means of
harmonic balance (HB) simulations, performing a
large power sweep over the possible combinations of
the input parameters at four frequency points. The
results of the simulations at 900 MHz are shown in
Figure 3:
Figure 3: Multidimensional identification dataset for drive
function.
where η is the power added eciency and ϕO is the
output absolute phase of the PA. The color is coding
the information about the eciency value assumed
by a specific point, with a resolution of about 2%.
Analyzing the results in figure 3 it becomes obvious
how several combinations of the inputs lead to the
same output power but not to the maximum
eciency. This appears much more evident in the
middle power region. The image was generated by
separating the data into bins in order to reduce
dimensionality of the dataset, which is otherwise
composed of more than 90.000.000.000 points.
Despite the separation into bins the data are quite
dense, so in order to better appreciate the magnitude
of the problem we should zoom in. Figure 4 presents
a closer view of the data. Using dierent triplets we
could generate 38 W at the output of the PA, but in a
very small range around it (4 mW) we could drop
the eciency to 30% or less by choosing a
suboptimal triplet.
Figure 4: Detail of the characterization space for Pm.
In (Cao et al, 2012) an algorithm for the DPD of
dual input power amplifiers was presented. From the
Physically Inspired Digital Predistortion for Dual Input Doherty
Power Amplifiers and Automatic in-Situ Identification
55
developed theory, it turns out that the knowledge of
an optimized signal for the peak power amplifier is
necessary, together with the desired RF output
signal, in order to determine the shape of the
predistorter signal of the main PA. This technique
has an higher complexity than the classic approach,
but because the nonlinear order used was low it was
still considered acceptable. This algorithm shows a
good linearization performance and also tries to
optimize the eciency, but it seems that the
compromise between the two goals avoids obtaining
a very good eciency in PBO.
4 NOVEL LINEARIZATION
APPROACH
We can improve the identification of the digital
static splitter by optimizing it for both eciency and
linearity. Below the compression point the response
of the system is depending only one the behavior of
the MAIN PA. Defining the drive function in the
power domain, we can build a model for the
predistorter of the MAIN branch with a piecewise
lookup table (LUT).
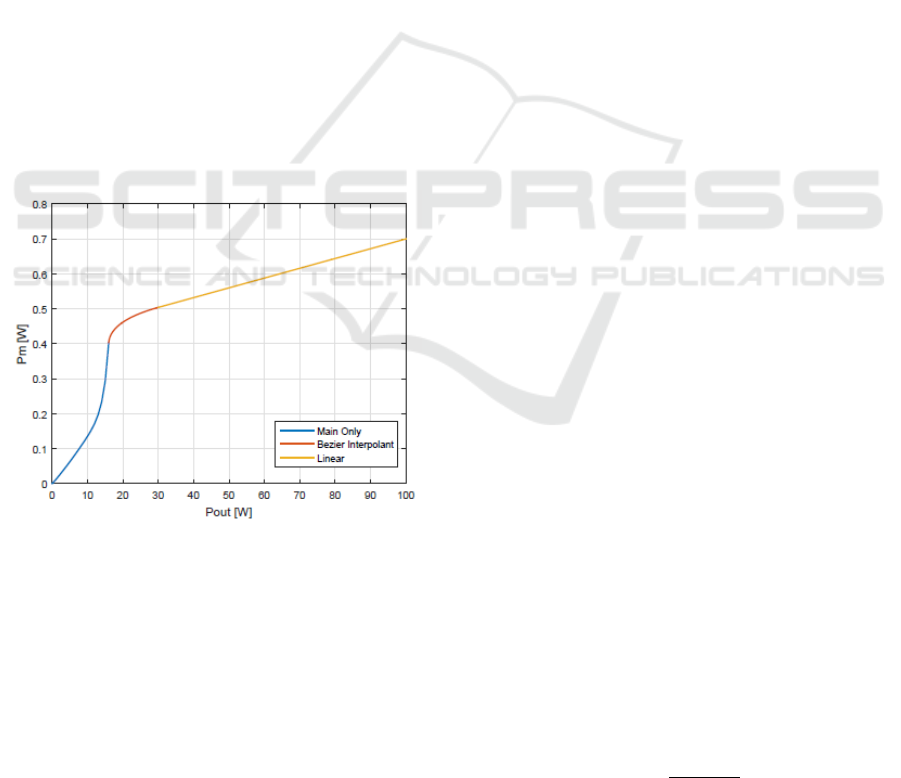
Figure 5: Example of MAIN drive function.
Referring to Figure 5 we have three dierent
sections of the curve. The first one is obtained by
turning the PEAK PA o and sending a power ramp
to the MAIN PA. We can determine its saturation
power and choose the back-o point. Interestingly
we are free to reconfigure the power eciency of the
dual input DPA by moving the back-o point. There
is a trade o between linearity and eciency when
choosing the back-o point. By deciding the
compression point of the MAIN PA we can allow a
certain amount of nonlinear eects included in the
system. The drawback observed is a decrease of the
back-o eciency. The third part of the curve is
linear because we don’t want to generate nonlinear
eects by predistorting.
The two curves could be directly blended but this
would generate problems in terms of bandwidth
expansion of the input signal. The knee between the
the two curves is a discontinuity in the first order
derivative of the function and is responsible for the
generation of very high frequency components in the
spectrum. The bandwidth expansion generates issues
in the signal reconstruction path because the DAC
has a bandwidth limited by its sampling frequency
which is not infinite. By using a Bezier interpolant
(Ping and Guozhao, 2011) to connect the two
curves, we are reducing the nonlinear eects of the
curve and improving the spectral eciency by
introducing G2 continuity at the blending points. By
defining the behavior of the MAIN PA predistorter
we reduce the dimensionality of the identification
problem and we detect the right value of output
power for the DPA in that point. Since we are trying
to linearize the device, we would like to have an
output characteristic which is linear in the amplitude
and possibly constant in phase. Using the
information about the output phase at the back-o
point, we can set a target for the algorithm
performing the identification of the drive functions.
As in Cao et al. (2012), we can define a target output
power (equally spaced power points) with the
condition of constant output phase joined with a
LUT of powers to drive the MAIN PA. The first
main dierence with the work of Ca, is that we are
not introducing any DPD mathematical model, we
are instead using a certain number of supports (for
instance 200) to extract the LUTs used later as
references to interpolate between the values. LUTs
can be considered less performing, especially in
terms of bandwidth expansion, when compared to
polynomials, butit is was already demonstrated
(Barradas et al., 2014) that they can be
reformulated in order to be as ecient as the
polynomial model. In order to identify the missing
predistorter functions, an intelligent algorithm can
be applied. We need to define a cost function and
minimize it in order to find the value of the PEAK
and phase predistorted signals. A good candidate for
such function is the pure error vector module EVM
(not the classic EVM used for constellations), which
can be easily calculated as:
(4)
Fifth International Conference on Telecommunications and Remote Sensing
56

which is expressing the ratio between the error
vector and the original vector. The EVM also
accounts for the output phase, so by minimizing it
we are able to find the correctly aligned output
vector with the wanted power and eciency. It
should be emphasized that the minimization problem
uses a mono dimensional cost function. The
eciency optimization is performed by choosing the
target output phase that we want to maintain at the
PA output. Gradient based algorithms such as the
ones used to train the classic DPD models could be
used to minimize a specific cost function, but they
have experimentally exhibited slow convergence on
this kind of problem. In addition they could
converge to global minima, preventing the discovery
of an absolute minimum. Particle Swarm
Optimization (Kennedy et al., 1995) is a very
attractive algorithm for this sort of application
because it is simple and allows control over the
power range swept at the input of the DPA. PSO is
really useful in a real application in order to avoid
damaging the devices due to wrong drive levels. In
the literature there are already documented uses of
PSO in the field of DPD (Abdelhafiz et al., 2013) for
the computation of the coecients of DPD models.
Here we would use it for identifying the optimum
triplets directly. The idea behind PSO is very simple,
a single particle is described by a set of parameters:
Position (X): described by the decision
variables
Velocity (V): velocity of the particle
during its motion, defines also the direction
of search
Local Best (L): local best met by the
particle, updated each time the local best is
improved during the search
Global Best (G): global best found by the
whole swarm, this information is shared
between all the particles
Each particle is moving in the 2-dimensional space
updating its speed according to the social
interactions with the rest of the swarm. The formulas
to update the velocity and position are expressed as
in 5 and 6.
(5)
(6)
Table 1: PSO algorithm
The coecients appearing in the equation of the
velocity are controlling the ”memory” of the
particles to lead them towards the best solution that
has been found so far. Coecient c1 is controlling
the tendency of the particle to search in the direction
of its own best found solution, while c2 manages the
social interaction of the particle with the rest of the
swarm members to let its position drift towards the
global best found by the whole swarm. The flow of
the optimization algorithm 1 is very simple to
implement and can be adapted to a large range of
problems by performing a proper sensitivity study of
Physically Inspired Digital Predistortion for Dual Input Doherty
Power Amplifiers and Automatic in-Situ Identification
57

the parameters. To make sure that the particle swarm
optimizer does not stop if no convergence is met, a
maximum number of iterations can be established.
This also sets the speed of the algorithm in the worst
case, when no optimum is found or when the cost
function does not reach the expected precision
5 APPLICATION OF PSO TO
STATIC DRIVE FUNCTION
IDENTIFICATION
In our approach, the PSO algorithm described above
was adapted to the problem of the identification of a
single static drive function: Position X is a bi-
dimensional vector made of Pp (expressed in W) and
δΦ (expressed in degrees); a vector for the target
output power is generated by defining 50 equally
spaced values; the target output phase is established
by using the procedure explained in the previous
section.
6 SIMULATION SETUP
In order to prove the concept, a co-simulation
MATLAB/ADS was performed. Signal generation,
baseband signal processing and analysis of the
results were performed in MATLAB while the
whole physical part of the simulation was performed
by ADS which was configured to perform circuit
envelop simulation. The workflow represented in
Figure 6 starts with a MATLAB script generating
the drive function for the MAIN PA with only 50
points, defining the linear power target points and
identifying the back-o point in the same way
described in the previous sections.
Figure 6: Simulation setup interfacing MATLAB and
ADS.
When the algorithm reaches the back-o point it
reads the output phase of the PA and starts the
particle swarm optimizer to sequentially compute
the right pre-distorted phase and power for the peak
PA. Since we want to characterize the static
correction for the DPA, in MATLAB we are
generating constant power points of a duration
which avoids memory eects to be sensed at the
output. It was experimentally seen that the memory
eects of the PA model are visible just up to 300 ns.
For this reason we have set the duration of the power
pulses to 1 µs. The convergence of PSO is improved
by using more particles, but this also means a bigger
number of evaluations and slower results. We used
N = 20 particles as a good compromise between the
simulation time and the precision of the results. To
limit the maximum duration of the simulation we
have set the number of maximum iterations to 50.
The whole simulation takes about:
(7)
Unfortunately such simulation is time consuming
because of the calls to ADS made from MATLAB.
The simulation for one point takes about two
seconds, so the whole duration, in the worst case, is
about 27 hours. The solution is found after less than
10 iterations, so the simulation can be completed in
2 to 5 hours. We expect that by performing the
measurement in-situ using an FPGA system, the
time to measure each point can be reduced to the
limits of memory eects, resulting in a complete
identification of the drive function in 15 ms. This
process can be applied around several carrier
frequencies, creating a raster of drive functions to
obtain a wideband model. This workflow generates a
LUT, which is used to evaluate the results by
running a simulation with an LTE signal. Results are
shown in the next section.
7 RESULTS
We have simulated the identification of the drive
function by setting the carrier frequency to 900
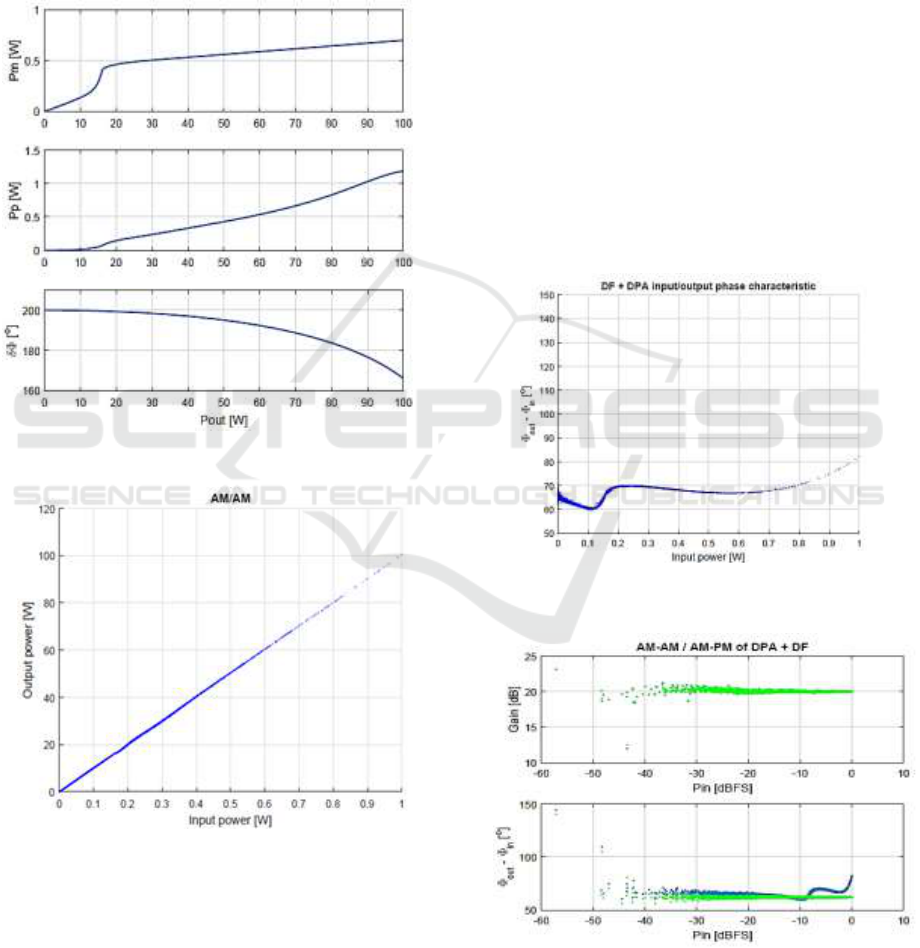
MHz. The identified drive function is shown in
Figure 7.
Looking at the phase relation between MAIN
and PEAK driving signals, we noticed that phase is
ranging from 200 degrees, at low output power, to
166 degrees at the maximum power. There are 34o
Fifth International Conference on Telecommunications and Remote Sensing
58
of total phase variation, which is not a negligible
quantity to account for. This shows the importance
of the relationship between Pp and , which is why
we should choose dual input DPAs for BS operation.
By correctly tweaking Pp we select a specific phase
relationship, at the input of the structure,
maximizing linearity and efficiency for a specific
carrier frequency.
Figure 7: Drive function for the DPA at 900 MHz.
Figure 8: Amplitude Input Output characteristic of
DPA + DF.
Looking at the phase relation between MAIN
and PEAK driving signals, we noticed that phase is
ranging from 200 degrees, at low output power, to
166 degrees at the maximum power. There are 34o
of total phase variation, which is not a negligible
quantity to account for. This shows the importance
of the relationship between Pp and δφ, which is why
we should choose dual input DPAs for BS operation.
By correctly tweaking Pp we select a specific phase
relationship, at the input of the structure,
maximizing linearity and efficiency for a specific
carrier frequency.
Using the drive function to pre-distort the DPA
driven by a 5 MHz LTE signal with a 10 dB PAPR
(no CFR was applied), we obtained a linear output
characteristic (Figure 8), where the dispersion
around the curve is due to the memory of the device.
As we can see in Figure 9, the whole system still
shows a non-linear phase characteristic
This is due to the fact that the identification
process is done on the two separated inputs of the
DPA. When applying a dynamic signal, the splitter
does not account for the phase difference between
the input of the DF and the output of the DPA.
Figure 9: Phase characteristic of DPA + DF
Figure 10: AM-AM and AM-PM characteristic of
DF + DPA after static phase correction
Physically Inspired Digital Predistortion for Dual Input Doherty
Power Amplifiers and Automatic in-Situ Identification
59
Such phase difference can be statically corrected
by a common identification technique. We can see
the effect of the phase linearization in Figure 10.
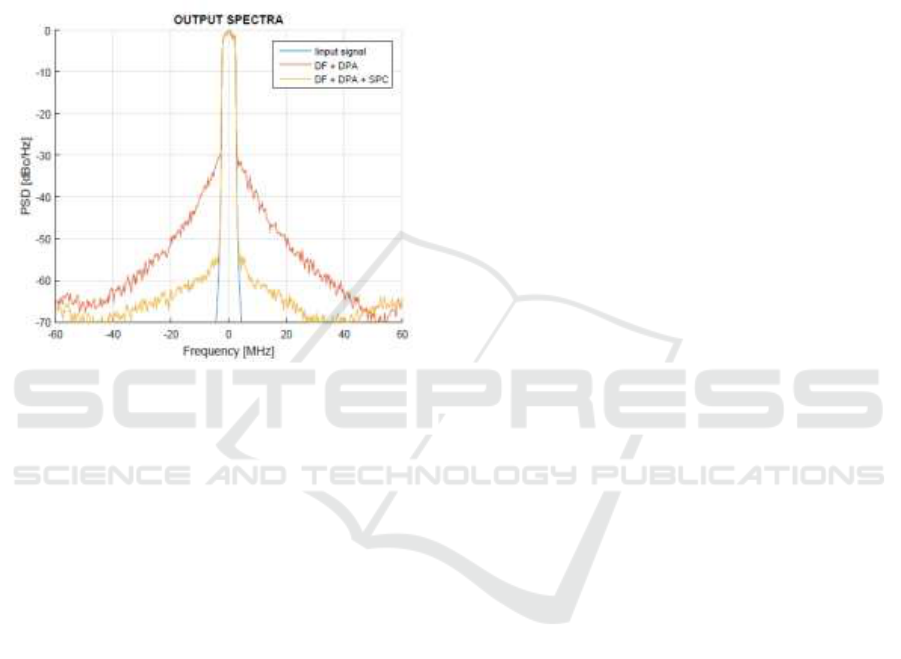
After applying the static phase correction (SPC)
we obtained a drastic improvement of the ACPR,
from 30 to 54 dBc (Figure 11) and an average power
added efficiency of 51:1%.
This represents a very good result, considering
that no CFR was applied to the input signal.
Figure 11: Resulting output spectra
8 CONCLUSIONS
In this article a novel approach for the linearization
of dual input DPAs was presented.
We showed how, taking inspiration from the device
operation, flexible reconfiguration of the efficiency
can be obtained by means of a digital drive function.
In addition to that, we developed an automatic
identification procedure eligible for FPGA
implementation, due to its simplicity.
The algorithm performs an optimization of the
input signals for the device and avoids a multi-object
approach delivering maximum efficiency by keeping
the linearity conditions at its output.
The procedure was validated by making use of a
MALTAB/ADS cosimulation environment and
testing the workflow on a 5 MHz LTE signal with a
10 dB PAPR. Results have demonstrated that very
good performance can be reached without
introducing CFR in the transmit chain.
Therefore this opens a huge number of
possibilities to adapt the performance to the signal's
probability density function and to future multiband
approaches for the linearization of this architecture.
Combined together, the identification of several
drive functions at different frequencies and, novel
techniques for the detection of the instantaneous
frequency of non-stationary signals, can lead to a
new wideband approach to the DPD.
REFERENCES
Gustafsson, D., Andersonn C.M. and Fager, C., 2013, “A
Modified Doherty Power Amplifier With Extended
Bandwidth and Reconfigurable Efficiency”, IEEE
Transactions on Microwave Theory and Techniques,
533-542.
Gustafsson, D., Andersonn C.M. and Fager, C., 2012, “A
Novel Wideband and Reconfigurable High Average
Efficiency Power Amplifier”, Microwave Symposium
Distest (MTT), IEEE MMT-S International, 1-3.
Cahuana, J.C., Landin, P.N., Gustaffson, D. and Fager C.,
2014, “Linearization of Dual Input Doherty Power
Amplifiers”, IEEE Integrated Nonlinear Microwave
and Millimetre-wave Circuits (INMMic), 1-3.
Chao, H., Qureshi, J., Eriksson, Fager, C., and de Vreede
L., 2012, “Digital predistortion for dual-input
Doherty amplifiers“, Power Amplifiers for Wireless
and Radio Applications (PAWR), IEEE Tropical
Conference on, 45-58.
Ping Z., Guozhao, W., 2011, “Non.uniform hyperbolic
blending B-spline curve”, Computer Science and
Automation Engineering (CSAE), IEEE Internation
Conference on, 88-92.
Barradas, F.M., Cuhna, R.T., Lavrador, P.M., Pedro, J.C.,
2014, “Polynomials and LUTs in PA Behavioral
Modeling: A Fair Theoretical Comparison”, IEEE
Transactions on Microwave Theory and Techniques,
3247-2185.
Kennedy, J., Eberhart, R., 1995, “Particle Swarm
Optimization”, Neural Networks, IEEE Internationl
Conference on, 1942-1948.
Abdelhafiz, A.H., Hammi, O., Zerguine, A., Al-Awami,
A.T., Ghannouchi, F.M., 2013, “A PSO Based
Memory Polynomial Predistorter With Embedded
Dimension Estimation”, IEEE Transactions on
Broadcasting, 665-673.
Fifth International Conference on Telecommunications and Remote Sensing
60
