
Design and Implementation of Service Platform for Wheat Nutrition
Diagnosis
Ning Li
1
, Jinyuan Zhang
1
and Zhongliang
Deng
1
1
School of Electronic Engineering, Beijing University Of Posts And Telecommunications, 10 Xitucheng Road, Haidian
District, Beijing, China
{ Ning Li, Jinyuan Zhang } lnmmdsy@sina.com, zjy2223137@163.com
Keywords: Service platform, Data Warehouse models, image processing, nutrition diagnosis model Introduction.
Abstract: For the shortage about research and analysis of wheat farmers for current nutritional status and disease of
wheat, diagnosing the disease of wheat reasonably, nutrition diagnosis system was designed and established
a wheat nutrition diagnosis platform based on image processing. Combined with the needs analysis,
researched the framework design and business processes of wheat nutrition diagnosis system, and designed
a massive data warehouse model with complex data structures based on data management and nutritional
model based on image processing. Furthermore, in connection with the application of the system in
changge, Henan province, the core applications and key technologies of platform during the process of
realization were explored and shared.
1 INTRODUCTION
The traditional wheat crop nutrition analysis and
disease diagnosis mainly rely on manual visual way
and agricultural experts attending the seminar, but
because of the variability of the environment and the
diversity of growth in different stages of crop,
leading to the deviations between diagnosis results
and the actual growth of wheat. On the other hand,
due to technical or expert personnel cannot arrive to
the farmland timely and missed the best time of
diagnosis, expert consultation revealed timeliness
defects. And with the development and innovation
of information industry and the technology, we can
solve these problems by means of image processing
and pattern recognition techniques. Therefore, we
hope to build image recognition and image
processing systems for real-time diagnosis of the
nutritional status of wheat crop, which makes wheat
nutritional management more scientific and
standardized.
In recent years, various agricultural expert system
based on nutrition diagnosis sprang up and has
reached a mature stage. The international
community has the majority of agricultural expert
systems are widely used for aspects of crop
production management, pest and disease diagnosis
and so on ( Wali, Emal; Datta, Avishek; Shrestha,
Rajendra P, 2016, Reckling, Moritz; Hecker, Jens-
Martin; Goeran, 2016). Development of Chinese
agricultural expert system is also in a period of rapid
development, has established a plant protection
expert systems, pest control expert systems, and has
been widely used (Yin Xiaogang; Wang Meng,
2016, Takashi Ohnishi; Yuka Nakamura, 2016).
Although the agricultural expert system has been a
maturing stage, the situation on the monitoring of
crop nutrition expert systems is mostly for
forecasting and diagnosis of pest crop, which is
useless for this crop nutrients with normal growth.
Therefore, for a large field wheat crop growing
normally, we use database model and image
processing technology, developing a nutrition
diagnostic service platform for farmers timely access
to the daily wheat growth status information.
2 PLATFORM GENERAL
DESIGN
According to the different developmental stages of
wheat growth characteristics, combined with lessons
learned and wheat nutrition diagnosis disease cases,
and the impact of field weather environmental
factors, the wheat nutrition diagnosis service system
is established, the process design shown in Figure 1.
283
Deng Z., Li N. and Zhang J.
Design and Implementation of Service Platform for Wheat Nutrition Diagnosis.
DOI: 10.5220/0006449102830288
In ISME 2016 - Information Science and Management Engineering IV (ISME 2016), pages 283-288
ISBN: 978-989-758-208-0
Copyright
c
2016 by SCITEPRESS – Science and Technology Publications, Lda. All rights reserved
283
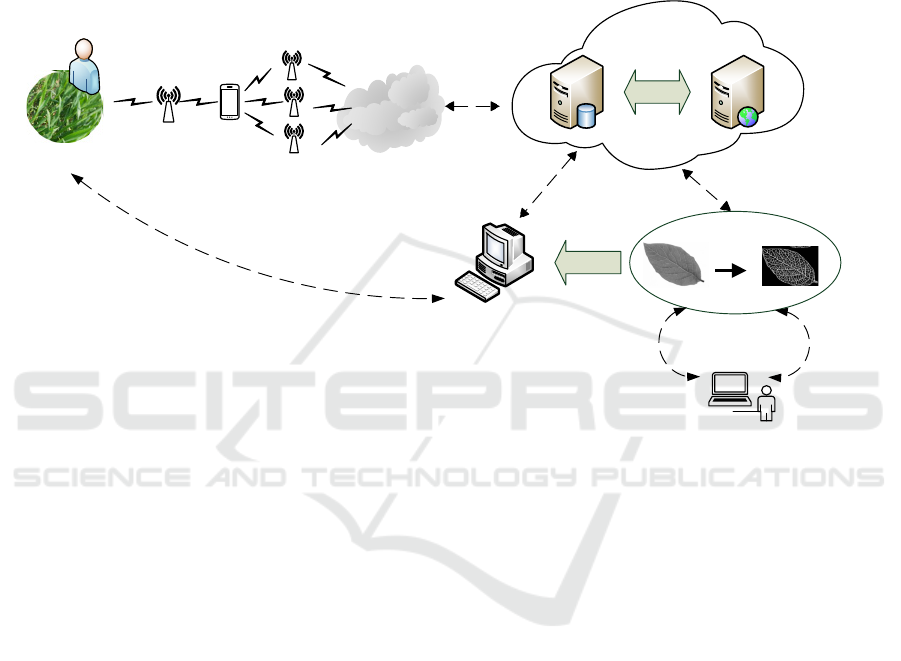
The system can obtain the image of wheat in each
period by means of mobile collection device, and
the collected moisture and image data is transmitted
over the network to a remote database server for
centralized storage and management of data
classification. Administrators issued request through
the Web server to the database to obtain the
collected wheat image data, with image processing
technology nested to the wheat nutrition model,
access to information on the nutritional status of
wheat leaves taken, in accordance with relevant
knowledge and expertise nutrition diagnostic
techniques, diagnostic recommendations are given
symptomatic uploaded to the system home page for
reference and learning.
4G
farmland
Bluetooth
Taking
Pictures
data
transmission
Web service
Image
proceing
Wheat nutrition
model
Display results
feedback
Upload
and
download
Figure 1: Process of design platform..
3 PLATFORM ARCHITECTURE
DESIGN
According to the platform position and social
function, considering the current status of wheat
nutrition analysis and diagnosis, the overall logical
architecture is divided into data service layer, the
system support layer and the business application
layer (Paradiso, Sean P; Delaney; Kris T, 2016).
i. data service layer
Data services layer achieves the main data
collection, classification, storage and centralized
provisioning. The system data services layer mainly
consists of collection data, storage services data and
application service data, which will feedback to the
system user by the form of a form, line chart or mail
to the system user.
ii. system support layer
System support layer polymerizes the
dispersed, heterogeneous application and
information resources through a unified access entry,
to achieve various types of data resources and a
variety of applications across databases and systems
with seamless access and integration (Donatas;
Aviža;Zenonas; Turskis, 2015). The system support
layer mainly refers to safeguard and share common
components of data and provide standardized
management, including data storage and
transmission, user information and administrator
rights management, refresh and deploy storage data .
iii. business application layer
Business application layer mainly refers to help
user registering wheat nutrition diagnostic services
platform to perform operations and implement the
corresponding function. Farmers and grain dealers
can check the growth of wheat and nutrition analysis
results within a certain time, what they acquire as a
ISME 2016 - Information Science and Management Engineering IV
284
ISME 2016 - International Conference on Information System and Management Engineering
284

reference to adopt measures correlatively.
Administrators need to go through the certification
authority into the system management interface,
giving a feedback to the user based on the current
wheat nutrition diagnosis information, to improve
the efficiency of the system.
4 PLATFORM FUNCTIONAL
MODELING
4.1 Data Warehouse Modeling
Currently data warehouse modeling methods used
commonly are paradigm modeling and dimensional
modeling method. The paradigm modeling is mainly
used in the data storage for relational database, and
the modeling process is relatively simple. Compared
with paradigm modeling, the data can be processed
more efficiently in dimensional modeling, which
method mainly used to solve the performance issues
of modeling process. However, these modeling
methods are mostly used for traditional structured
data and unstructured data with simple construction,
but there is a complex multi-dimensional
relationship between the data and image information
of system, which contribute to the results of using a
conventional methods to establish regular contact
will become bloated and inefficient, and data
processing result will be too dependent on data
structure relationships (L. Jiang; J. Xu; B. Xu,
2011).
Based on the analysis of different types of
unstructured data, combined with user needs and
experience, propose a complex unstructured data for
mass data model structure. The system platform data
modeling process is divided into four steps: business
modeling phase, the concept of domain modeling
phase, the logical modeling phase and the physical
modeling phase, concrete steps are as follows:
• business modeling phase
Combined with business needs the business
modeling phase can divides into four main blocks,
including: user information, image acquisition,
images processing and nutrition business model.
According to the nature of the business, every
division within each business module must
determine the business topics and establish the
appropriate contact, as a basis for analysis of the
entire business processes and functions.
• concept of domain modeling phase
In the establishment of business processes,
substantializing the abstract business sub-module
with complex structure and sub-structure
relationships to concrete elements of the system and
its internal relations, adopt relational model to
express the attribute information of unstructured
data. Furthermore, two-dimensional table structure
of relational model by adding the extended relational
model to express complex structure of unstructured
data, use object-oriented model to express the
unstructured data (G. Bavota, 2016). Combined with
the business needs, the system abstract the specific
business template to basic elements, handle events,
process results and descriptions. The basic elements
include user information, weather, address, soil and
other basic information; event processing refers to
the various elements collected for processing and
integration; process result incorporate nutrition
diagnosis results and recommendations; descriptions
contain the various indicators and wheat growth
period introduction.
• logical modeling phase
Having established the relevance of each abstract
entities, adhering the attachment into system during
establishing process for data identification is needed
(Tsou; Ming Cheng, 2016). Such as handling events
for wheat image, also need to get their image
numbers, acquisition time, collecting location,
upload time and other basic information. After
improving the basic attributes of the entities, should
find out the relationship between the contact and
abstract event abstract entities, and make
explanation for which will complete the whole
concept model series into an organic entity, and fully
express service between associations.
• physical modeling phase
Physical modeling stage aim to incarnate the content
of the logical model within implementation of
concrete on physical media. Wheat nutrition
diagnosis services platform adopts B/S structure,
using MYSQL database to store the collected data.
For business needs, the collected information and
related properties of wheat image stored in the
database with categorized, and generated the
appropriate fact tables, dimension tables, and line
charts on the Web side. In addition, the maintenance
chart is established for database metadata and real-
time feedback needs, and refresh the uploaded data
timely to ensure smooth and safe operation of the
system.
The database modeling design shown in Figure 2.
Design and Implementation of Service Platform for Wheat Nutrition Diagnosis
285
Design and Implementation of Service Platform for Wheat Nutrition Diagnosis
285
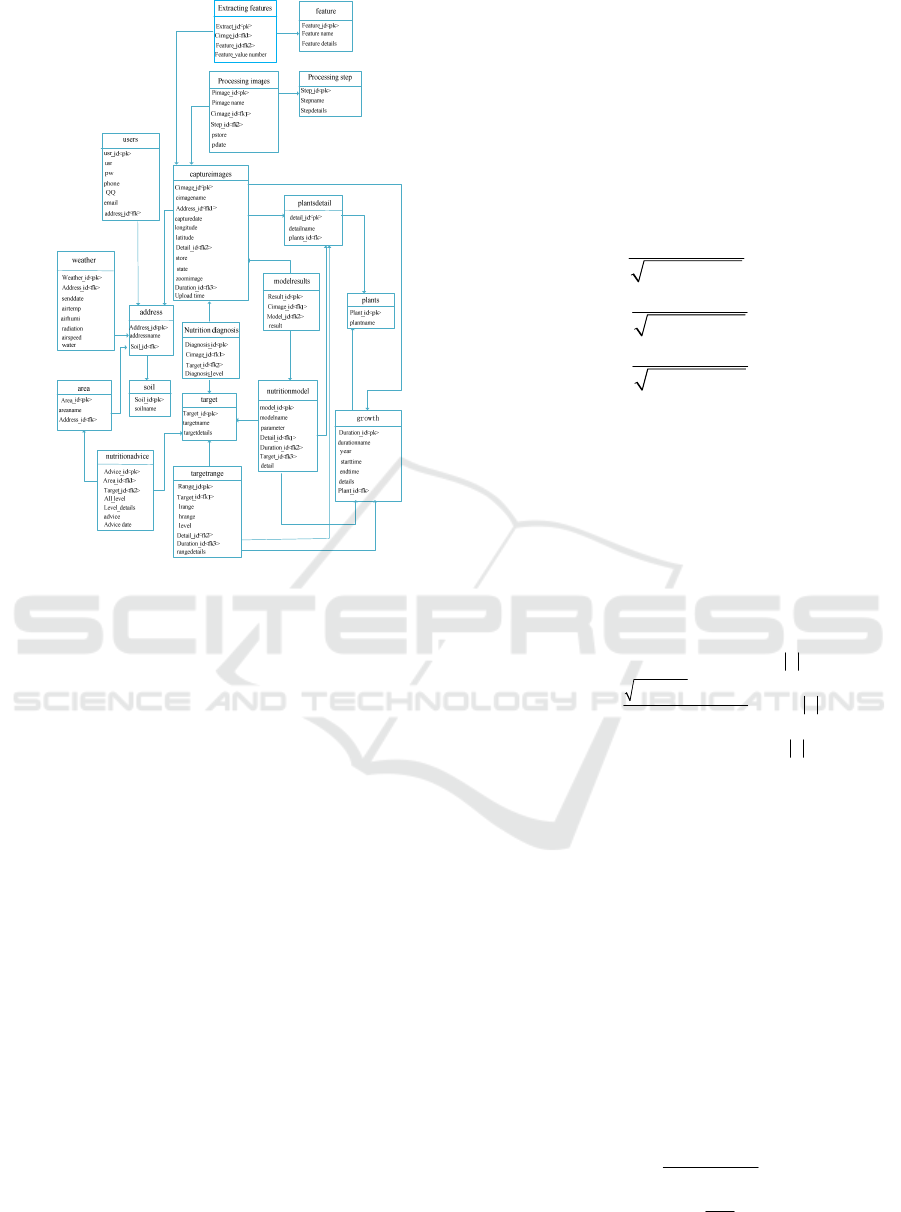
Figure 2: Data warehouse model design
4.2 Wheat nutrition model
Wheat leaf color and leaf shape not only visually
reflecting its chlorophyll content, but also can show
nitrogen metabolism in the body, therefore, the
image of Plant canopy is closely related to the
growth characteristics, the Contracts of light
function and nitrogen nutrition status (Y. q. Qi,
2013). This system is through image analysis of
chlorophyll content and leaf nitrogen content of
wheat, in order to determine the nutritional status of
wheat crops.
Full coverage sampling for wheat crop during
jointing stage, take photos for wheat and get image
the same day, moreover, measured the amount of
dry matter of leaf stem, the leaf nitrogen content
LNC and the values of chlorophyll content. In this
study, choose white paper as the background, in
order to achieve image segmentation of leaf and
background using RGB image setting Thresholds.
After the completion of image segmentation using
RGB and HSV color model to describe nitrogen
status of wheat, calculated hue (H, Hue), lightness
(V, Value), saturation (S, saturation) and dark green
index (DGCI, dark green Color index) using the
average gray hue of all the pixels on the blade RGB
channel (P. Wuttisarnwattana, 2016).
The main processing steps are as follows:
1) To overcome the impact of changes in light and
shadow on the part of the image, take
normalization process for wheat canopy image.
In this paper, an improved normalization
method is proposed, and the results are more
scientific and reasonable, formula is shown as
follows:
222
222
222
r =
++
g =
++
b =
++
R
RGB
G
RGB
B
RGB
⎧
⎪
⎪
⎪
⎪
⎨
⎪
⎪
⎪
⎪
⎩
(4-1)
2) Binarization, denoising and morphological
opening operation processing were adopted for
the object images. Denoising method used
adaptive wavelet threshold model, which
combines the traditional advantages of wavelet
thresholding, while adopting adaptive processing
for high-frequency wavelet decomposition
coefficients of different amplitude on the basis of
wavelet decomposition level (Sushanth, 2011,
Xiao Qian; Ge Gang, 2016). Denoising model
formula is:
()
()
()
()
1
2
1
12
1
2
2ln 1 2
t
2
0
n
n
t
ij
s
ign t
t
ωω
ωωω ω
ω
−
−
⎧
⋅≥
⎪
⎧⎫
⎪
⋅+
⎪⎪ ⎪
=
⋅− <<
⎨⎨ ⎬
⎪⎪ ⎪
⎩⎭
⎪
<
⎪
⎩
(4-2)
Where
ω
denotes the amplitude wavelet
coefficients, i, j denotes the image size,
1
t and
2
t
denotes the thresholds, n denotes wavelet decom-
position level.
3) Use the Fuzzy C-means algorithm for image
segmentation, the objective function is:
22
11
CN
FCM
ij ij
ij
Eud
==
=
∑∑
(4-3)
Where C denotes the number of clusters, N denotes
the number of pixels in the image,
ij
d denotes the
gray distance,
ij
u denotes the fuzzy membership for
j
x
to
i
v , where
i
v denotes the cluster center of
number I, the Formula is shown as follows:
2
1
1
ij
C
ij
k
kj
u
d
d
=
=
⎛⎞
⎜⎟
⎜⎟
⎝⎠
∑
(4-4)
ISME 2016 - Information Science and Management Engineering IV
286
ISME 2016 - International Conference on Information System and Management Engineering
286
After extracting the wheat based color
characteristic, fitted with the same period of leaf
nitrogen content in linear, tuning and determine the
best-fit coefficients of three primary components,
and determine the normalized color mix index under
the RGB space (C. W. Lin, 2014). Through corre-
lation analysis with NCMI, wheat leaf nitrogen
concentration and chlorophyll content, demonstrate
the nutrition diagnosis results based on wheat image
processing.
5 PLATFORM REALIZATION
Wheat nutrition diagnostic services platform utilize
the incremental development approach, set up the
database and nutritional analysis platform based on
collected wheat moisture and image data, and enrich
the data of database with demand. Firstly, we must
continue to improve the existing forms of
distribution data in the data warehouse according to
user needs. Moreover, it is necessary to continue to
add moisture and image information of the
respective growth stages of wheat late to the
platform, formatting the new data marts and
statistics.
The system adopts web Services as the core
technology of application platform and information
services resources integration, using MVC and
Struts + Hibernate + Spring as the standard
architecture. Interface performance uses html + css +
JS as design framework, mainly utilizing PHP as a
carrier to reflect the design concept, meanwhile
reduce the interdependence of technology in internal
internet system as far as possible ( R. Sethuraman,
2016). The database platform store personalized
management (authentication and rights of manage-
ment, navigation, and retrieval), user behaviour log
and system administration files. Server database is
used to store wheat moisture data and image
information, achieve data uploading and
management implemented in the MYSQL database
management system. In addition, the system
management module is designed to provide a
platform for the service module, management and
maintenance of the database data platform to ensure
the smooth and efficient operation of the system.
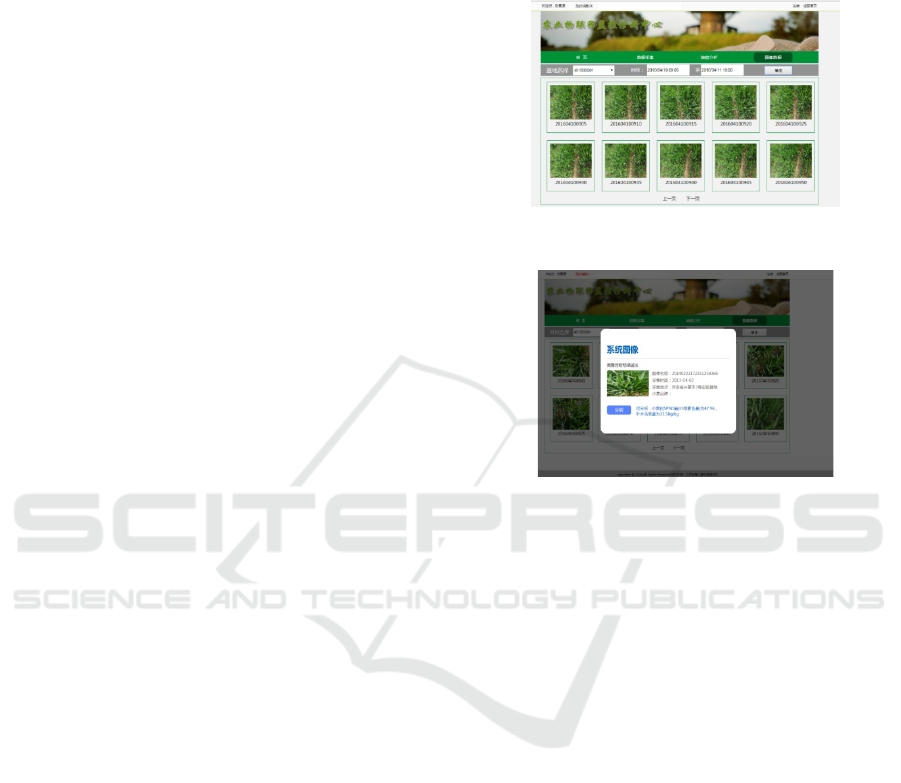
The primary interface of wheat nutrition
diagnostic services platform shown in Figures 3 and
4. Figures 3 shows the wheat image information,
users select the time and location information from
drop-down box to view the corresponding conditions
of wheat growing image. Figure 4 displays the
nutritional diagnosis result after the image
processing for selecting the wheat images, which
analyzes the nutritional status judged by the content
of chlorophyll and leaf nitrogen content of wheat.
Figure 3: Wheat picture selection screen
Figure 4: Wheat nutrition diagnosis interface
6 CONCLUSIONS
In this paper, the service platform for the wheat crop
nutrition diagnosis and analysis at different
developmental stages is established, with the method
of rigorous architecture design and modeling
analysis, and the platform design and image
processing technology as the support. Through
rigorous scientific methods and experience in
agriculture proposed ways of Wheat Nutrition
Diagnosis and put service platform into effect for the
majority of farmers to use and reference. The system
can meet the application requirements for farmers’
judgment of growth of wheat in Plains, providing
guidance for agricultural production, which is
important for modern agricultural information
management.
ACKNOWLEDGMENT
This work was supported by the Integration and
Application of Information Service in the Main
Stages of Grain Production (National “12th Five-
Design and Implementation of Service Platform for Wheat Nutrition Diagnosis
287
Design and Implementation of Service Platform for Wheat Nutrition Diagnosis
287

Year” science and technology support plan) of China
under Grant No.2014BAD10B06.We thank Li Ning,
Deng Zhongliang, Zhang Qi and Gu Yunxia
comments and suggestions, which helped improve
the overall quality of this work.
REFERENCES
C. W. Lin, K. F. Hsu and J. M. Hwang, "Specific lighting
spectrum matching by normalized correlation
coefficient and generalized reduced gradient
method," 2014 9th International Microsystems,
Packaging, Assembly and Circuits Technology
Conference (IMPACT), Taipei, 2014, pp. 470-472.
Donatas Aviža,Zenonas Turskis,Artūras Kaklauskas. A
Multiple criteria decision support system for analyzing
the correlation between the thickness of a thermo-
insulation layer and its payback period of the external
wall [J]. Journal of Civil Engineering and
Management, 2015, 216.
G. Bavota, "Mining Unstructured Data in Software
Repositories: Current and Future Trends," 2016 IEEE
23rd International Conference on Software Analysis,
Evolution, and Reengineering (SANER), Suita, 2016,
pp. 1-12.
L. Jiang, J. Xu, B. Xu and H. Cai, "An automatic method
of data warehouses multi-dimension modeling for
distributed information systems," Computer Supported
Cooperative Work in Design (CSCWD), 2011 15th
International Conference on, Lausanne, 2011, pp. 9-
16.
Paradiso, Sean P.; Delaney, Kris T.; Fredrickson, Glenn H,
“Swarm Intelligence Platform for Multiblock Polymer
Inverse Formulation Design”, ACS MACRO
LETTERS, 2016, 5(8):972-976.
P. Wuttisarnwattana, "Automatic whole mouse
segmentation for cryo-imaging data using DRLSE
model," 2016 13th International Conference on
Electrical Engineering/Electronics, Computer,
Telecommunications and Information Technology
(ECTI-CON), Chiang Mai, Thailand, 2016, pp. 1-5.
R. Sethuraman, P. Hema and R. G. Priya, "Semantic web
services based implementation of home appliances
into ZigBee coordinators network," 2016 Second
International Conference on Science Technology
Engineering and Management (ICONSTEM),
Chennai, India, 2016, pp. 130-134.
Reckling, Moritz; Hecker, Jens-Martin; Bergkvist,
Goeran, “A cropping system assessment framework-
Evaluating effects of introducing legumes into crop
rotations” J. EUROPEAN JOURNAL OF
AGRONOMY ,2016,76: 186-197.
Sathyanarayana, Sushanth; Akopian, David; Agaian, Sos,
“An Adaptive LMS Technique for Wavelet
Polynomial Threshold Denoising”, Proceedings of
SPIE, 2011.
Takashi Ohnishi,Yuka Nakamura,Toru Tanaka,Takuya
Tanaka, Noriaki Hashimoto, Hideaki Haneishi,Jennie
Taylor,Matija Snuderl, Yukako Yagi. “Deformable
image registration between pathological images and
MR image via an optical macro image” J. Pathology -
Research and Practice, 2016.
Tsou, Ming-Cheng, “Online analysis process on
Automatic Identification System data warehouse for
application in vessel traffic service”, Proceedings of
the Institution of Mechani-Cal Engineers Part M-
Journal of Engineering for the Maritime Environment,
2016,230(1):199-215.
Wali, Emal; Datta, Avishek; Shrestha, Rajendra P ,
“Development of a land suitability model for saffron
(Crocus sativus L.) cultivation in Khost Province of
Afghanistan using GIS and AHP techniques” J .
ARCHIVES OF AGRONOMY AND SOIL
SCIENCE, 2016, 62 ( 7 ) : 921- 934.J. Clerk
Maxwell, A Treatise on Electricity and Magnetism,
3rd ed., vol. 2. Oxford: Clarendon, 1892, pp.68–73.
Xiao Qian; Ge Gang; Wang Jianhui, “The Neural Network
Adaptive Filter Model Based on Wavelet Transform”,
HIS 2009: 2009 Ninth International Conference on
Hybrid Intelligent Systems, Vol 1, Proceedings,
2016:529-534.
Y. q. Qi, Z. y. Duan and X. Lv, "Research of cotton
canopy characteristic information by hyperspectral
remote sensing data," Computer Science & Education
(ICCSE), 2013 8th International Conference on,
Colombo, 2013, pp. 892-896.
Yin, Xiaogang, Olesen, Jorgen E., Wang, Meng, “Impacts
and adaptation of the cropping systems to climate
change in the Northeast Farming Region of China” J.
European Journal of Agronom, 2016, 78:60-72.
ISME 2016 - Information Science and Management Engineering IV
288
ISME 2016 - International Conference on Information System and Management Engineering
288
