
Analysis of Regionlets for Pedestrian Detection
Niels Ole Salscheider
1
, Eike Rehder
2
and Martin Lauer
2
1
FZI Forschungszentrum Informatik at Karlsruhe Institute of Technology (KIT), 76131 Karlsruhe, Germany
2
Department of Measurement and Control (MRT), Karlsruhe Institute of Technology (KIT), 76131 Karlsruhe, Germany
salscheider@fzi.de, eike.rehder@kit.edu, martin.lauer@kit.edu
Keywords:
Pedestrian Detection, Regionlets, Perception.
Abstract:
Human detection in camera images is an important task for many autonomous robots as well as automated
driving systems. The Regionlets detector was one of the best-performing approaches for pedestrian detection
on the KITTI dataset when we started this work in 2015.
We analysed the Regionlets detector and its performance. This paper discusses the improvements in accuracy
that were achieved by the different ideas of the Regionlets detector. It also analyses what the boosting algo-
rithm learns and how this relates to the expectations.
We found that the random generation of regionlet configurations can be replaced by a regular grid of region-
lets. Doing so reduces the dimensionality of the feature space drastically but does not decrease detection
performance. This translates into a decrease in memory consumption and computing time during training.
1 INTRODUCTION
Many autonomous robots as well as automated driv-
ing systems require an accurate and fast pedestrian
detector. Such systems can only avoid collisions if
the locations of all pedestrians can be determined pre-
cisely.
Even though there are very reliable techniques for
face detection, pedestrian detection from camera im-
ages remains a challenging problem. This is because
the body of a pedestrian is deformable and the rela-
tive positions of body parts can vary to some degree.
In contrast, faces are mostly rigid.
Another challenge is that pedestrians can be seen
from arbitrary angles in road scenes. This problem
requires either an ensemble of different detectors for
the different viewing angles or an approach that can
cope with the difference in appearance.
Earlier approaches to solve these tasks include
Deformable Part Models (DPM) (Felzenszwalb et al.,
2008) and Bag of Words (BoW) (Vogel and Schiele,
2007) models. Both methods can handle some de-
gree of deformation by breaking objects into parts.
DPM learns a root filter for the complete object and
filters for all object parts. For detection, an exhaus-
tive search for all of these filters is performed. DPM
also learns latent variables to describe the relative lo-
cations of these parts. These are used to calculate the
final detection score.
BoW methods extract features from image patches
and cluster the extracted features to determine the
words in the codebook. Then a histogram over the
occurrence of these words is calculated and used as
input for a classifier. In contrast to DPM, BoW meth-
ods ignore the spatial relationships between the im-
age patches. This makes the detector insensitive to
deformation but a precise localisation of the object is
difficult.
A newer approach that also tries to break objects
into parts is Regionlets (Wang et al., 2013). It was
one of the best-performing techniques for pedestrian
detection on the KITTI dataset (Geiger et al., 2012)
when we started this work in 2015. During training,
this approach generates a large number of regions that
cover the complete detection window. A boosting al-
gorithm is used to learn which regions are relevant for
the classification problem. The idea behind this is that
an object can be decomposed into parts and each se-
lected region corresponds to the area in which such a
part can be observed. When the number of generated
regions is large enough it is likely that the generated
set also contains regions that are close to optimal.
Each region is divided into regionlets. Classic
features are extracted from each regionlet and max-
pooling is performed on all feature vectors extracted
in a region. This allows the object part to occur in
any regionlet of the region and makes the detector ro-
bust to local deformations. Again, the most relevant
26
Salscheider, N., Rehder, E. and Lauer, M.
Analysis of Regionlets for Pedestrian Detection.
DOI: 10.5220/0006094100260032
In Proceedings of the 6th International Conference on Pattern Recognition Applications and Methods (ICPRAM 2017), pages 26-32
ISBN: 978-989-758-222-6
Copyright
c
2017 by SCITEPRESS – Science and Technology Publications, Lda. All rights reserved

regionlet configurations for each region are chosen by
the boosting algorithm from a large number of ran-
domly generated configurations.
The authors of (Wang et al., 2013) give a thorough
evaluation of the overall detection performance on
different datasets in comparison to other well-known
approaches. However, the original paper does not
contain a break-down of the contributions of the in-
dividual ideas. Also, many implementation details
are omitted. This leads to the questions why Region-
lets achieve good performance and which of the ideas
work well.
We analysed the Regionlets approach and the con-
tributions of the individual ideas to the overall im-
provement in detection performance. Also, we ex-
amined what the boosting classifier learned and how
that compares to the expectations given by the design
ideas.
We could reduce the memory consumption and
computation time during training considerably by re-
placing the randomly generated regionlet configura-
tions by a regular grid of regionlets. Our proposed
stereo image based candidate bounding box selection
needs little computation time and reduces the number
of detector windows that have to be evaluated by a
factor of 3 to 5.
The remainder of this paper is laid out as follows:
In Section 2, the Regionlets approach is described in
detail. Then, our experiments and an analysis of the
approach is presented in Section 3. Finally, a conclu-
sion is drawn in Section 4.
2 REGIONLETS
The task of object detection in images can be broken
into two sub-tasks. The first is to determine the loca-
tions of objects in the image. Then, the class of these
objects is determined by a classifier in order to decide
if they are of interest.
A possible solution to the first sub-problem is the
sliding window approach that performs an exhaustive
search of all possible locations and sizes. In the Re-
gionlets approach, however, these candidate bound-
ing box proposals are generated by selective search
(van de Sande et al., 2011). This reduces the number
of candidate bounding boxes that have to be evaluated
to around 1 000-2 000 per image while still achieving
high recall.
The main contribution of the Regionlets approach
is a new descriptor that is calculated for the candidate
bounding boxes. This descriptor contains information
about different scales of the image and is insensitive
to deformation. The former is achieved by calculating
features of regions with different sizes while the latter
is achieved by max-pooling.
The resulting feature vector has a very high di-
mensionality. Therefore, the authors use a cascaded
boosting classifier to select only the most discrimina-
tive features.
2.1 The Regionlets Descriptor
Most objects can be divided into parts. A pedestrian,
for example, might be broken down into the head, the
upper body, arms and legs. Usually, the likelihood
of such a part to appear at a specific position inside
the bounding box of the object is not uniformly dis-
tributed. Instead, for each part there is a region rela-
tive to the bounding box that covers (nearly) all pos-
sible locations of that part.
The Regionlets descriptor is based on this idea. A
large number of regions with different sizes and dif-
ferent positions is generated in a sliding window fash-
ion. The feature vector for each candidate bounding
box is then calculated by concatenating the feature
vectors of all regions. It is then up to the boosting
classifier to select the relevant regions.
In each region, there are multiple sub-regions
called regionlets that describe a possible location of
the object part in the region. A fixed set of region-
lets in a region is called a regionlet configuration. In
(Wang et al., 2013), regionlet configurations are gen-
erated randomly. First, the size for all regionlets in
a configuration is fixed randomly and then a random
number of regionlets with this size is positioned ran-
domly in the region.
The feature vector of each regionlet configuration
is calculated by performing max-pooling over all fea-
ture vectors of all regionlets in this configuration. The
idea behind this is that it does not matter in which re-
gionlet the object part is, but only whether it is in (at
least) one of them or not. The feature vector of a re-
gion is the concatenation of the feature vectors of all
regionlet configurations of this region. Again, it is up
to the boosting classifier to select the relevant region-
let configurations for each region.
Finally, the feature vector of each regionlet is the
concatenation of classic appearance features extracted
from the image patch corresponding to the region-
let. These appearance features can for example be
the HOG (Dalal and Triggs, 2005) and LBP (Ahonen
et al., 2004) descriptors.
2.2 The Boosting Classifier
Because of the large number of regions and the ran-
domly generated regionlet configurations, the feature
Analysis of Regionlets for Pedestrian Detection
27
space is of very high dimensionality. In (Wang et al.,
2013), about 100 million real-valued feature proto-
types are generated for training.
RealBoost (Schapire and Singer, 1999) is used to
train a classifier cascade for the object detector. This
allows to only select relevant features and to reject
candidate bounding boxes that do not contain a rele-
vant object early.
The weak learners for the boosting cascades are
lookup tables similar to (Huang et al., 2004). They
are mathematically defined as
h(x) =
n−1
∑
o=1
v
o
1(B(x) = o) , (1)
where n is the number of bins, v
o
is the table entry at
the oth position and 1 is an indicator function. B(x)
maps the input x to a table entry and is usually chosen
in a way so that the expected range of x is uniformly
distributed to the bins.
During training, the features are first sorted by the
Bhattacharyya distance of the posterior probability of
positive and that of negative samples. Then, a feature
is iteratively selected and a weak learner is trained for
it. In each step, all v
o
in the lookup table of the weak
learner are chosen as v
o
=
1
2
ln
U
+
o
U
−
o
. Here U
+
o
is the
sum of weights of all positive training samples that
fall into the oth bin and U
−
o
is the sum of weights
of all negative samples in that bin. In each step, the
weights of the wrongly classified training examples
are increased and the weights of the correctly classi-
fied training examples are decreased.
The classification output of the learnt strong
classifier for a feature vector f is then given by
sign(
∑
i
h
i
( f
i
)).
3 ANALYSIS & EXPERIMENTS
We analysed the Regionlets approach and which in-
fluence the different ideas from (Wang et al., 2013)
have.
In our implementation, we chose HOG and LBP
features as basic appearance features for each region-
let. For HOG, we use 9 equally spaced orientation
bins for the unsigned gradient direction. Each region-
let contains one block that is divided into 2 × 2 cells.
The block feature vector is normalised by its L2 norm.
Our LBP descriptor considers 8 neighbours with a ra-
dius of one. Again, each regionlet contains one block
and the corresponding feature vector is normalised by
its L1 norm.
We use RealBoost to train a cascade classifier.
Our weak learner is a lookup table with 4 entries that
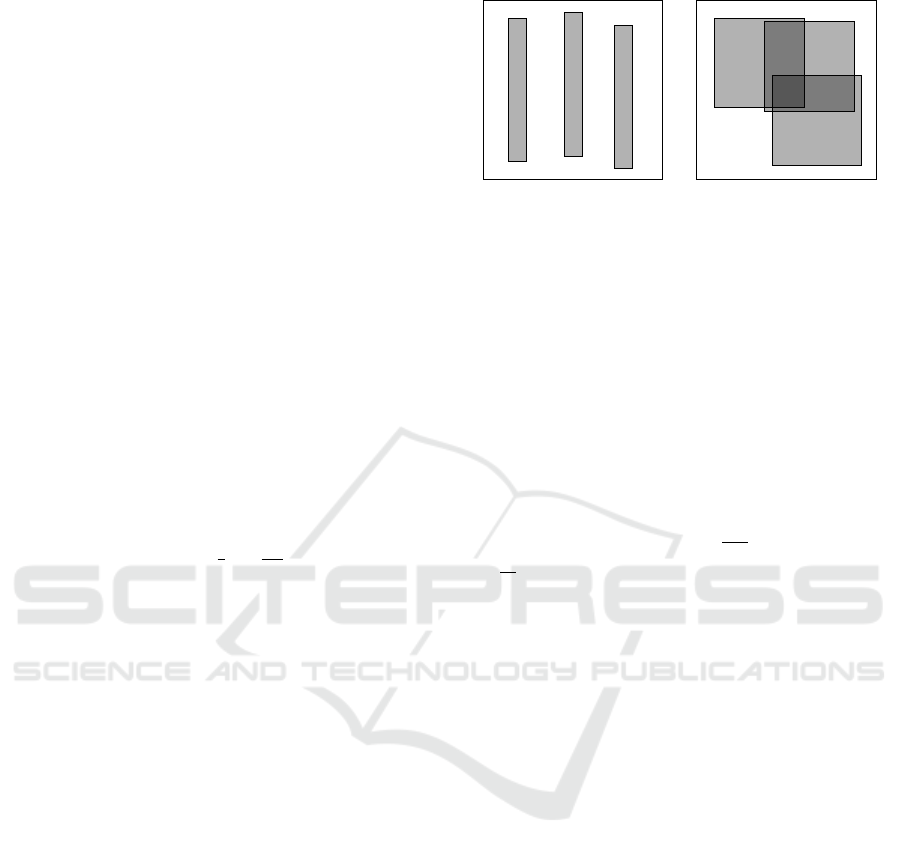
Region
(a) Typically rejected Re-
gionlet configuration.
Region
(b) Typically accepted Re-
gionlet configuration.
Figure 1: Examples of regionlet configurations that were
used during training. The outer box represents the region
while the smaller grey boxes inside represent the regionlets.
correspond to input values in the intervals [0,0.25),
[0.25,0.5), [0.5,0.75) and [0.75, 1].
The set of regions is generated as follows: Let w
B
the width of the candidate bounding box and h
B
its
height. The set of possible widths w
R
of our regions is
then W
R
= {w
B
,0.5w
B
,0.25w
B
} and the set of possi-
ble heights h
R
is H
R
= {0.5h
B
,0.25h
B
,0.125h
B
}. We
generate regions (x
R
,y
R
,w
R
,h
R
) from each element
(h
R
,w
R
) ∈ W
R
× H
R
by using a sliding window ap-
proach. The stride is given by
2w
B
w
R
in x-direction and
by
h
B
h
R
in y-direction.
3.1 Max-Pooling
In our first experiment we generated several regionlet
configurations randomly as described in (Wang et al.,
2013) and trained the classifier. We then examined
which regionlet configurations were chosen by the
boosting algorithm.
Figure 1 shows an example of a configuration that
was chosen and one that was not chosen. We found
that most configurations where the regionlets did not
overlap were discarded. In contrast, most of the cho-
sen configurations contained regionlets that had a sig-
nificant overlap. This is in line with what is intuitively
expected: Object parts can usually be found at any
position inside the allowed region and not only at a
few distinct positions. The chosen regionlet config-
uration allows for exactly that by performing max-
pooling over a large area inside the region.
In order to verify this theory, we replaced all re-
gionlet configurations by an artificial one that only
performs max-pooling. It contains 9 regionlets in a
3×3 grid where direct neighbours have 75 % overlap.
We found that there was nearly no change in detection
performance which confirms our theory.
This is an important observation. When using a
regular grid, the dimensionality of the feature space
can be reduced by a factor equal to the number of re-
ICPRAM 2017 - 6th International Conference on Pattern Recognition Applications and Methods
28
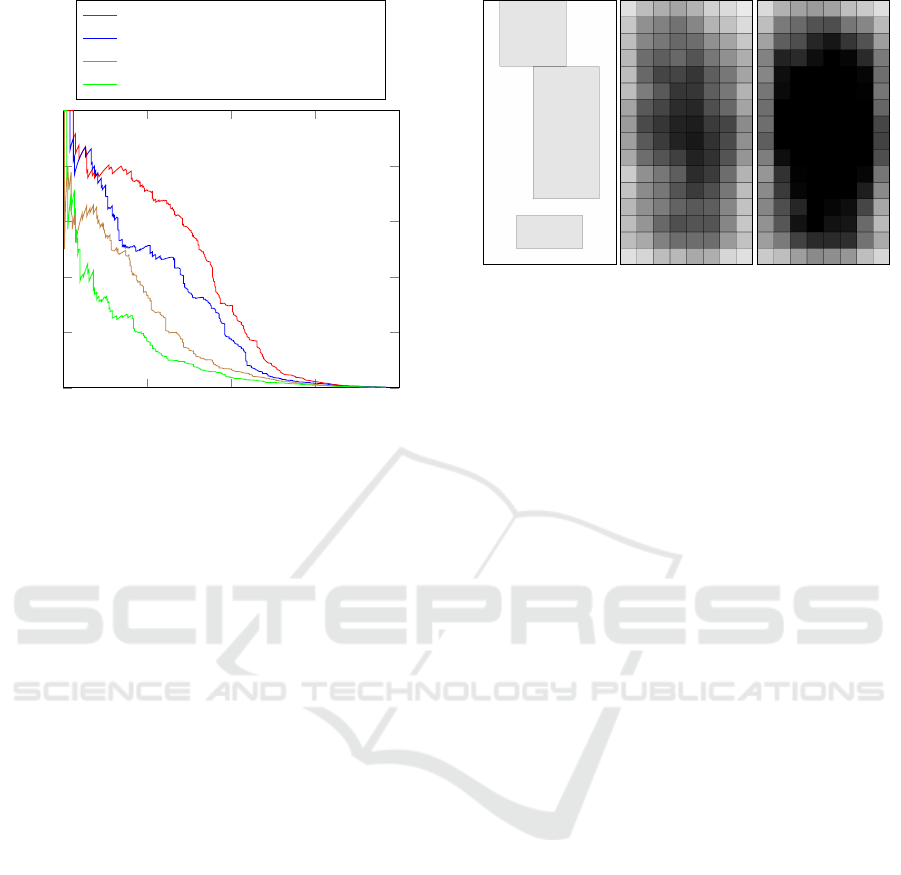
0 0.2 0.4
0.6
0.8
0
0.2
0.4
0.6
0.8
1
Recall
Precision
Regionlet features, max-pooling
Regionlet features, no max-pooling
Classic features, max-pooling
Classic features, no max-pooling
Figure 2: Precision-recall curves of our Regionlets based
classifier and a classic approach. The evaluation was per-
formed on 730 randomly chosen images of the KITTI
benchmark (Geiger et al., 2012).
gionlet configurations that would be generated other-
wise. This translates into a corresponding decrease
in memory consumption and computing time during
training.
We also evaluated the benefits of max-pooling.
We used the KITTI benchmark and selected 730 la-
belled images randomly for evaluation. All other la-
belled images were used for training.
Figure 2 shows the precision-recall curves
achieved with this. It is clearly visible that max-
pooling improves the performance considerably. This
is true for both the Regionlets descriptor and a classic
descriptor that we used for comparison. The latter is
described in detail in the following section.
3.2 Different Scales
One of the most important ideas of the Regionlets de-
scriptor is the introduction of regions that cover the
possible locations of all object parts. These regions
have different sizes to account for object parts of dif-
ferent sizes and different variability in their possible
locations. When all regions are fixed to one size and
there is no max-pooling inside the regions, the Re-
gionlet descriptor degrades to a classic block-based
descriptor.
We evaluated the benefits of having regions with
different sizes by also implementing a classic descrip-
tor and comparing the results. For our classic descrip-
tor, we extract HOG and LBP features from a window
Figure 3: Examples of regions selected by the boosting al-
gorithm. Each region is printed in black but with a low
opacity so that overlapping regions can be easily visualised.
Therefore, areas where many regions overlap appear darker
than those with less overlapping regions. The first image
shows the 3 most important regions, the second image the
250 most important regions and the last image the 500 most
important regions.
of size 64×128. The block size of the each descriptor
is 16 × 16 and the stride is 8 pixels both in x- and in
y-direction. All other parameters match the ones that
were used in our Regionlets descriptor.
The results are plotted in Figure 2. The Regionlets
descriptor clearly outperforms the classic approach.
It can also be seen that the improvement by max-
pooling over the pure classic approach is considerably
smaller than the improvement by using regions of dif-
ferent sizes.
Figure 3 shows the regions that the boosting clas-
sifier selects first, i. e. the most important ones. The
three most important regions cover the areas where
the upper body, the head and the feet of the pedes-
trian are expected. Then, the classifier mostly focuses
on the upper body. This can be seen when the 250
most import regions are visualised. The 500 most im-
portant regions already cover the whole body of the
pedestrian. As expected, only very few regions that
cover the background are selected.
3.3 Exhaustive Search
The standard approach for object detection in images
is the sliding window approach. The detector win-
dows is slid over the image with a fixed stride. Each
detector window is evaluated with the classifier to de-
termine whether it contains an object of interest or
not. This procedure is repeated with multiple window
sizes to search for objects at different scales.
The number of candidate bounding boxes that
have to be evaluated can be reduced by using a ground
plane assumption. For many applications in traffic, a
camera is mounted at a fixed position in the vehicle
Analysis of Regionlets for Pedestrian Detection
29
and the vehicle can only move on the ground. There-
fore, the distance between the camera and the ground
is fixed. This is also true for the KITTI dataset. Since
pedestrians can also only walk on the ground, some
combinations of bounding box position and size are
very unlikely to occur.
However, the assumption that the road is a perfect
plane may not always hold in curved terrain. Also,
pitching of the car may violate a static plane inclina-
tion assumption. We handle this by allowing a cer-
tain deviation from the perfect plane since we do not
want to estimate the ground plane in every shot. This
results in a Region Of Interest (ROI) for each scale
that has to be searched for pedestrian. We learnt these
ROIs from the training images.
The ground plane assumption can be expressed by
the following linear equation
h = m · u + h
0
(2)
where h is the height of the ROI in pixels, u is the
lower boundary of the ROI in the image, and m and
h
0
are the parameters. We learnt m and h
0
from the
training labels by using linear least square estimation.
The possible ROI locations are then given by
k
m · u + h
0
− h
k
< k
1
(3)
where k
1
is a non-negative threshold.
On the KITTI dataset, an exhaustive search in all
ROIs results in about 10 000 bounding boxes per im-
age that have to be evaluated.
3.4 Selective Search
In (Wang et al., 2013), selective search (van de Sande
et al., 2011) is used to reduce the number of candidate
bounding boxes that are evaluated. This can help to
reduce the required detection run-time. But it can also
be beneficial for the precision of the detector since
the chance for false positives is reduced. It is, how-
ever, important that the recall of the candidate bound-
ing box proposals is very high. The selective search
implementation from (van de Sande et al., 2011) gen-
erates around 1 000-2 000 candidate bounding boxes
per image.
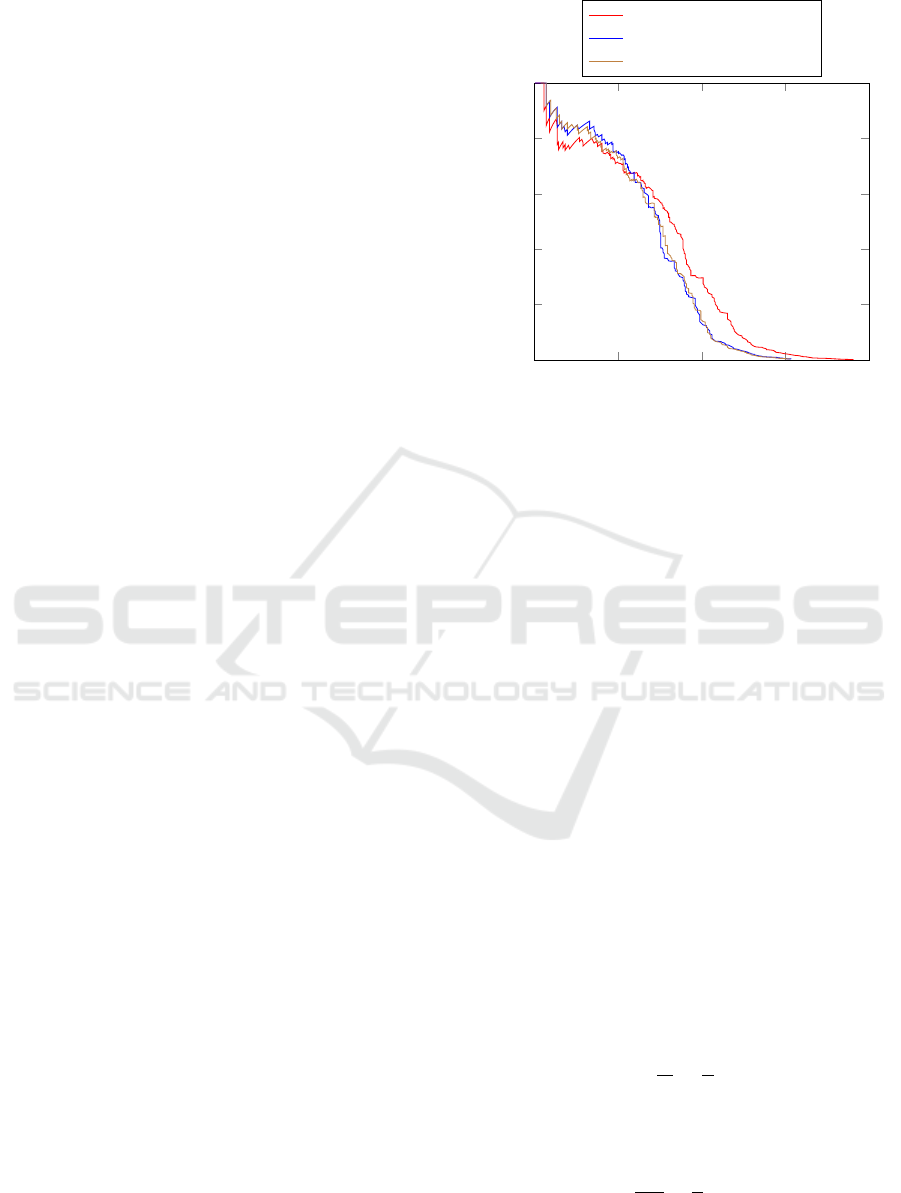
We compared the precision reached when using
selective search with a sliding window approach. The
results can be found in Figure 4. The precision in-
creased slightly for high decision value thresholds
(i. e. where recall is low). However, for lower de-
cision value thresholds the precision decreased. The
maximum recall also decreased because the bounding
box candidate proposals do not have perfect recall.
0 0.2 0.4
0.6
0.8
0
0.2
0.4
0.6
0.8
1
Recall
Precision
Sliding window approach
Selective search
Stereo based approach
Figure 4: Comparison of precision-recall curves when us-
ing selective search, a stereo based approach and a sliding
window approach. The evaluation was performed on 730
randomly chosen images of the KITTI benchmark (Geiger
et al., 2012).
3.5 Stereo based Bounding Box
Proposals
Bounding box proposals can also be generated from
stereo image pairs. In general, there are two possi-
bilities to do so. More complex methods take advan-
tage of the fact that there is usually a difference in the
depth of an object and its background. Pixels can then
be clustered by their depth values and each cluster can
be used to generate a bounding box proposal.
The other, simpler, possibility is to assume a fixed
size of the searched object in the world. Bounding
box candidates can then be generated in a sliding win-
dow fashion but all candidates that do not satisfy this
assumption are immediately discarded.
We evaluated the performance of the second ap-
proach as an alternative to selective search. We as-
sume that a pedestrian has an average size of H in the
world. Then, the size h (in pixels) of a person in the
image depends on the distance z between camera and
this person. The relationship is given by
H
z
=
h
f
(4)
where f is the focal length of the camera in pixels.
Using H = const. and disparity d ∝ f /z, we can derive
z · h
f
∝
h
d
= c (5)
and thus, we only have to estimate the constant c from
ICPRAM 2017 - 6th International Conference on Pattern Recognition Applications and Methods
30

the training data. This again can be done using least
squares estimation.
The disparity d is not constant for all pixels in a
candidate bounding box. We achieved good results
by computing d as the mean disparity of a local neigh-
bourhood at the centre of the candidate bounding box.
Then, all candidate bounding boxes for which the fol-
lowing equation holds are discarded:
h
d
− c
> k
2
(6)
where again, k
2
is a non-negative threshold.
We used (Ranft and Strauß, 2014) to obtain the
disparity image. This algorithm focuses on run-
time performance while achieving competitive re-
sults. However, any other stereo matcher with good
run-time performance could be used.
Our stereo based approach reduces the number of
candidate bounding boxes per image to about 2 000-
3 500 per image. The achieved detection performance
is similar to selective search and is plotted in Figure 4.
3.6 Run-time
Our OpenCL implementation needs around 700 ms
per image on an Nvidia Titan graphics card for an ex-
haustive search using a sliding window approach. The
number of evaluated bounding boxes can be drasti-
cally reduced by using image segmentation to gener-
ate candidate bounding box proposals. This promises
to reduce the run-time of the detection algorithm con-
siderably.
However, we found that the code for image seg-
mentation provided with (van de Sande et al., 2011)
takes around 1.6 s to execute on our Intel Xeon E5-
2640. This means that we could not reproduce the
performance of (Wang et al., 2013) which reports an
overall detection rate of 5 frames per second on a sin-
gle 2.1 GHz CPU core. It also means that run-time
performance cannot be improved by using this orig-
inal implementation. Other implementations of this
algorithm or other approaches for image segmenta-
tion can, however, be faster and advantageous for the
overall detection run-time.
Our stereo based method for candidate bounding
box generation takes approximately 72 ms (65 ms for
the stereo matcher and 7 ms for the candidate gener-
ation). It reduces the number of evaluated bounding
boxes compared to an exhaustive search by a factor of
approximately 3 to 5 depending on the image. This re-
sults in a corresponding decrease in detector run-time
that outweighs the cost of the stereo matching.
4 CONCLUSION
We have analysed the different ideas of the Regionlets
approach and determined what makes it work well.
The largest improvement in detection performance is
achieved by dividing the detection window into re-
gions and learning which of these regions are relevant.
We showed that the boosting algorithm learns that the
regions that contain parts of the pedestrian’s body are
the most relevant ones.
Randomly choosing regionlet configurations and
performing max-pooling on them achieves a simi-
lar performance as max-pooling on a regular grid.
The boosting algorithm tends to select configurations
that are regular and contain overlapping regionlets.
Performing max-pooling on a regular grid decreases
the memory consumption and computing time during
training.
The performance improvement by max-pooling is
less than the improvement achieved by using regions
but it is still important. However, it is not specific to
the regionlets approach—the same improvement can
be seen when max-pooling is used together with clas-
sic features (HOG and LBP).
The use of selective search influences the detec-
tion performance slightly but it does not necessarily
improve it. While it decreases the risk for false pos-
itives it also decreases recall. Concerning the run-
time performance, selective search does not help in
our case. This is because computing the candidate
bounding box proposals alone takes more time than
an exhaustive search with our OpenCL implementa-
tion.
However, our stereo based approach for the gen-
eration of candidate bounding box proposals is fast
enough to improve the overall run-time. With this
approach, the overall performance can meet the soft
real-time constraints of some applications.
The original Regionlets paper (Wang et al., 2013)
omits many implementation details. Therefore, the
results are not necessarily comparable with our im-
plementation. We could however show that the Re-
gionlets approach performs much better than classic
features.
REFERENCES
Ahonen, T., Hadid, A., and Pietik
¨
ainen, M. (2004). Face
Recognition with Local Binary Patterns. In Pajdla,
T. and Matas, J., editors, ECCV (1), volume 3021 of
Lecture Notes in Computer Science, pages 469–481.
Springer.
Dalal, N. and Triggs, B. (2005). Histograms of Oriented
Analysis of Regionlets for Pedestrian Detection
31

Gradients for Human Detection. pages 886–893.
IEEE Computer Society.
Felzenszwalb, P., Mcallester, D., and Ramanan, D. (2008).
A Discriminatively Trained, Multiscale, Deformable
Part Model. Computer Vision and Pattern Recogni-
tion, 2008. CVPR 2008. IEEE Conference on.
Geiger, A., Lenz, P., and Urtasun, R. (2012). Are we ready
for autonomous driving? The KITTI vision bench-
mark suite. In CVPR, pages 3354–3361. IEEE Com-
puter Society.
Huang, C., Ai, H., Wu, B., and Lao, S. (2004). Boosting
Nested Cascade Detector for Multi-View Face Detec-
tion. In ICPR (2), pages 415–418. IEEE Computer
Society.
Ranft, B. and Strauß, T. (2014). Modeling Arbitrarily Ori-
ented Slanted Planes for Efficient Stereo Vision based
on Block Matching. pages 1941–1947.
Schapire, R. E. and Singer, Y. (1999). Improved Boosting
Algorithms Using Confidence-rated Predictions. Ma-
chine Learning, 37(3):297–336.
van de Sande, K. E. A., Uijlings, J. R. R., Gevers, T., and
Smeulders, A. W. M. (2011). Segmentation as Se-
lective Search for Object Recognition. In Metaxas,
D. N., Quan, L., Sanfeliu, A., and Gool, L. J. V., edi-
tors, ICCV, pages 1879–1886. IEEE.
Vogel, J. and Schiele, B. (2007). Semantic Modeling of Nat-
ural Scenes for Content-Based Image Retrieval. Inter-
national Journal of Computer Vision, 72(2):133–157.
Wang, X., Yang, M., Zhu, S., and Lin, Y. (2013). Regionlets
for Generic Object Detection. In ICCV, pages 17–24.
IEEE.
ICPRAM 2017 - 6th International Conference on Pattern Recognition Applications and Methods
32
