
Remote Respiration Rate Determination in Video Data
Vital Parameter Extraction based on Optical Flow
and Principal Component Analysis
Christian Wiede, Julia Richter, Manu Manuel and Gangolf Hirtz
Department of Electrical Engineering and Information Technology,
Chemnitz University of Technology, Reichenhainer Str. 70, 09126 Chemnitz, Germany
Keywords:
Remote Respiration Rate Determination, Vital Parameters, Optical Flow, Principal Component Analysis.
Abstract:
Due to the steadily ageing society, the determination of vital parameters, such as the respiration rate, has come
into focus of research in recent years. The respiration rate is an essential parameter to monitor a person’s
health status. This study presents a robust method to remotely determine a person’s respiration rate with an
RGB camera. In our approach, we detected four subregions on a person’s chest, tracked features over time with
optical flow, applied a principal component analysis (PCA) and several frequency determination techniques.
Furthermore, this method was evaluated in various recorded scenarios. Overall, the results show that this
method is applicable in the field Ambient Assisted Living (AAL).
1 INTRODUCTION
Europe, in particular Germany, is facing the problem
of a steadily ageing society. According to the national
German statistical agency, 29 % of the population will
be older than 65 years in 2030 (Statistisches Bunde-
samt, 2015). Moreover, there will be a lack of medical
personnel to care for the elderly. This development
goes hand in hand with a higher demand for technical
assistance systems, which can support elderly people
in their self-determined living.
Current technical assistance systems can either
detect emergencies such as falls (Wohlrab et al.,
2015) or monitor the daily activities of elderly peo-
ple (Meinel et al., 2015). Heretofore, these systems
cannot monitor a person’s current health status, which
is one essential requirement to stay longer in the own
flat and living in a self-determined way at the same
time. This issue could be solved by detecting and
tracking vital parameters. These vital parameters,
such as heart rate, respiration rate and oxygen sat-
uration, can be measured by means of RGB cam-
eras. In this work, we focus on determining a per-
son’s respiration rate accurately and robustly. For this,
we propose an algorithm that detects multiple fea-
ture points in a region of interest (ROI) at the chest
and tracks these points with a Kanade-Lucas-Tomasi
(KLT) point tracker (Tomasi and Kanade, 1991). This
step is followed by a temporal filtering, a PCA and
a frequency determination. Moreover, we proved the
reliability for various scenarios in our experiments.
The presented approach has the crucial advantage
that it works contact-less. This will be more comfort-
able for future users, because they are not required to
wear additional devices. Moreover, this approach al-
lows the determination of the respiration rate at home
in the first place. The respiration rate as vital parame-
ter can provide information about the general current
health status and miscellaneous abnormal respiration
patterns, which can be indicators for pulmonary dis-
eases. For example, it is possible to detect a sudden
breathlessness and inform an emergency doctor im-
mediately, who can react earlier than nowadays. This
can save lives and prevent restrictions induced by sec-
ondary diseases, which could then be preventable as
well. Besides the field of AAL, there exist further
possible applications, such as the prevention of sud-
den infant death syndrome at neonatals at an early
stage, sleep monitoring and the tracking of a driver’s
well being.
This study is structured as follows: In Section 2, a
survey about the existing literature is conducted. This
is followed by Section 3, where the proposed method
is described in detail. Based on this, an experimen-
tal study for multiple scenarios is performed in Sec-
tion 4. This is accompanied by a detailed discussion.
Finally, the findings are condensed and future work is
outlined.
326
Wiede C., Richter J., Manuel M. and Hirtz G.
Remote Respiration Rate Determination in Video Data - Vital Parameter Extraction based on Optical Flow and Principal Component Analysis.
DOI: 10.5220/0006095003260333
In Proceedings of the 12th International Joint Conference on Computer Vision, Imaging and Computer Graphics Theory and Applications (VISIGRAPP 2017), pages 326-333
ISBN: 978-989-758-225-7
Copyright
c
2017 by SCITEPRESS – Science and Technology Publications, Lda. All r ights reserved

2 RELATED WORK
The determination of vital parameters is a relevant
field in medicine, which has been studied for cen-
turies. Beside the heart rate, the respiration rate in-
dicates a person’s individual health state and is there-
fore suited to assess the personal well-being. Further-
more, a pathologically varied respiration rate, which
occurs during breathlessness or hyperventilation, can
be a symptom for multiple diseases.
In the clinical environment, there are multiple pos-
sibilities to measure the respiration rate, for exam-
ple respiratory effort belts, nasal thermistors, pres-
sure transducers or by taking the modulated signal
of the electrocardiography (ECG). All these estab-
lished methods have in common the disadvantage that
they need direct body contact. These measurement
methods cause a large discomfort for elderly people.
Therefore, optical methods can contribute to a higher
comfort due to their contact-less working mode.
Fei and Pavlidis applied a face and nostrils recog-
nition on thermal images and used a wavelet analysis
to determine the thermal change at the nostrils during
inhalation and exhalation (Jin Fei and Pavlidis, 2010).
Other researchers have chosen the Kinect device for
respiration rate detection to monitor the movement of
the chest during the breathing. Martinetz et al. tracked
the Kinect infra-red pattern over time, applied a PCA
and auto regressive (AR) methods to determine the
frequency (Martinez and Stiefelhagen, 2012). In con-
trast to that, Lim et al. used a moving average filter
and a spline interpolation on the depth points (Lim
et al., 2014). Ostadabbas et al. extended this idea by
automatically selecting an ROI on the chest and by
measuring depth changes (Ostadabbas et al., 2015).
While all these approaches used different wave-
lengths in the infra-red spectrum, we want to focus
on the visible light spectrum, i. e. by using RGB cam-
eras. In general, the lifting and lowering of the torso
and the abdomen could be observed in all existing
approaches that determined the respiration rate. Tan
et al. proposed to measure the motion by subtract-
ing two consecutive frames and detecting edges (Tan
et al., 2010). In comparison to that, Bartula et al.
created 1D-profiles of a person and correlated these
1D-vectors of adjacent frames to determine the res-
piration rate (Bartula et al., 2013). An alternative ap-
proach consist of the detection of intensity changes on
the skin and the application of an independent compo-
nent analysis (ICA) to determine the heart rate (Poh
et al., 2011). The respiration rate can be determined
by a modulation of the heart rate signal. Tarassenko
et al. expanded this concept by using AR models for
the frequency determination (Tarassenko et al., 2014).
In 2015, Sharma et al. used the Eulerian Video Mag-
nification presented by Wu et al. (Wu et al., 2012) to
determine the respiration rate by means of intensity
changes (Sharma et al., 2015).
Another large group of approaches are tracking
based and optical flow based methods. The ba-
sics were investigated by Nakajima et al. (Nakajima
et al., 2001) and Frigola et al. (Frigola et al., 2002),
who used the methods of Horn-Schunck (Horn and
Schunck, 1981) or (Pentland and Horowitz, 1991) re-
spectively. Based on this, Lukac et al. use a KLT
tracker (Tomasi and Kanade, 1991) for the optical
flow (Lukac et al., 2014). This principle was im-
proved by Koolen et al., who applied a PCA, an ICA
and a Short Time Fourier Transform (STFT) for sig-
nal analysis (Koolen et al., 2015). In the application
field of remote heart rate determination, Balakrishnan
et al. suggested to firstly find features in the face and
then use a point tracker to extract the trajectories (Bal-
akrishnan, 2014). Subsequently, they applied a PCA
and determined the heart rate. Li et al. adapted this
approach and used it to detect points on the chest for
respiration rate determination (Li et al., 2014).
The extant literature revealed that it is possible to
extract the human respiration rate with an RGB cam-
era remotely. However, there exist different solutions
to reach this aim. We combined several of such so-
lutions to design an accurate and robust system for
remote respiration rate detection. Furthermore, we
evaluated the proposed algorithm under various con-
ditions.
3 METHODS
3.1 Overview
In the following section, the implemented methods to
remotely obtain the respiration rate are presented. The
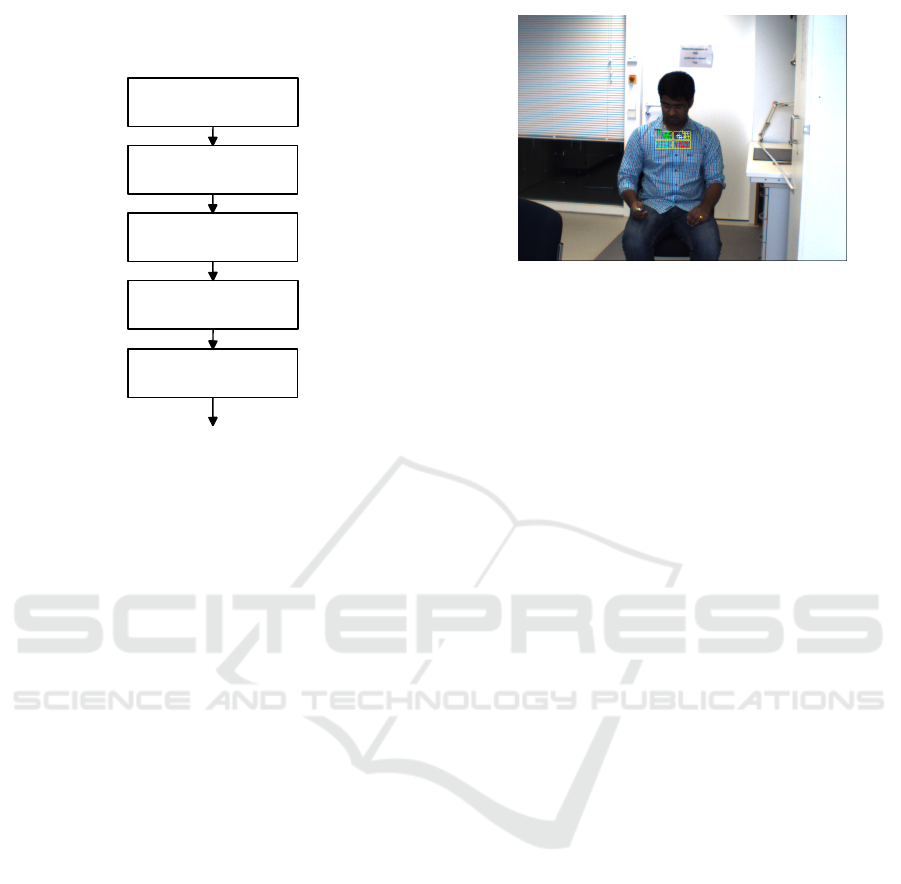
principal steps are visualised in Figure 1. In the first
place, images were acquired from an RGB camera.
This was followed by an ROI selection on the chest, a
feature detection in this ROI and the tracking of these
features. The trajectories of the tracked points were
extracted and bandpass filtered. Afterwards, a PCA, a
channel selection and a frequency determination were
performed. This chain outputs the final respiration
rate.
3.2 ROI Selection
For the proposed approach, it is necessary to observe
the chest or a part of the chest to monitor the lifting
and the lowering of the torso, which is induced by the
Remote Respiration Rate Determination in Video Data - Vital Parameter Extraction based on Optical Flow and Principal Component
Analysis
327
Respiration Rate
Remote Respiration Rate
Determination Method
Image Acquisition
ROI Selection
Feature Tracking
Bandpass Filtering
and PCA
Frequency
Determination
Figure 1: Block diagram of the proposed remote respiration
rate determination algorithm.
breathing. There are two possibilities to obtain a sta-
ble region of interest on the chest. On the one hand,
there is the face detection. By concluding from the
position of the face bounding box, the chest bounding
box could be estimated. On the other hand, there is
the the upper body detection. In this case, the chest
bounding box was selected as a part within the upper
body bounding box. Both possibilities use a Viola-
Jones detector (Viola and Jones, 2004). While the
face detector is more accurate, the upper body detec-
tor can be applied if the face is not visible, e. g. when
the person is not facing the cameras.
In the first place, we applied the face detector. The
ROI was placed centrally below the face bounding
box by 125 % of the face bounding box height. The
height of this ROI is 60 % of the face bounding box
height and its width is 120 % of the bounding box
width.
If no face could be detected, the upper body de-
tector was applied. The corresponding bounding box
height is 20 % of the upper body bounding box height
and its width is 36 % to obtain an ROI of the chest.
The center is shifted in vertical direction centrally by
65 % of the height of the upper body bounding box.
Finally, the ROI was split in four equally sized
quarters, see Figure 2. The advantage of splitting the
ROI is a higher robustness of the further processing
steps. Noise that effects only one part of the ROIs
could be reduced or eliminated in this way.
Figure 2: Proband with the chest bounding box consisting
of four subregions and the tracked points.
3.3 Feature Tracking
Before the tracking could be applied, a preliminary
feature detection was necessary to identify unique im-
age parts. For this purpose, we used minimum eigen-
value feature (Shi and Tomasi, 1993) in each of the
four subregions. Possible corner points were identi-
fied by a minimum eigenvalue metric. In Figure 2,
the detected features are shown. In order to limit the
number of features, only the fifteen strongest points
per region were selected.
Based on this, we applied a so-called KLT tracker
(Tomasi and Kanade, 1991), which is the base for the
optical flow as well. According to the brightness as-
sumption, the intensity of a pixel I(x, y, t
0
) at the time
t
0
will remain stable over short time durations and
small movements. For a single time step dt, the fol-
lowing equation is valid:
I(x, y, t
0
) = I(x + dx, y + dy, t
0
+ dt) (1)
dx and dy denote the small displacements in x and
y direction. Obviously, this equation with two un-
known variables cannot be solved. To overcome this
issue, Tomasi and Kanade suggested to use the neigh-
bouring pixels as well, since they perform all the same
trajectory for a small movement. A 3×3 patch results
in nine equations for two unknown variables. This
over-determined equation system can be solved by a
least square fitting method.
As a result, the trajectories of the n feature points
in one subregion were observed in x and y direction:
y
1
n
(t); x
1
n
(t) (2a)
y
2
n
(t); x
2
n
(t) (2b)
y
3
n
(t); x
3
n
(t) (2c)
y
4
n
(t); x
4
n
(t) (2d)
VISAPP 2017 - International Conference on Computer Vision Theory and Applications
328
In the following processing, only the y coordinates
were considered, because the principal component of
the chest motion during the breathing is the y direc-
tion. The mean value Y
avg
of all feature points in y di-
rection can be considered as the motion of the whole
subregion, see Equation 3.
Y
1
avg
(t) =
1
n
n
∑
i
y
1
n
(t) (3a)
Y
2
avg
(t) =
1
n
n
∑
i
y
2
n
(t) (3b)
Y
3
avg
(t) =
1
n
n
∑
i
y
3
n
(t) (3c)
Y
4
avg
(t) =
1
n
n
∑
i
y
4
n
(t) (3d)
If no feature points were found in one subregion,
the final signal was substituted by the subregion with
the highest number of features. This procedure guar-
antees a robust processing even if there are no feature
points in one subregion.
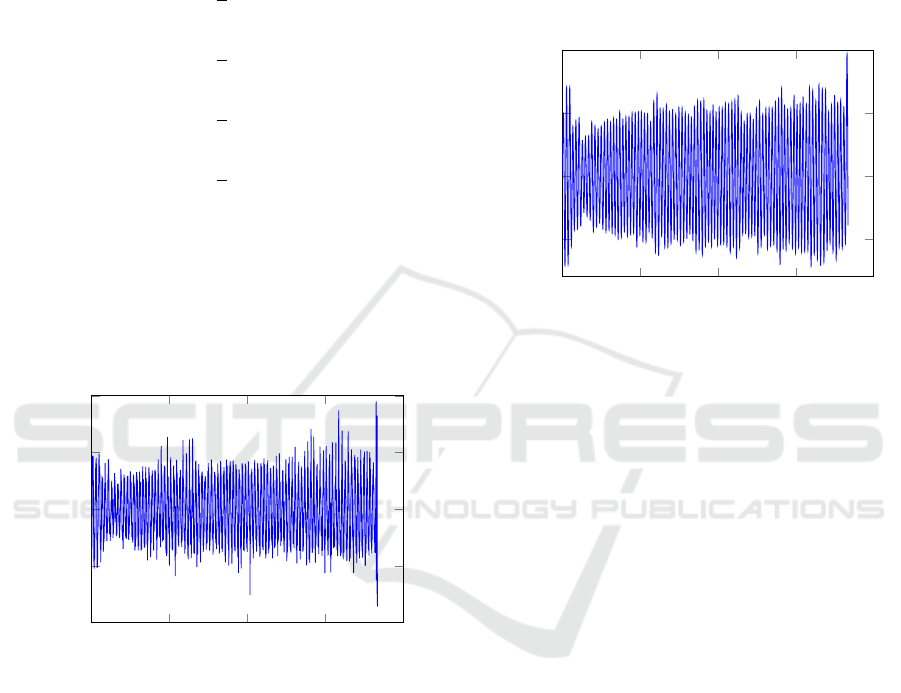
0
50
100
150
200
−1
−0.5
0
0.5
1
Time in s
Vertical shift in pixels
Trajectory from one subregion
Figure 3: Raw signal of the trajectory of one subregion.
3.4 Bandpass Filtering and PCA
In order to exclude implausible frequencies, which
do not lie in the physiological range of the human
respiration rate, a bandpass filter BP was applied to
all four subregions. An FIR filter with 128 filter co-
efficients was selected to guarantee a constant group
delay. The designed filter allows all frequencies
between 0.125 Hz (7.5 BPM) and 0.7 Hz (42 BPM)
to pass. This range complies with the natural human
respiration rate. Y
BP
denotes the filtered signal, see
Equation 4.
Y
1
BP
(t) = BP(t) ∗Y
1
avg
(t) (4a)
Y
2
BP
(t) = BP(t) ∗Y
2
avg
(t) (4b)
Y
3
BP
(t) = BP(t) ∗Y
3
avg
(t) (4c)
Y
4
BP
(t) = BP(t) ∗Y
4
avg
(t) (4d)
0
50
100
150
200
−0.5
0
0.5
1
Time in s
Vertical shift in pixels
Filtered vertical trajectory
Figure 4: Filtered signal of the trajectory of one subregion.
These filtered signals contain the information of
all vertical motions in the assigned frequency range.
However, there is still motion present in these signals,
which cannot be referred to as breathing. In order
to split the bandpass filtered signals in the respiration
rate signal and noise signals, we applied a PCA, ac-
cording to Equation 5. This method detects the prin-
cipal components in a new orthogonal coordinate sys-
tem.
PC(t) = PCA(Y
1
BP
(t); ...;Y
4
BP
(t)) (5)
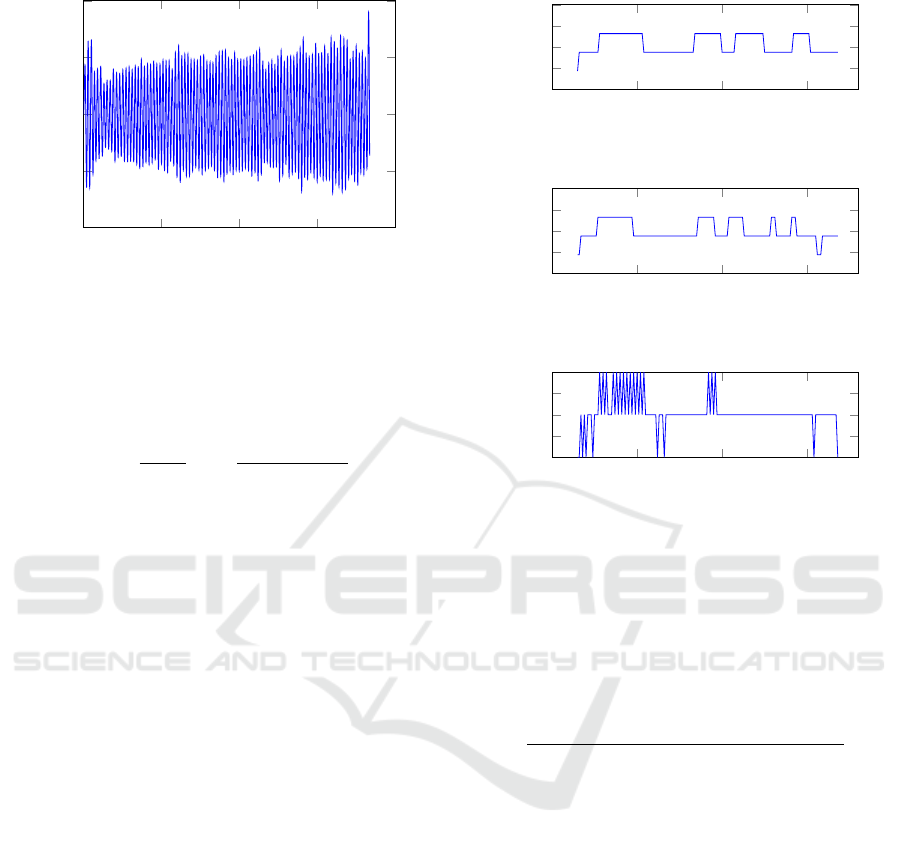
In this equation, PC denotes one principal compo-
nent. In total, there are four resulting principal com-
ponents. The first principal component is shown in
Figure 5. For the subsequent frequency determina-
tion, the principal component with the highest spec-
trum density was selected. In our experiments, the
principal component with the highest spectrum den-
sity was always the first component.
3.5 Frequency Determination
In this study, we implemented three different meth-
ods for frequency determination: the FFT, the spec-
tral estimator described by Welch and a peak counting
method. A sliding window of 30 seconds was used for
all three methods.
For a specific time t
0
, the three methods can be
Remote Respiration Rate Determination in Video Data - Vital Parameter Extraction based on Optical Flow and Principal Component
Analysis
329
0
50
100
150
200
−2
−1
0
1
2
Time in s
Magnitude in pixels
PC 1
Figure 5: First principal component.
defined as:
F
FFT
(t
0
) = max(
|
FFT(PC)
|
) (6a)
F
Welch
(t
0
) = max(
|
Welch(PC)
|
) (6b)
F
Peaks
(t
0
) =
1
n
peaks
t
0
+30s
∑
t
0
1
t
peak
−t
peak−1
, (6c)
whereas F
FFT
, F
Welch
and F
Peaks
are the determined
respiration rates.
In Figure 6, these respiration rates are displayed
over time.
4 RESULTS AND DISCUSSION
4.1 Setting
In order to test the proposed algorithm under vari-
ous conditions, we created a database of 35 differ-
ent videos in total. These videos were recorded us-
ing an RGB camera, i. e. a Basler acA640-100gc with
a resolution of 658 × 492 pixel. The automatic ex-
posure time control and the automatic white balanc-
ing were disabled in order to avoid influences on our
measurements. We recorded the videos with a fixed
frame rate of 30 frames per second. Each video has
a duration of approximately three minutes. In total,
five probands took part in our experiments. For the
records, no other light sources than daylight or nor-
mal ceiling light were used.
For the evaluation, we considered the distance
from the camera, the brightness of the image, the in-
fluence of different clothing and the orientation of the
probands. The considered scenarios are summarised
in Table 1. These scenarios will be discussed in the
following sections in detail. The scenario with a dis-
tant of three metres from the camera, good lighting
0
50
100
150
29
29.5
30
30.5
31
Time in s
Breaths/Minute
Frequency determination using Welch
0
50
100
150
29
29.5
30
30.5
31
Time in s
Breaths/Minute
Frequency determination using FFT
0
50
100
150
28
29
30
31
32
Time in s
Breaths/Minute
Frequency determination using peak detection
Figure 6: Outputs of the three frequency determination
methods: F
FFT
, F
Welch
and F
Peaks
. In this case, the deter-
mined respiration rate is approximately 30 breaths per sec-
ond.
conditions and with a textured shirt was defined as
ideal.
Table 1: Evaluated scenarios in our experiments.
Evaluation criterion Scenario
Distance 1 m
3 m
5 m
Illumination Good
Insufficient
Clothing influence Textured shirt
Plain shirt
Extra jacket
View Back view
For evaluation, we used a set of pre-defined res-
piration rates as ground truth data. For this, the
probands performed guided breathing patterns. That
means that they had to breath in a certain fixed breath-
ing frequency to approximately reach the defined
ground truth value. Defined ground truth values were
30 BPM, 25 BPM, 20 BPM, 15 BPM and 7.5 BPM.
This results in a maximal possible error resolution
of 3.75 BPM. The breathing patterns were randomly
chosen for different probands and sequences. In or-
VISAPP 2017 - International Conference on Computer Vision Theory and Applications
330

der to compare the determined respiration rate with
the ground truth, we assigned this determined respira-
tion rate to the nearest value of the defined breathing
pattern values. Then, we evaluated whether this as-
signed value is equal to the ground truth value of the
sequence or not.
4.2 Distance from Camera
One essential criterion for a robust algorithm is the
invariance against scaling. The respiration rate de-
termination should not be depended on the distance
between the camera and a person. For evaluation,
three different distances to the camera were chosen,
i. e. 1 m, 3 m and 5 m. Five videos were recorded for
each scenario, which results in quantisation steps of
20 % for five probands. All three frequency determi-
nation measurement methods were applied.
Table 2: Classification rates for the distance scenarios.
Distance FFT Welch Peak
1 m 100 % 100 % 100 %
3 m 100 % 100 % 100 %
5 m 100 % 100 % 80 %
As shown in Table 2, the distance does not sub-
stantially influence the proposed algorithm. The al-
gorithm fails to determine the correct respiration rate
only for one proband at a distance of five metres for
the peak detection. This person’s chest was partially
covered by long hair falling from the head. Nonethe-
less, the respiration rate for the other videos could be
successfully determined for this person. Hence, it can
be concluded that the algorithm is scale-invariant as
long as there are still features available.
4.3 Illumination
The lighting condition in a room can change very
quickly, for example when ceiling lights are switched
on or off or the incoming sunlight changes its inten-
sity due to clouds. In these scenarios, the proposed al-
gorithm should continuously track the features with-
out loosing too many features. In our first setting,
we recorded the five probands under perfect lighting
conditions. Then, in the second setting, the ceiling
lights were switched off, so that the illumination and
the contrast were low in this setting.
Table 3: Classification rates for the illumination scenarios.
Illumination FFT Welch Peak
Good 100 % 100 % 100 %
Insufficient 100 % 100 % 100 %
The proposed method managed both good illu-
mination conditions and insufficient illumination, see
Table 3. The respiration rate was detected in all
videos and with all probands for this scenario. It can
be concluded that the illumination does not have a
substantial effect on the algorithm output.
4.4 Influence of Clothing
Another major influence factor consists in the type of
clothing that is worn. Since the proposed method is
feature-based, the texture of the shirt plays an impor-
tant role. In the standard case, a shirt with patterns
(texture) was used. In contrast to that, in the second
case, the probands wore a blank shirt with a homoge-
neous appearance. We expected that less or no fea-
tures would be found in the subregions. In a third
case, the probands wore an additional jacket. Due to
the fact that there is partially air between the shirt and
the jacket, the breathing patterns might not be trans-
ferred to the jacket.
Table 4: Classification rates for the clothing scenarios.
Clothing FFT Welch Peak
Textured shirt 100 % 100 % 100 %
Plain shirt 100 % 100 % 100 %
Extra jacket 100 % 100 % 100 %
In all three scenarios, the correct respiration rates
were estimated for all probands, see Table 4. Despite
the decreased number of features in the four subre-
gions for the blank shirt, a sufficient number of fea-
tures was still detectable. These features appeared
especially at the collar or buttons of the shirt. Ad-
ditionally, it can be observed that the respiration rate
could be determined even when the probands wore a
jacket. That means that the transfer of the breathing
motion was still large enough to accurately determine
the respiration rate.
4.5 Back View
In real scenarios, it is not guaranteed that a person is
always looking frontal at the camera. For that reason,
all probands’ back views were recorded for one sce-
nario.
Table 5: Classification rates for the back view.
View FFT Welch Peak
Back view 100 % 100 % 80 %
As shown in Table 5, the peak detection algorithm
failed to detect the correct respiration rate for only
one proband. This, again, can be explained with the
Remote Respiration Rate Determination in Video Data - Vital Parameter Extraction based on Optical Flow and Principal Component
Analysis
331

proband’s long hair, which covered the back of the up-
per body. The FFT and the Welch estimation method
were still able to predict the correct respiration rate.
4.6 Overall Comparison
Overall, 35 videos were considered for the testing. In
general, in all scenarios the respiration rate could be
classified correctly, see Table 6. While the peak de-
tection method was able to detect the correct respi-
ration rate only in 94.4 % of the cases, the FFT and
the Welch spectral estimation worked perfectly for all
scenarios. Therefore, it is recommended to use one of
those two methods to determine the frequency for the
respiration rate.
Table 6: Overall classification rates.
Method FFT Welch Peak
Overall 100 % 100 % 94.4 %
5 CONCLUSION AND FUTURE
WORK
In this study, we developed a new method for remote
respiration rate determination, which is based on four
ROIs, an optical flow based tracking, a PCA and a fre-
quency determination. Furthermore, an intense eval-
uation of different environmental parameters and sce-
narios was conducted. The results show that the pre-
sented method worked robustly in all scenarios. The
best frequency determination methods were the FFT
and the Welch spectral estimation. The results reveal
that it is possible to use such a respiration rate esti-
mation system in a domestic environment for AAL.
Further studies have to evaluate whether the accuracy
is sufficient for clinical use.
For future work, the influence of motion has to
be evaluated. If the respiration rate and the superim-
posed motion signal could be separated, this method
could be used as well in the field of e-rehabilitation
or in professional sports. Moreover, we intend to de-
velop a real-time working system to detect the respi-
ration rate immediately.
ACKNOWLEDGEMENTS
This project is funded by the European Social Fund
(ESF). We furthermore would like to express our
thanks to all the persons who contributed to this
project with their recordings.
REFERENCES
Balakrishnan, G. (2014). Analyzing pulse from head mo-
tions in video. PhD thesis, Massachusetts Institute of
Technology.
Bartula, M., Tigges, T., and Muehlsteff, J. (2013). Camera-
based system for contactless monitoring of respira-
tion. In Engineering in Medicine and Biology Society
(EMBC), 2013 35th Annual International Conference
of the IEEE, pages 2672–2675. IEEE.
Frigola, M., Amat, J., and Pags, J. (2002). Vision based
respiratory monitoring system. In Proceedings of the
10th Mediterranean Conference on Control and Au-
tomationMED2002 Lisbon, Portugal.
Horn, B. K. and Schunck, B. G. (1981). Determining optical
flow. Artificial intelligence, 17(1-3):185–203.
Jin Fei and Pavlidis, I. (2010). Thermistor at a Distance:
Unobtrusive Measurement of Breathing. IEEE Trans-
actions on Biomedical Engineering, 57(4):988–998.
Koolen, N., Decroupet, O., Dereymaeker, A., Jansen, K.,
Vervisch, J., Matic, V., Vanrumste, B., Naulaers, G.,
Van Huffel, S., and De Vos, M. (2015). Automated
Respiration Detection from Neonatal Video Data:. In
Proceedings of the International Conference on Pat-
tern Recognition Applications and Methods, pages
164–169. SCITEPRESS - Science and and Technol-
ogy Publications.
Li, M. H., Yadollahi, A., and Taati, B. (2014). A non-
contact vision-based system for respiratory rate esti-
mation. In Engineering in Medicine and Biology So-
ciety (EMBC), 2014 36th Annual International Con-
ference of the IEEE, pages 2119–2122. IEEE.
Lim, S. H., Golkar, E., Rahni, A., and Ashrani, A. (2014).
Respiratory motion tracking using the kinect camera.
In Biomedical Engineering and Sciences (IECBES),
2014 IEEE Conference on, pages 797–800. IEEE.
Lukac, T., Pucik, J., and Chrenko, L. (2014). Contactless
recognition of respiration phases using web camera.
In Radioelektronika (RADIOELEKTRONIKA), 2014
24th International Conference, pages 1–4. IEEE.
Martinez, M. and Stiefelhagen, R. (2012). Breath rate mon-
itoring during sleep using near-ir imagery and pca. In
Pattern Recognition (ICPR), 2012 21st International
Conference on, pages 3472–3475. IEEE.
Meinel, L., Richter, J., Schmidt, R., Findeisen, M., and
Hirtz, G. (2015). Opdemiva: An integrated assis-
tance and information system for elderly with demen-
tia. In Consumer Electronics (ICCE), 2015 IEEE In-
ternational Conference on, pages 76–77.
Nakajima, K., Matsumoto, Y., and Tamura, T. (2001).
Development of real-time image sequence analysis
for evaluating posture change and respiratory rate
of a subject in bed. Physiological Measurement,
22(3):N21.
Ostadabbas, S., Sebkhi, N., Zhang, M., Rahim, S., Ander-
son, L. J., Lee, F. E.-H., and Ghovanloo, M. (2015). A
Vision-Based Respiration Monitoring System for Pas-
sive Airway Resistance Estimation. IEEE Transac-
tions on Biomedical Engineering, pages 1–1.
VISAPP 2017 - International Conference on Computer Vision Theory and Applications
332

Pentland, A. and Horowitz, B. (1991). Recovery of nonrigid
motion and structure. IEEE Transactions on Pattern
Analysis and Machine Intelligence, 13(7):730–742.
Poh, M.-Z., McDuff, D., and Picard, R. (2011). Advance-
ments in Noncontact, Multiparameter Physiological
Measurements Using a Webcam. Biomedical Engi-
neering, IEEE Transactions on, 58(1):7–11.
Sharma, S., Bhattacharyya, S., Mukherjee, J., Purkait, P. K.,
Biswas, A., and Deb, A. K. (2015). Automated detec-
tion of newborn sleep apnea using video monitoring
system. In Advances in Pattern Recognition (ICAPR),
2015 Eighth International Conference on, pages 1–6.
IEEE.
Shi, J. and Tomasi, C. (1993). Good Features to Track.
Technical report, Cornell University, Ithaca, NY,
USA.
Statistisches Bundesamt (2015). 13. koordinierte
Bev
¨
oelkerungsvorausberechnung f
¨
ur Deutschland.
https://www.destatis.de/bevoelkerungspyramide/.
[Online; accessed 07-Septemper-2016].
Tan, K. S., Saatchi, R., Elphick, H., and Burke, D. (2010).
Real-time vision based respiration monitoring sys-
tem. In Communication Systems Networks and Digital
Signal Processing (CSNDSP), 2010 7th International
Symposium on, pages 770–774. IEEE.
Tarassenko, L., Villarroel, M., Guazzi, A., Jorge, J., Clifton,
D. A., and Pugh, C. (2014). Non-contact video-
based vital sign monitoring using ambient light and
auto-regressive models. Physiological Measurement,
35(5):807–831.
Tomasi, C. and Kanade, T. (1991). Detection and Tracking
of Point Features. Technical report, Carnegie Mellon
University.
Viola, P. and Jones, M. J. (2004). Robust real-time face
detection. International Journal of Computer Vision,
57(2):137–154.
Wohlrab, D., Heß, M., Apitzsch, A., Langklotz, M.,
Schwarzenberger, A., Bilda, S., Schulz, H., Hirtz,
G., and Mehner, J. (2015). Hom-e-call - an en-
hanced fall detection system based on accelerometer
and optical sensors applicable in domestic environ-
ment. In Jaffray, D. A., editor, World Congress on
Medical Physics and Biomedical Engineering, June 7-
12, 2015, Toronto, Canada, volume 51 of IFMBE Pro-
ceedings, pages 1461–1464. Springer International
Publishing.
Wu, H.-Y., Rubinstein, M., Shih, E., Guttag, J., Durand, F.,
and Freeman, W. T. (2012). Eulerian Video Magni-
fication for Revealing Subtle Changes in the World.
ACM Trans. Graph. (Proceedings SIGGRAPH 2012),
31(4).
Remote Respiration Rate Determination in Video Data - Vital Parameter Extraction based on Optical Flow and Principal Component
Analysis
333
