
Can We Detect Pedestrians using Low-resolution LIDAR?
Integration of Multi-frame Point-clouds
Yoshiki Tatebe
1
, Daisuke Deguchi
2
, Yasutomo Kawanishi
1
, Ichiro Ide
1
,
Hiroshi Murase
1
and Utsushi Sakai
3
1
Graduate School of Information Science, Nagoya University, Furo-cho, Chikusa-ku, Nagoya-shi, Aichi, Japan
2
Information Strategy Office, Nagoya University, Furo-cho, Chikusa-ku, Nagoya-shi, Aichi, Japan
3
DENSO CORPORATION, 1-1 Showa-cho, Kariya-shi, Aichi, Japan
Keywords:
LIDAR, Pedestrian Detection, Low-resolution.
Abstract:
In recent years, demand for pedestrian detection using inexpensive low-resolution LIDAR (LIght Detection
And Ranging) is increasing, as it can be used to prevent traffic accidents involving pedestrians. However, it is
difficult to detect pedestrians from a low-resolution (sparse) point-cloud obtained by a low-resolution LIDAR.
In this paper, we propose multi-frame features calculated by integrating point-clouds over multiple frames for
increasing the point-cloud resolution, and extracting their temporal changes. By combining these features,
the accuracy of the pedestrian detection from low-resolution point-clouds can be improved. We conducted
experiments using LIDAR data obtained in actual traffic environments. Experimental results showed that the
proposed method could detect pedestrians accurately from low-resolution LIDAR data.
1 INTRODUCTION
Since 2007, the number of road traffic deaths has not
decreased (WHO, ), illustrating the needs for further
countermeasures against traffic accidents. Further-
more, road traffic deaths among pedestrians are still
high, accounting for 22% of the total. In addition,
the demand for autopilot system for consumer vehi-
cles has grown considerably in the last decade (Shroff
et al., 2013). From these reasons, a system that can
recognize the surrounding environment of a vehicle
and warn the driver about pedestrians in danger is in
strong demand.
In the past few years, pedestrian detection sys-
tems have been actively developed. Among such
researches, various methods that employ LIght De-
tection And Ranging (LIDAR) as an in-vehicle sen-
sor have been proposed (Arras et al., 2007; Pre-
mebida et al., 2009; Navarro-Serment et al., 2010;
Spinello et al., 2011; Kidono et al., 2011; Maturana
and Scherer, 2015). Some researchers studied pedes-
trian detection using LIDAR, and various methods
have been proposed. For example, using state-of-the-
art Deep Learning, Maturana and Scherer proposed
VoxNet (Maturana and Scherer, 2015). They used a
three-dimensional convolutional neural network for
real-time object recognition. It uses an occupancy
grid constructed by three models as input because it
can distinguish free space and unknown space. How-
ever, VoxNet requires a dense point-cloud that is ob-
tained by the expensive Velodyne LIDAR
1
. For this
reason, it cannot be applied to pedestrian detection us-
ing cheap low-resolution LIDAR that can be utilized
in consumer vehicles.
The low-resolution LIDAR used in our proposed
method can scan objects by six horizontal scanning
lasers. Therefore, that sensor gives very low vertical
resolution, while it is much cheaper than the Velo-
dyne LIDAR. In addition, the number of lasers hitting
an object changes due to the distance between the LI-
DAR and the object. If the object is distant from the
LIDAR, only four or less scanning lasers can hit it.
In other words, the vertical resolution of the point-
cloud is four or less, which is not sufficient to repre-
sent the characteristics of pedestrians. For this reason,
pedestrian detection using low-resolution LIDAR be-
comes very difficult, and the conventional methods
using the Velodyne LIDAR cannot be applied. For
low-resolution point-clouds, Kidono et al. proposed
the slice feature and features related to the distribu-
1
http://velodynelidar.com/products.html
Tatebe Y., Deguchi D., Kawanishi Y., Ide I., Murase H. and Sakai U.
Can We Detect Pedestrians using Low-resolution LIDAR? - Integration of Multi-frame Point-clouds.
DOI: 10.5220/0006100901570164
In Proceedings of the 12th International Joint Conference on Computer Vision, Imaging and Computer Graphics Theory and Applications (VISIGRAPP 2017), pages 157-164
ISBN: 978-989-758-226-4
Copyright
c
2017 by SCITEPRESS – Science and Technology Publications, Lda. All rights reserved
157
First principal component (First-PC)
Second principal component (Second-PC)
ݖ
ݐ
ݐ
ݖ
ݖ
ݏ
ݓ
ଵ
ݓ
ଶ
ݓ
ଷ
PCA
ݖ
ݏ
݀
ଵ
݀
ଶ
݀
ଷ
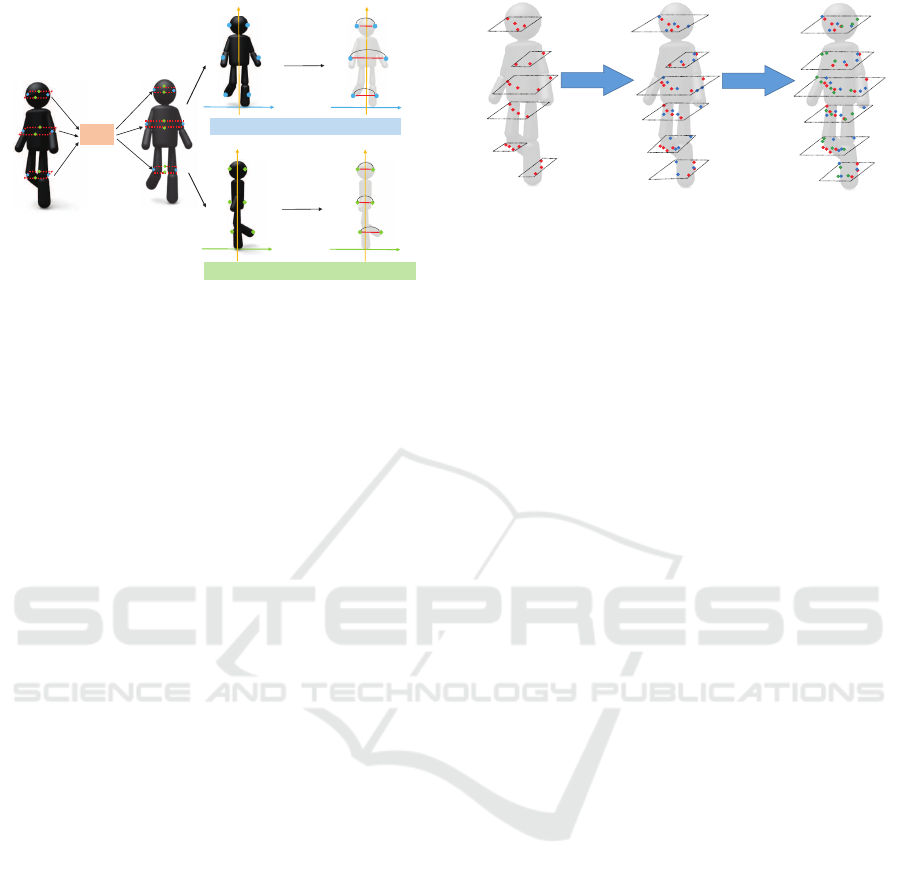
Figure 1: Extraction of the slice feature.
tion of reflection intensity (Kidono et al., 2011). The
former represents the rough shape of a pedestrian,
and the latter represent the differences in reflection
characteristics between a pedestrian and other objects.
Fig. 1 shows the procedure to extract the slice feature
when three horizontal scans hit the object. Three-
dimensional point-clouds obtained from LIDAR are
divided into slices at multiple heights, and the width
and the depth for each slice are calculated to repre-
sent the rough shape of a pedestrian. Since each ob-
ject has its owndistributionof reflection intensity, fea-
tures related to the distribution of reflection intensity
work well to classify a pedestrian and other objects.
By combining these features, the detection accuracy
of a distant pedestrian observed as a low-resolution
point-cloud can be improved. However, if a pedes-
trian is distant from the vehicle, the detection rate is
still low because its resolution is very low. In par-
ticular, it is very difficult to distinguish a pedestrian
from non-pedestrians such as poles, trees, road signs,
and so on, because their shapes are roughly similar
to that of a pedestrian. In addition, all features pro-
posed by Kidono et al. are extracted only from mo-
mentary information (a single frame). They do not
consider temporal information. Therefore, by using
multi-frame point-clouds, the proposed method tries
to detect a pedestrian in a low-resolution point-cloud
more accurately.
In this paper, we propose a pedestrian detection
method which improves the detection rate observed
as a low-resolution point-cloud by utilizing temporal
information. Our contributions and novelties of this
paper are as follows:
1. Density enhancement by integration of multi-
ple point-clouds: By integrating point-clouds ob-
tained from multiple frames, further details of
three-dimensional objects can be obtained be-
cause the point density increases.
2. Consideration of temporal changes of point-
Next frame
Next frame
Figure 2: Conceptual diagram of integrating point-clouds.
clouds: By considering temporal changes of
point-clouds, objects whose shapes do not change
(for example poles, trees, road signs, and so on),
can be distinguished.
Section 2 describes the proposed feature extrac-
tion method based on the above two ideas, Section 3
describes the proposed pedestrian detection method,
evaluation experiments are described in Section 4,
and discussions are made in Section 5. We conclude
this paper in Section 6.
2 FEATURE EXTRACTION
USING TEMPORAL
INFORMATION
In this paper, we propose two ideas in order to make
use of the temporal information of LIDAR data.
The first idea is to increase the density of point-
clouds by integrating multiple frames. In general, the
laser beam of a LIDAR hits different positions in each
frame even if scanning the same object because of rel-
ative movement between the LIDAR and objects. For
this reason, more detailed features can be obtained
by alignment of multi-frame point-clouds, as shown
in Figure 2. By using integrated multi-frame point-
clouds for feature extraction, it is expected to allow
obtaining more detailed features.
The second idea is to make use of temporal
changes of features extracted from LIDAR data. In
general, the vehicle will gradually approach objects
because the velocity of the vehicle equipped with LI-
DAR is usually faster than that of a pedestrian. More-
over, the density of three-dimensional point-clouds
obtained from LIDAR increases as objects become
closer. That is, the density of a newly obtained frame
could be higher than that of the older one. The scan-
ning angle also changes due to relative movement of
the vehicle and the objects. For this reason, differ-
ent information about the object can be obtained from
each frame.
Applying feature extraction based on the above
VISAPP 2017 - International Conference on Computer Vision Theory and Applications
158
two ideas, a pedestrian detection method using a low
resolution LIDAR is realized, taking temporal infor-
mation of LIDAR data into consideration. The fol-
lowing sections 2.1 and 2.2 describe the details for
extracting features from multi-frame point-clouds.
2.1 Feature Extraction using
Multi-frame Information
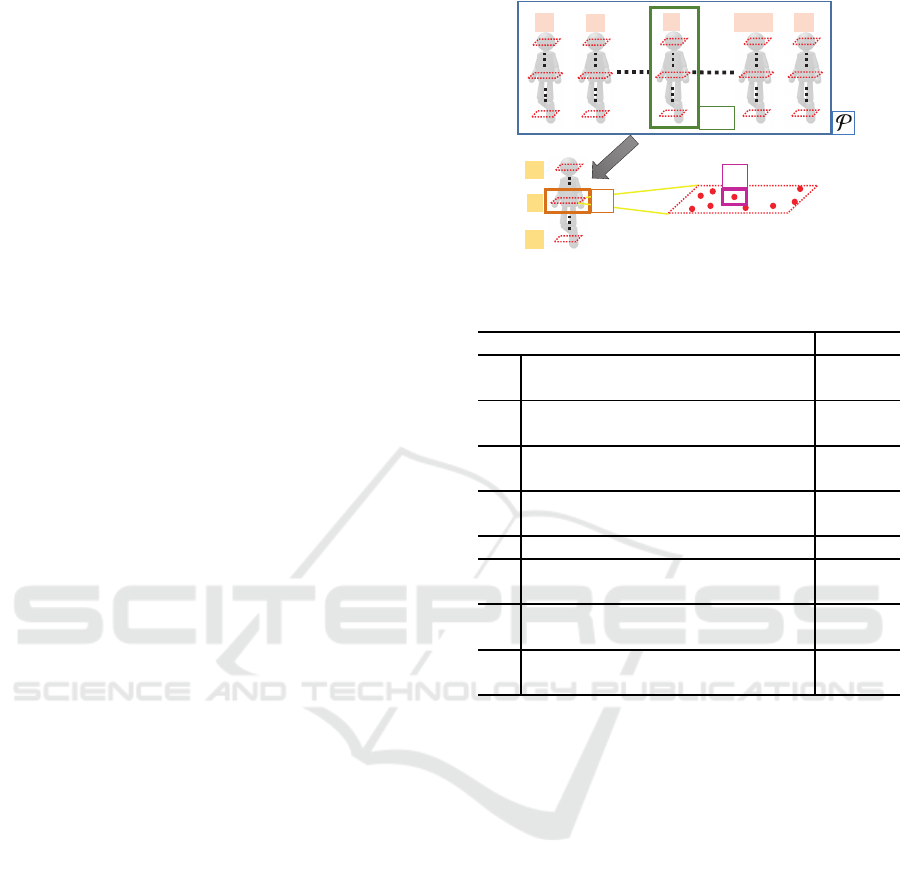
In this paper, L represents the number of horizontal
scans hitting an object.
A pedestrian candidate point-clouds sequence is
represented hierarchically as follows:
P = {P
P
P(t)}
T
t=1
, (1)
P
P
P(t) = {p
p
p
l
}
L
l=1
,
p
p
p
l
= {p
l,i
}
I
i=1
,
where P is a candidate point-clouds sequence with
a length of T frames, P
P
P(t) is the point-cloud of t-th
frame, p
p
p
l
is a point-cloud obtained by a l-th horizon-
tal scan, and p
l,i
is the i-th distant data of l-th scan
with coordinates (x, y, z) obtained from LIDAR. Fig-
ure 3 shows the graphical representation of this hierar-
chical structure. In the proposed method, features are
extracted from continuous M frames in the candidate
point-clouds sequence P. If P includes K frames, the
feature vectors are extracted K − M + 1 times for each
kind of feature as
f
f
f(j) = g
{P
P
P(k)}
j+M−1
k= j
, (2)
where f
f
f(j) is the j-th feature vector extracted from
P using M frames, and g
{P
P
P(k)}
j+M−1
k= j
is a feature
extraction function from multiple frames. Finally, K−
M + 1 feature vectors F
F
F = { f
f
f(j)}
K−M+1
j=1
are obtained
from P.
Features extracted from multi-frame point-clouds
are hereinafter referred to as “multi-frame features”,
and those extracted from each single-frame point-
cloud are referred to as “single-frame features”. There
are two benefits derived from extracting features from
multi-frame point-clouds: (1) the density of point-
clouds can be increased, and (2) the changes of the
data between frames can be taken into account.
2.2 Multi-frame Features
In this section, a method for extracting multi-frame
features from candidate point-clouds sequences are
described. Before extracting each feature, pre-
processing is performed. First, M-frame candidate
point-clouds are projected onto the road surface, and
Principal Component Analysis (PCA) is applied to
ͳ
ʹ
ݐ ܶ െ ͳ ܶ
P
ࡼሺݐሻ
ͳ
݈
ܮ
ǡ
Figure 3: Structure of the candidate point-clouds sequence.
Table 1: Multi-frame features and their dimensions.
Feature’s name Dim.
f
f
f
1
Approximated volume
of a point-cloud
L
f
f
f
2
Maximum value of normalized
reflection intensity voxel
4L
f
f
f
3
Mean of normalized
reflection intensity voxel
4L
f
f
f
4
Maximum value of
reflection intensity voxel
4L
f
f
f
5
Weighted mean of slice feature 2L
f
f
f
6
Weighted mean of
relative slice position
4(L− 1)
f
f
f
7
Weighted mean of maximum value
of normalized reflection intensity
1
f
f
f
8
Weighted mean of variance of
normalized reflection intensity
1
them in each frame. Next, the center-of-gravity of
each point-cloud is aligned to share the origin of the
axes composed of two principal components obtained
by PCA (the first principal component x represents
the width of a point-cloud, and the second principal
component y represents the depth of a point-cloud).
By this pre-processing, the orientation and the posi-
tion of the each point-cloud are normalized.
Next, the method for extracting multi-frame fea-
tures from the normalized point-clouds will be de-
scribed. Table 1 shows the list of features used in
the proposed method and the number of dimensions
of each feature when the candidate point-cloud is hit
by L horizontal scans.
Reflection Intensity. The reflection intensity that
appears in Table 1 is the maximum value of the wave-
form representing the intensity of the reflected light at
each point obtained from LIDAR. The reflected light
is attenuated in inverse proportion to the square of the
distance to each point. Because of this, the reflection
intensity value is preferably normalized by multiply-
ing by the square of distance. This normalized value
Can We Detect Pedestrians using Low-resolution LIDAR? - Integration of Multi-frame Point-clouds
159
ߠ
ଶǡଵ
ߠ
ଵǡ
ߠ
ଶǡ
ߠ
ଵǡଵ
ݖ
ݐ
ݐ
ݏ
PCA
ݖ ݖ
ݖ
ݏ
߮
ଶǡଵ
߮
ଵǡଵ
߮
ଶǡ
߮
ଵǡ
First-PC
Second-PC
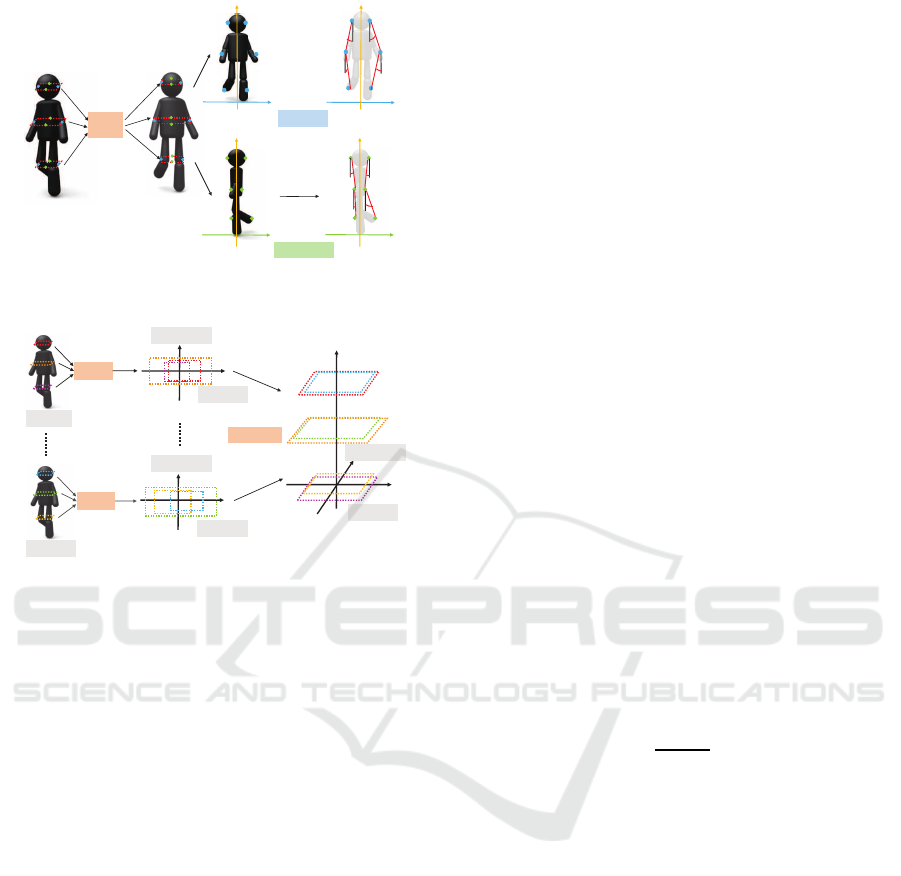
Figure 4: Extraction of the relative slice position (L = 3).
1-frame
PCA
Integrate
ܯ-frame
PCA
Second-PC
ݖ
First PC
Second-PC
First-PC
First-PC
Second-PC
Figure 5: Integration of the point-cloud (L = 3).
is called normalized reflection intensity.
Relative Slice Position. The relative slice position
that appears in Table 1 represents the outline of a can-
didate point-cloud. Figure 4 shows the procedure to
extract the relative slice position when L = 3. First,
after calculating a slice feature (Kidono et al., 2011),
the end points of the slices of each point-cloud p
p
p
l
(l = 1, 2, · · · , L) are connected in a straight line. Then,
angles of the straight lines with respect to the vertical
direction are obtained as the slice position. In other
words, by capturing relative position between slices,
the relative slice position represents the rough outline
of a pedestrian and other objects.
In this paper, features inspired by the first idea of
integration of point-clouds to increase their densities
(f
f
f
1
∼ f
f
f
4
), and the second idea of temporal change of
features ( f
f
f
5
∼ f
f
f
8
) are explored. The calculation pro-
cedure for each feature is described in the following
sections.
2.2.1 Integration of Point-clouds f
f
f
1
∼ f
f
f
4
In this section, multi-frame features extracted after
increasing the density of point-clouds by integrating
them based on the first idea are described. Here, the
procedure of integrating point-clouds from M frames
for multi-frame feature extraction is described. Fig-
ure 5 shows the procedure integrating point-clouds
from M frames when L = 3. Here, M point-clouds
go through pre-processing before being integrated by
overlapping them along their coordinate axes.
Two kinds of features are extracted from the point-
clouds obtained by the above integration procedure.
Each feature proposed here can use more points for
feature extraction than a single-frame feature such as
slice feature which only uses four points in a point-
cloud p
p
p
l
, because these features are extracted by using
point-clouds after their densities are increased.
• Approximated volume of a point-cloud: f
f
f
1
• Feature voxel: f
f
f
2
∼ f
f
f
4
However, these features can also be extracted from a
single-frame point-cloud. For convenience, the fol-
lowing explanation assumes that the extraction was
performed from a single-frame point-cloud.
Approximated Volume of a Point-Cloud (f
f
f
1
).
Approximated volume of a point-cloud represents the
shape of point-clouds by a relative ratio of the points
constituting each point-cloud p
p
p
l
of an object. The ex-
traction procedure for this feature is as follows. First,
c
l
(l = 1, 2, · · · , L), that is the number of points con-
stituting a point-cloud p
p
p
l
, are calculated. Next, this
number of points is normalized by the number of all
points from the input point-cloud, and the normalized
value is referred to as α
l
(l = 1,2, · · · , L). The entire
process is formulated as
α
l
=
c
l
P
L
l=1
c
l
. (3)
Finally, the vector of normalized points is obtained by
concatenating all the normalized values. The number
of dimensions of the feature vector will vary depend-
ing on the number of scan hits L of the input point-
cloud. One feature is extracted from the point-cloud
p
p
p
l
, and the feature vector f
f
f
1
which is L-dimensions,
is obtained as
f
f
f
1
= {α
1
, · · · ,α
l
, · · · , α
L
}.
Feature Voxel (f
f
f
2
∼ f
f
f
4
). The feature voxel is a
feature obtained by extracting a single-frame feature
such as the maximum value, or the mean of nor-
malized reflection intensity, or the maximum value
of reflection intensity from divided regions of point-
clouds. The following describes the procedure of ex-
tracting the feature voxel. First, point-clouds are di-
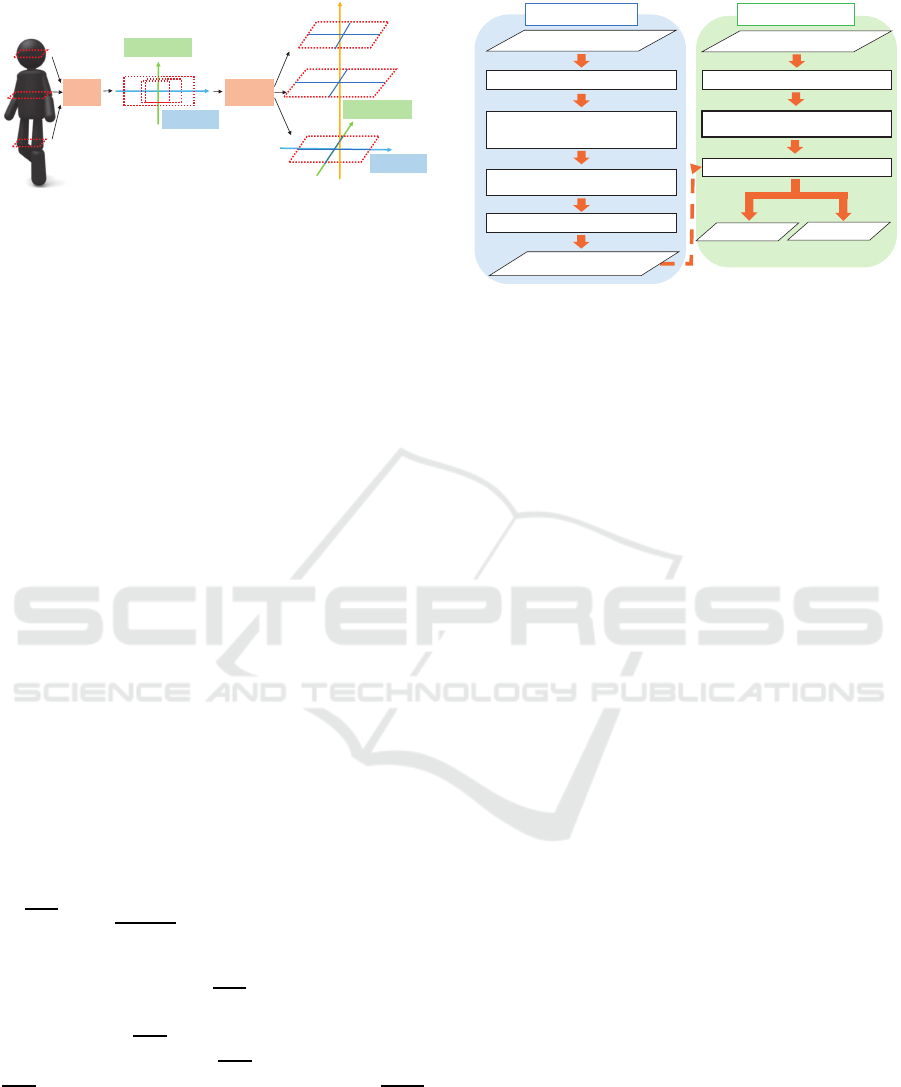
vided into sub-regions as shown in Figure 6.
Along coordinate axes obtained by pre-
processing, a point-cloud is divided into four
VISAPP 2017 - International Conference on Computer Vision Theory and Applications
160
݀
ଷǡଶ
ݖ
PCA Divide
݀
ଶǡଵ
݀
ଶǡଶ
݀
ଶǡସ
݀
ଶǡଷ
݀
ଷǡଵ
݀
ଷǡସ
݀
ଷǡଷ
݀
ଵǡଶ
݀
ଵǡସ
݀
ଵǡଷ
݀
ଵǡଵ
Second-PC
First-PC
Second-PC
First-PC
Figure 6: Division of a point-cloud for the extraction of
feature voxel (L = 3).
sub-regions at the center-of-gravity of each point-
cloud p
p
p
l
. By concatenating features extracted from
sub-regions, a feature vector is obtained. The
number of dimensions of the feature vector will
vary depending on the number of scan hits L of the
input point-cloud. Features (β
l,1
, β
l,2
, β
l,3
, β
l,4
) are
extracted from four sub-regions (d
l,1
, d
l,2
, d
l,3
, d
l,4
)
of the p
p
p
l
(l = 1,2, · · · , L). Here, β
l,1
, β
l,2
, β
l,3
, β
l,4
are
conventional features extracted from four sub-regions
of the p
p
p
l
. Thus, 4L dimensions feature vectors
f
f
f
2
∼ f
f
f
4
are obtained as
f
f
f
i
= {β
1,1
, β
1,2
, β
1,3
, β
1,4
, · · · , β
l,1
, β
l,2
, β
l,3
, β
l,4
,
· · · , β
L,1
, β
L,2
, β
L,3
, β
L,4
} (i = 2, 3, 4).
2.2.2 Temporal Changes of Point-clouds f
f
f
5
∼ f
f
f
8
In this section, to utilize the second idea of the tem-
poral changes of point-clouds, f
f
f
5
∼ f
f
f
8
are extracted
by calculating the weighted mean of some single-
frame features (slice feature, relative slice position,
maximum value of the normalized reflection inten-
sity, and variance of the normalized reflection inten-
sity) extracted from continuous M frames of P so that
the newer frame’s feature has a higher weight. The
weighted mean of continuous point-clouds from M
frames is calculated by a recurrence relation:
s
s
s(k) =
s
s
s(1) (k = 1),
0.4
s
s
s(k− 1)+ 0.6s
s
s(k) (k = 2, 3, · · · , M),
where s
s
s(k) is a single-frame feature extracted from
the k-th frame of P, and s
s
s(k) is the weighted mean
calculated from 1 to the k-th frames. For example, a
weighted mean s
s
s(2) is calculated by using s
s
s(1) and
s
s
s(2), and a weighted mean
s
s
s(3) is calculated by using
s
s
s(2) and s
s
s(3). This calculation is repeated until s
s
s(M),
and it becomes multi-frame feature vectors f
f
f
5
∼ f
f
f
8
.
The dimensionality of the final feature vector is equal
to that of the original single-frame features, as shown
in Table 1.
Training phase Detection phase
Feature extraction
Classifier construction
3D objects detection
Manual labeling
(Pedestrian / Others)
Classification
Feature extraction
3D objects detection
LIDAR point clouds
Pedestrian classifier
Pedestrian
LIDAR point clouds
Others
Figure 7: Process flow of the proposed method.
3 PEDESTRIAN DETECTION
USING A LOW-RESOLUTION
LIDAR
Figure 7 shows the process flow of the proposed
method. The proposed method is the training phase
for building a classifier to be used for pedestrian de-
tection in advance, and the detection phase for detect-
ing pedestrians from the LIDAR data using the clas-
sifier constructed in the training phase.
3.1 Training Phase
3.1.1 3D Object Detection and Manual Labeling
The proposed method extracts point-clouds of three-
dimensional objects from LIDAR data by applying a
three-dimensional object detection and tracking algo-
rithm (Ogawa et al., 2011) for LIDAR data collected
in real-world environments. In this paper, the point-
clouds obtained by three-dimensional object detection
are regarded as the candidate point-clouds and a series
of them are regarded as the candidate point-clouds se-
quence. The candidate point-clouds contained pedes-
trians, trees, poles, traffic signs, and so on. These
point-clouds are labeled as “pedestrian” or “other ob-
jects” manually.
3.1.2 Feature Extraction
The proposed method extracts features related to
the shape and the reflection intensity of three-
dimensional objects described in Section 2.2 from
successive multi-frame point-clouds in a series of
point-clouds obtained by tracking three-dimensional
objects. The proposed feature extraction method is
based on two ideas using the temporal information of
multi-frame point-clouds.
Can We Detect Pedestrians using Low-resolution LIDAR? - Integration of Multi-frame Point-clouds
161
3.1.3 Classifier Construction
In the proposed method, a pedestrian classifier is
constructed by inputting the features calculated from
point-clouds of pedestrians (positive samples) and
other objects (negative samples) to kernel-SVM,
which generally shows high performance. Here, the
RBF (Radial Basis Function) kernel is used.
3.2 Detection Phase
3.2.1 3D Object Detection
Candidate point-clouds sequences are obtained by ap-
plying the same three-dimensional object detection
and tracking algorithm (Ogawa et al., 2011) on point-
clouds obtained from LIDAR.
3.2.2 Feature Extraction
The same features as the training phase are extracted
from candidate point-clouds sequences.
3.2.3 Classification
By inputting these features to the classifier con-
structed in the training phase, the candidate point-
clouds are classified as either a pedestrian or not. This
output is the detection result of the proposed method.
4 EXPERIMENTS
To confirm the effectiveness of the proposed method
against pedestrian detection using a low-resolution
LIDAR, experiments using in-vehicle low-resolution
LIDAR point-clouds taken in real-world environ-
ments were conducted. The low-resolution LIDAR
used in the experiments was equipped on the top of
the room mirror. The LIDAR could obtain depth data
at 6 vertical directions and 401 horizontal directions
at 10 fps. The vertical detection angle was 6 degrees
(1 degree pitch), and the horizontal detection angle
was 40 degrees (0.1 degree pitch).
4.1 Experimental Procedure
In this experiment, point-clouds of pedestrians and
other objects were collected by the low-resolution LI-
DAR in real-world environments. By applying the
three-dimensional object detection and tracking algo-
rithm (Ogawa et al., 2011) to the collected data, the
candidate point-clouds sequences were obtained.
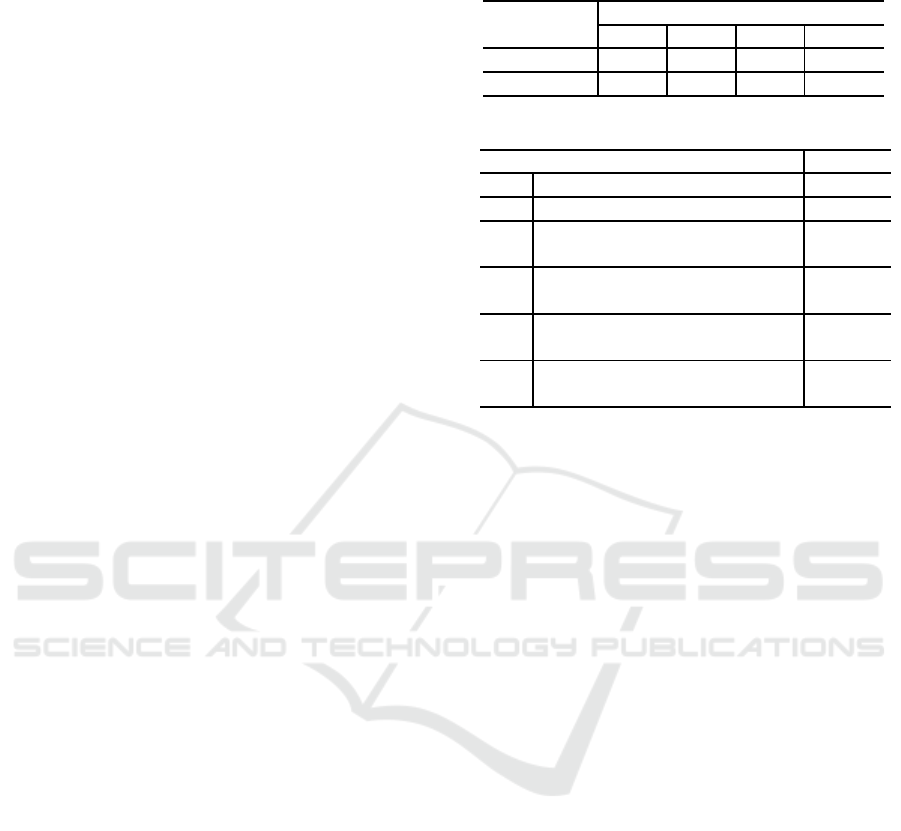
Table 2: Number of point-clouds for each number of scan
hits L.
Number of samples by L
L = 3 L = 4 L = 5 L = 6
Pedestrians 1,002 5,269 6,934 8,189
Others 5,726 5,904 7,236 13,535
Table 3: Single-frame features and their dimensions.
Feature’s name Dim.
f
f
f
9
Slice feature 2L
f
f
f
10
Relative slice position 4(L− 1)
f
f
f
11
Maximum value of normalized
reflection intensity
1
f
f
f
12
Mean of normalized
reflection intensity
1
f
f
f
13
Variance of normalized
reflection intensity
1
f
f
f
14
Maximum value of
reflection intensity
1
All positive samples and hard negative samples
(pole, tree and so on) extracted from these sequences
were input of the proposed method. Table 2 shows
the result of aggregating the data by each number
of scan hits L used in this experiment. Dividing the
candidate point-clouds sequences by L, the perfor-
mance of the proposed method was evaluated by five-
fold cross-validation. To ensure fair comparison, the
point-clouds obtained from the same object were not
included in both training samples and test samples.
We evaluated the proposed method by using ROC
(Receiver Operating Characteristic) curve and its
AUC (Area Under the Curve). In this experiment,
three methods, that is the proposed method 1, the pro-
posed method 2 and the comparison method, were
evaluated. The proposed method 1 used the multi-
frame feature f
f
f
1
∼ f
f
f
4
extracted from three frames
(M = 3) for pedestrian classification, and the proposed
method 2 used the multi-frame feature f
f
f
1
∼ f
f
f
8
ex-
tracted from three frames (M = 3) for pedestrian clas-
sification. This method detected pedestrians every
three frames because three frames were required for
the multi-frame feature extraction. For the compar-
ison method, the average of three ROC curves and
AUCs obtained in each of the three frames were used
for the evaluation. In the comparisonmethod, conven-
tional single-frame features were used for the classifi-
cation (Kidono et al., 2011). Table 3 shows the list of
single-frame features, and Table 4 shows the features
used in each method. We implemented feature extrac-
tion and classification methods using MATLAB, and
used a conventional PC (Intel Core i7 4790 3.6GHz)
in the experiment.
VISAPP 2017 - International Conference on Computer Vision Theory and Applications
162
0.00 0.05 0.10 0.15 0.20 0.25 0.30
False Positive Rate
0.0
0.1
0.2
0.3
0.4
0.5
0.6
0.7
0.8
0.9
1.0
True Positive Rate
Proposed method 1
Proposed method 2
Comparison method
(a) L = 3.
0.00 0.05 0.10 0.15 0.20 0.25 0.30
False Positive Rate
0.0
0.1
0.2
0.3
0.4
0.5
0.6
0.7
0.8
0.9
1.0
True Positive Rate
Proposed method 1
Proposed method 2
Comparison method
(b) L = 4.
0.00 0.05 0.10 0.15 0.20 0.25 0.30
False Positive Rate
0.0
0.1
0.2
0.3
0.4
0.5
0.6
0.7
0.8
0.9
1.0
True Positive Rate
Proposed method 1
Proposed method 2
Comparison method
(c) L = 5.
0.00 0.05 0.10 0.15 0.20 0.25 0.30
False Positive Rate
0.0
0.1
0.2
0.3
0.4
0.5
0.6
0.7
0.8
0.9
1.0
True Positive Rate
Proposed method 1
Proposed method 2
Comparison method
(d) L = 6.
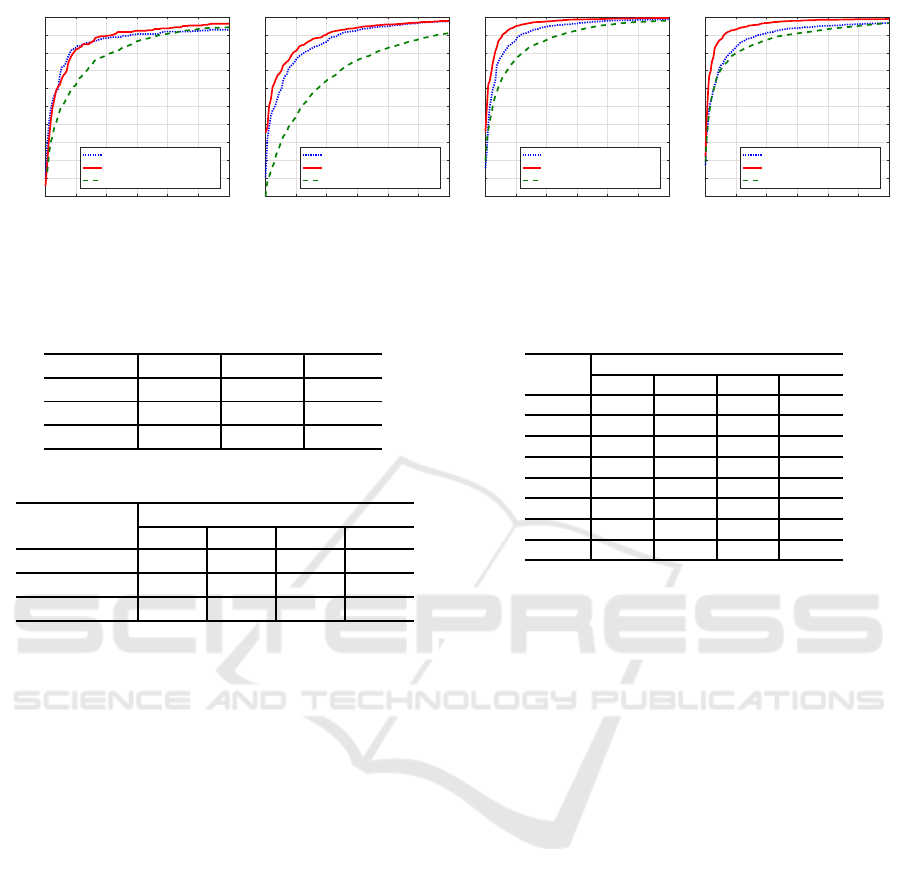
Figure 8: ROC curves of each method by the number of scan hits L.
Table 4: Evaluated methods and features.
Prop. 1 Prop. 2 Comp.
f
f
f
1
∼ f
f
f
4
X X
f
f
f
5
∼ f
f
f
8
X
f
f
f
9
∼ f
f
f
14
X
Table 5: AUC of each method.
Method
AUC by L
L = 3 L = 4 L = 5 L = 6
Proposed 1 0.937 0.953 0.971 0.960
Proposed 2 0.952 0.963 0.986 0.983
Comparison 0.926 0.891 0.958 0.954
4.2 Results & Discussions
Figures 8(a)–8(d) show the ROC curves of each
method obtained in this experiment. When False Pos-
itive Rate (FPR) was close to 5%, True Positive Rate
(TPR) of the proposed methods 1 and 2 were higher
than that of the comparison method for all numbers of
scan hits L. Note that the detection rate in low FPR
is important for pedestrian detection, where the pro-
posed method outperforms the comparative method.
In addition, the proposed method 2 had higher detec-
tion accuracy than that of the proposed method 1.
Table 5 shows the AUC obtained in this experi-
ment by each method. The AUC values of the pro-
posed method 2 were higher than those of the pro-
posed method 1 and the comparison method for all L,
showing that the proposed method 2 is superior than
the two other methods in overall performance.
The computation time of feature extraction and
classification for each candidate are 16.4ms and
1.6 ms, respectively.
4.2.1 Comparison of Detection Accuracy
As shown in Figures 8(a)–8(d), by using a combina-
tion of features discussed in this paper, the proposed
Table 6: Rank of greedy algorithm.
Order
Rank by L
L = 3 L = 4 L = 5 L = 6
1 f
f
f
2
f
f
f
7
f
f
f
4
f
f
f
4
2 f
f
f
1
f
f
f
1
f
f
f
5
f
f
f
6
3 f
f
f
4
f
f
f
2
f
f
f
6
f
f
f
5
4 f
f
f
6
f
f
f
4
f
f
f
1
f
f
f
1
5 f
f
f
8
f
f
f
3
f
f
f
7
f
f
f
2
6 f
f
f
3
f
f
f
5
f
f
f
2
f
f
f
3
7 f
f
f
5
f
f
f
6
f
f
f
3
f
f
f
8
8 f
f
f
7
f
f
f
8
f
f
f
8
f
f
f
7
method could detect pedestrians more accurately than
using conventional single-frame features.
Furthermore, the proposed method 1 using f
f
f
1
∼
f
f
f
4
based on point-clouds density enhancement much
improvedthe pedestrian detection accuracy especially
in a very low-resolution condition (L = 3, 4). There-
fore, idea 1 of integrating point-clouds to increase
its density was effective when the point-clouds den-
sity was very low. On the other hand, the proposed
method 2 could detect pedestrians much more accu-
rately than the proposed method 1 in relatively high-
resolution condition (L = 5, 6). When L = 5 and 6,
more detailed shape and reflection intensity of objects
could be obtained by LIDAR point-clouds, so f
f
f
5
∼ f
f
f
8
based on the temporal change worked well.
4.2.2 Contribution Analysis of Features
To analyze the contribution of each feature towards
the detection accuracy, the ranking of all features was
calculated by using the greedy algorithm. Table 6
shows the selection order (rank) of features by the
greedy algorithm. As shown in Table 6, the order was
different for each number of scan hits L.
Table 7 shows a rearranged version of Table 6
according to the proposed ideas (idea 1: integration
of point-clouds to increase their density and idea 2:
temporal changes of features). In Table 7, the rank
of the features based on idea 1 was relatively higher
than that of the features based on idea 2. This trend
Can We Detect Pedestrians using Low-resolution LIDAR? - Integration of Multi-frame Point-clouds
163
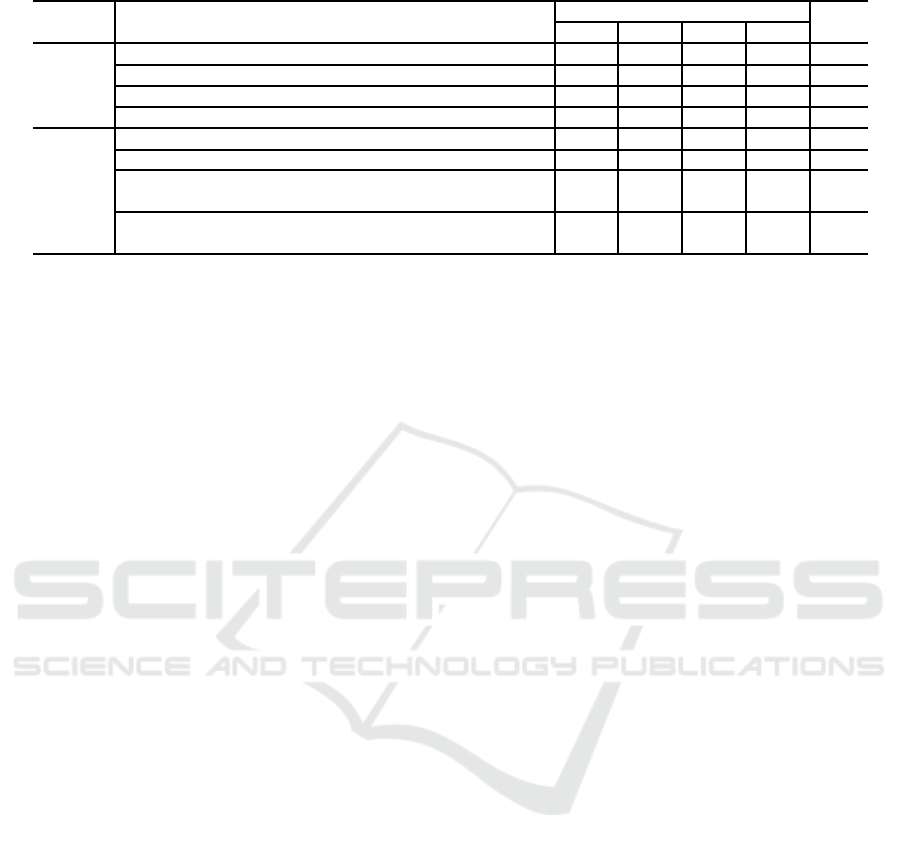
Table 7: Rank of greedy algorithm (rearranged according to the fundamental ideas).
Ideas Feature’s name
Rank
Ave.
L = 3 L = 4 L = 5 L = 6
Density
Maximum value of reflection intensity voxel 3 4 1 1 2.3
Approximated volume of a point-cloud 2 2 4 4 3.0
Maximum value of normalized reflection intensity voxel 1 3 6 5 3.8
Mean of normalized reflection intensity voxel 6 5 7 6 6.0
Change
Weighted mean of relative slice position 4 7 3 2 4.0
Weighted mean of slice feature 7 6 2 3 4.5
Weighted mean of maximum value of normalized
reflection intensity
8 1 5 8 5.5
Weighted mean of variance of normalized
reflection intensity
5 8 8 7 7.0
suggests that the idea 1 was more effective than the
idea 2. This is because it is likely that the move-
ment of pedestrians and vehicles in the range of three
frames used for multi-frame feature extraction was
very small.
5 CONCLUSIONS
In this paper, we proposed a pedestrian detection
method using multi-frame features extracted from
low-resolution LIDAR data. We introduced the multi-
frame features extracted by combining point-clouds
over multiple frames to increase its resolution and
capturing temporal changes of the point-clouds. The
proposed method detected pedestrians using the clas-
sifier trained by inputting the LIDAR data divided by
their numbers of scan hits L.
Using the data collected in real-world environ-
ments, experiments showed the proposed method us-
ing a combination of proposed multi-frame features,
could detect pedestrians more accurately than using
conventional single-frame features. We also analyzed
the contribution of each feature to the performance
improvement. The results showed the idea of integrat-
ing point-cloudsto increase their density was effective
for pedestrian detection from low resolution LIDAR.
Future work includes improvement of the pro-
posed method considering the combination of single-
frame features and multi-frame features simultane-
ously, construction of the classifier using partial AUC
(Narasimhan and Agarwal, 2013), and comparison of
features learned by Deep Learning.
ACKNOWLEDGEMENTS
Parts of this research were supported by MEXT,
Grant-in-Aid for Scientific Research.
REFERENCES
World Health Organization. (2015). Global status report on
road safety 2015.
Arras, K. O., Mozos, O. M., and Burgard, W. (Apr. 2007).
Using boosted features for the detection of people in
2D range data. In Proc. 2007 IEEE Int. Conf. on
Robotics and Automation, pages 3402–3407.
Kidono, K., Miyasaka, T., Watanabe, A., Naito, T., and
Miura, J. (June 2011). Pedestrian recognition using
high-definition LIDAR. In Proc. 2011 IEEE Intelli-
gent Vehicles Symposium, pages 405–410.
Maturana, D. and Scherer, S. (Sept. 2015). Voxnet: A
3D convolutional neural network for real-time object
recognition. In Proc. 2015 IEEE/RSJ Int. Conf. on In-
telligent Robots and Systems, pages 922–928.
Narasimhan, H. and Agarwal, S. (Aug. 2013). SVM pAUC
tight: A new support vector method for optimizing
partial AUC based on a tight convex upper bound. In
Proc. 19th ACM SIGKDD Int. Conf. on Knowledge
Discovery and Data Mining, pages 167–175.
Navarro-Serment, L. E., Mertz, C., and Hebert, M. (Oct.
2010). Pedestiran detection and tracking using three-
dimensional LADAR data. Int. J. of Robotics Re-
search, vol.29, no.12, pages 1516–1528.
Ogawa, T., Sakai, H., Suzuki, Y., Takagi, K., and Morikawa,
K. (June 2011). Pedestrian detection and tracking
using in-vehicle LIDAR for automotive application.
In Proc. 2011 IEEE Intelligent Vehicles Symposium,
pages 734–739.
Premebida, C., Ludwig, O., and Nunes, U. (Oct. 2009). Ex-
ploiting LIDAR-based features on pedestrian detec-
tion in urban scenarios. In Proc. 2009 IEEE Int. Conf.
on Intelligent Transportation Systems, pages 1–6.
Shroff, D., Nangalia, H., Metawala, A., Parulekar, M., and
Padte, V. (Jan. 2013). Dynamic matrix and model pre-
dictive control for a semi-auto pilot car. In Proc. 2013
IEEE Int. Conf. on Advances in Technology and Engi-
neering, pages 1–5.
Spinello, L., Luber, M., and Arras, K. O. (May 2011).
Tracking people in 3D using a bottom-up top-down
detector. In Proc. 2011 IEEE Int. Conf. on Robotics
and Automation, pages 1304–1310.
VISAPP 2017 - International Conference on Computer Vision Theory and Applications
164
