
Design a Study for Determining Labour Productivity Standard in
Canadian Armed Forces Food Services
Manchun Fang
Centre of Operational Research and Analysis, Defence Research Development Canada,
National Defence Canada, 101 Colonel By Drive, Ottawa, Canada
Keywords: CAF Food Services, Performance Measure, Labour Productivity, Study Design.
Abstract: Canadian Armed Forces (CAF) Food Services recently implemented a standardized menu at all static
service locations. Within this new regime, CAF Food Services requires a standard against which they can
measure labour performance and use to inform future rationalization of staffing. To start, a pilot study was
conducted in February and March 2015 to collect labour performance data. In this paper, we review the
results from the pilot study. Due to issues identified with the pilot study, this paper also proposes a revised
design and analytical approach for a follow-on study.
1 INTRODUCTION
Canadian Armed Forces (CAF) Food Services is a
decentralized function with an estimated value
exceeding $150 Million in cost per year for fresh
feeding. As functional authority for CAF Food
Services, Strategic Joint Staff (SJS) Directorate
Food Services recently implemented a three-week
National Standardized Cycle Menu (NSCM) on all
static feeding facilities, which has been rolled out
across all CAF static feeding facilities since the
beginning of November 2014. However, currently
CAF Food Services does not have a labour
performance standard that can be used to measure
and compare the labour performance in CAF Food
Services (Mat J4 2014).
Unlike most of other food industry, the CAF
Food Services is not profit driven and fulfilling the
operational needs is its first priority. Determining a
CAF specific labour performance standard for CAF
Food Services is significant. As a start, SJS
Directorate Food Services planned a pilot study and
collected labour performance data in February and
March 2015. Directorate Materiel Group
Operational Research (DMGOR) was later tasked to
provide analytical support. The objective of this
work is to review the results from the pilot study.
Furthermore, due to the issues identified with the
pilot study, the work is also used to provide SJS
Directorate Food Services a more rigorous study
design and analytical approach for a future follow-
on study.
2 RESULTS FROM THE PILOT
STUDY
2.1 Data Collection
It is noted here that Operational Research and
Analysis was not significantly consulted to set up of
the pilot study including the aspects, e.g., the target
determination, sample selection, and the sample size
determination. In addition, the grouping of facilities
and the order of visits were determined by financial
consideration, i.e., minimizing the travel cost, not by
statistical consideration. Furthermore, the choices of
the dates were not randomly selected and the
facilities were aware of the dates of visits prior to
the data collection.
An existing Excel-based Labour Performance
Data Collection Tool (Whiting 2015) was used in
the data collection process. Annex A Tables A1
provides a summary of data obtained from the pilot
study.
2.2 Data Exploration
This section will summarize the results from the
pilot study. Although the design of the pilot study is
Fang M.
Design a Study for Determining Labour Productivity Standard in Canadian Armed Forces Food Services.
DOI: 10.5220/0006110702190227
In Proceedings of the 6th International Conference on Operations Research and Enterprise Systems (ICORES 2017), pages 219-227
ISBN: 978-989-758-218-9
Copyright
c
2017 by SCITEPRESS – Science and Technology Publications, Lda. All rights reserved
219
not ideal, it provides useful prior information needed
for designing a more rigorous future follow-on
study.
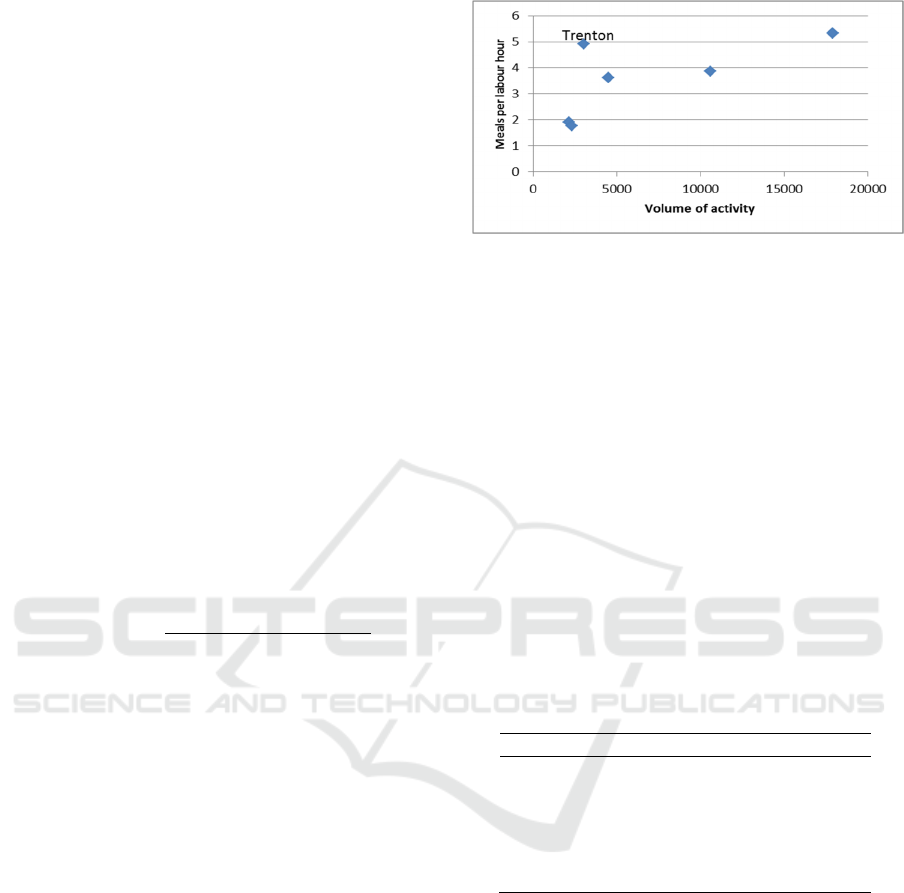
Volume of Activity
In CAF Food Services, Volume of Activity is used
to record the number of meals (including breakfast,
lunch and dinner) served in a facility during a fix
time period (e.g., daily, monthly or yearly). For the
pilot study, Volume of Activity records the total
number of meals served during the pilot study
period, i.e., a five day period. The Volume of
Activity for five days ranges from 2,161, 2,335,
3,037, 4,514, 10,613 and 17,883 for Halifax,
Esquimalt, Trenton, Wainwright, Gagetown and
Saint-Jean respectively.
Number of Meals per Labour Hour
The number of meals per labour hour is calculated
by dividing the total number of meals served by the
total number of labour hours spent including labour
hours spent by both military and civilian employees
see eqn. (1):
(1)
There is a large variation on the number of meals
per labour hour across facilities calculated, which
are 1.8, 1.9, 3.6, 3.9, 4.3 and 5.3 for Esquimalt,
Halifax, Wainwright, Gagetown, Trenton and Saint-
Jean respectively (data from Table A.1).
The Volume of Activity is reported as the most
important factor that has impact on the labour
productivity (Tremblay 2004). The data from the
pilot study also suggests that except for Trenton
(Different from the other facilities, Trenton also
provides flight feeding which requires less time on
serving the food than the in person serving.), there is
a relationship between the Volume of Activity and
the Number of Meals Per Labour Hour: i.e., the
greater the Volume of Activity, the greater the
Number of Meals Per Labour Hour (which is
consistent with the finding in Tremblay 2004) (See
Figure 1).
Figure 1: Volume of activity vs. number of meals per
labour hour.
Labour Cost per Meal
Table 1 shows that labour cost per meal varies
significantly across facilities, which is $3.85, $4.83,
$6.22, $6.89, $13.35 and $13.57 for Saint-Jean,
Trenton, Gagetown, Wainwright, Halifax and
Esquimalt respectively. Some facilities have much
higher labour costs per meal than the others, e.g.,
Halifax and Esquimalt. It needs to be noted that the
food material costs and non-food costs (e.g., cost for
paper plates) are not included in these figures.
Therefore the total cost per meal (including all
labour, food material and non-food costs) should be
even higher. As such, the total cost per meal in some
facilities apparently will not be recoupable by the
payments from the diners.
Table 1: Labour cost per meal by facility.
Facility
# of Total Labour
Saint-Jean 17,883 $68,775 $3.85
Trenton 3,037 $14,678 $4.83
Gagetown 10,613 $65,972 $6.22
Wainwright 4,514 $31,117 $6.89
Halifax 2,161 $28,855 $13.35
Esquimalt 2,335 $31,686 $13.57
SJS Directorate Food Services reported that the
labour rate per hour is the same across CAF Food
Services facilities. Therefore, the labour cost per
meal is mainly influenced by the labour
productivity, i.e., the number of meals per labour
hour. It is intuitive that the more meals per labour
hour produced the less labour cost per meal. Figure
2 shows this negative correlation between the
number of meals per labour hour and labour cost per
meal.
ICORES 2017 - 6th International Conference on Operations Research and Enterprise Systems
220
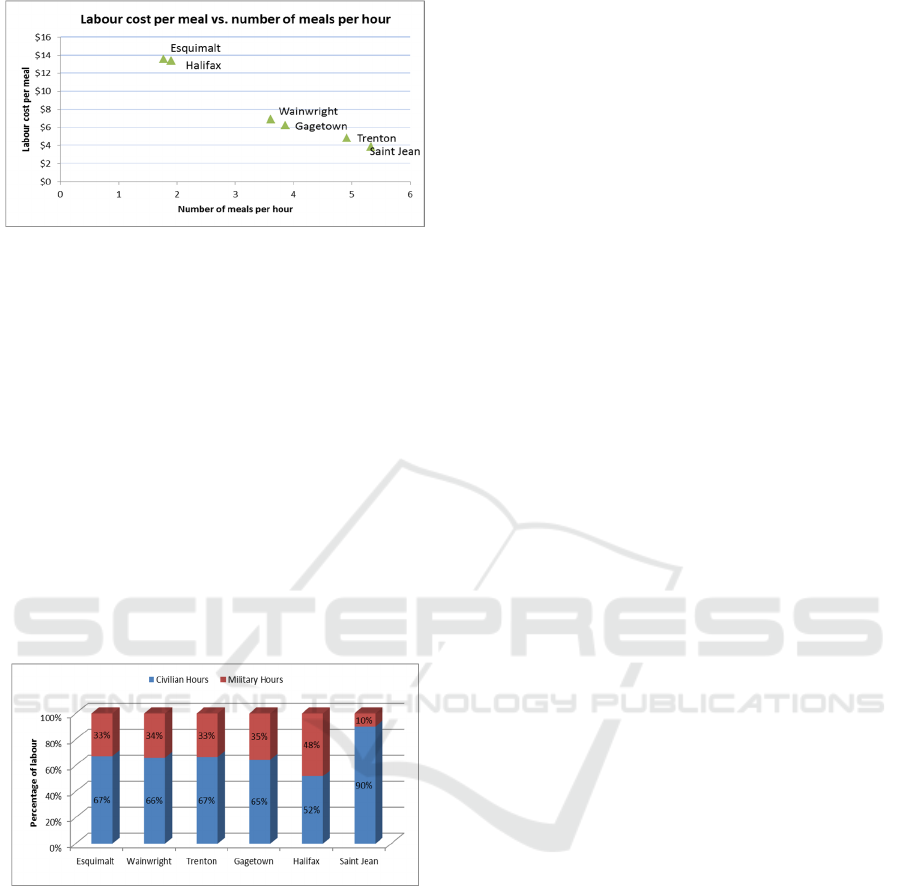
Figure 2: Labour cost per labour hour and number of
meals per labour hour.
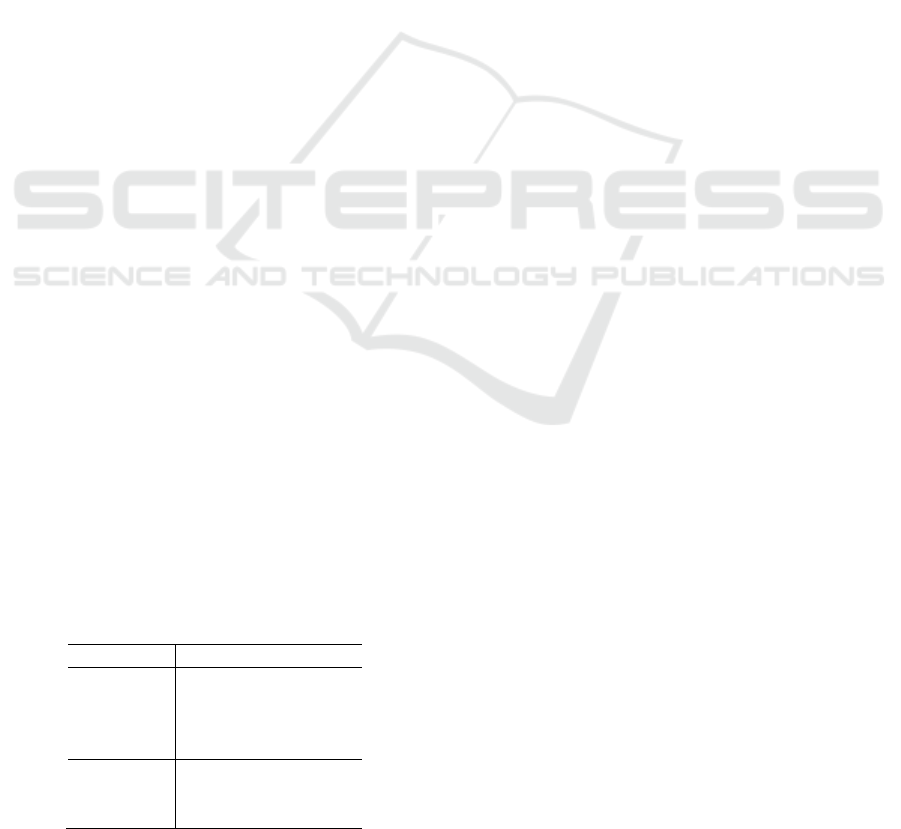
Additionally, since salary difference exists
among different ranks of military cooks and between
military and civilian cooks, the labour cost per meal
will also be influenced by rank composition of
military cooks and civilian and military labour ratio
in the facility (see Figure 3).
Figure 3 shows the percentage of civilian hours
versus military hours in preparing the meals across
facilities. The multiple proportion test shows there is
a significant difference (p-value<0.01) on civilian
military hours ratios among facilities. The figures
for Halifax and Saint-Jean facilities are significantly
different; Halifax uses the least civilian labour
(52%) and Saint-Jean uses the most civilian labour
(90%) among all six facilities.
Figure 3: Percentage of civilian vs. military hours spent on
preparing meals in the six facilities.
All these data have been incorporated in the
calculation of the labour cost per meal in the pilot
study.
3 STUDY DESIGN
Due to the issues identified about the approach taken
to conduct the pilot study, a new study and its
alternative details in study design and method of
analysis are proposed.
3.1 Objective of the Study
The study design is driven and determined by the
objective of the study. Ultimately, CAF Food
Services would like to establish a labour
performance standard that can be used to measure
and compare the measure performance and inform
food services staffing. For this study, as requested, it
will only focus on the quantitative side of the labour
performance, i.e., the labour productivity.
3.2 Two Labour Performance
Standards Should Be Established
With regard to the labour productivity, the first
question is: can we set up a uniform labour
productivity standard for all facilities in CAF Food
Services?
Due to the big variation currently existing on the
labour productivity across facilities (as shown in
Figure 1), we believe it does not make sense to
establish just one labour productivity standard at this
time. Based on the data from the pilot study, it is
recommended two labour performance standards be
established at first:
one labour performance standard for small
facilities (in terms of facilities with small
Volumes of Activity); and
one for large facilities (in terms of facilities
with large Volumes of Activity)
3.3 Choice of Target Population
The target population is the population about which
information is wanted (Cochran 1977). The choice
of the target population should be determined by the
objective of the study. The choice of target
population will profoundly affect the statistics that
result (Lohr & Stratton 2010). Should the target
population be composed of all feeding facilities in
CAF Food Services? The answer is “No”. The
reason is because the objective of this study is to
develop a labour performance standard for the CAF
Food Services not just to get an overall labour
performance measure for CAF Food Services.
Rogers 2014 provides a clear definition of
“standard”: “Standard can refer to an aspect of
performance, or to the level of performance, or to a
combination of both. These standards can be
considered minimum levels required, or levels
required to be considered best practice.” In our
context, the labour performance standard here refer
to the aspect of labour productivity and the level of
the labour productivity; and the standard is
Design a Study for Determining Labour Productivity Standard in Canadian Armed Forces Food Services
221
considered as the best practice in CAF Food
Services. Therefore, to determine the labour
productivity standard for the CAF Food Services, we
do not recommend using the entire CAF feeding
facilities as the target population; instead we
recommend the target population consist of facilities
which represent the best practice in CAF Food
Services in terms of labour performance, i.e., labour
productivity in this study.
Therefore, based on military knowledge about
CAF Food Services, SJS Food Service provided the
following seven facilities to form the target
population, i.e., Saint-Jean, Gagetown, Trenton,
Wainwright, Shilo, Cold Lake and Bagotville. These
facilities were chosen based on the following
considerations:
examples of CAF feeding facilities with good
labour performance, from which the labour
performance standard can be drawn from;
regional consideration (i.e., west, central and
east); and
choice of both operational and training
facilities.
3.4 Suggested Grouping of Facilities
According to the annual Volume of Activity for
FY14/15 obtained from (Whiting and St-Cyr 2015 &
Whiting 2015), these seven facilities have been
classified into two groups (Table 2), i.e., small and
large facility groups. The facility is classified as a
small facility if its annual Volume of Activity is less
than 100,000 meal day (Meal day is another way to
measure the Volume of Activity. One meal day is
equal to three meals.); while the facility is classified
as a large facility if its annual Volume of Activity is
equal to or greater than 100,000 meal days (Record
of Discussion May 2015). Based on these criteria,
Saint-Jean, Gagetown, Trenton and Wainwright are
classified as large facilities while Shilo, Cold Lake
and Bagotville are classified as small facilities.
As described in Section 3.2, two labour
performance standards should be established for
these two groups respectively.
Table 2: Grouping of seven facilities.
Facility Meal days Grouping
Gagetown 267,514 Large
Trenton 127,044 Large
Wainwright 136,269 Large
Saint-Jean 347,940 Large
Shilo 57,590 Small
Cold Lake 69,180 Small
Bagotville 37,260 Small
3.5 Choice of Measure
We agree with (Tremblay 2014) that labour
productivity can be used as a quantitative measure of
food service performance, and the number of meals
per labour hour can be used to measure labour
productivity. In addition to quantitative measures,
qualitative measurer should also be included in
developing the labour performance standard for
CAF Food Services, e.g., customer satisfaction
(mentioned in CAF Food Services Menu 2013 as
well). Both quantitative and qualitative measures
together should form a holistic view of labour
performance in CAF Food Services. However due to
the scope of this study, it was agreed that only the
quantitative side of the labour performance is
investigated in this study.
According to (River 2000), productivity is
defined as a relationship between the total amount of
goods or services being produced (outputs) and the
organizational resources needed to produce them
(inputs). The labour productivity here, i.e., the
number of meals per labour hour, is calculated (see
eqn. (1)) by dividing the total number of meals by
the total number of labour hours spent.
3.6 Suggested Method for Considering
NSCM and How to Define the
Sampling Frame
CAF Food Services cannot easily change the number
of staff in facility solely when the menu changes.
NSCM is a three-week cycle menu; hence each
cycle is composed of 21 days. Over the span of one
year, this cycle will be repeated just a bit more than
17 times. To simplify the study and to take budget
constraints into consideration, it should be assumed
that the 17 cycles are the same. Therefore, we should
be able to focus the future labour study within one
cycle. Hence, a random sample should be drawn
from 21 days, just a full cycle of NSCM; and the
order and dates of on-site visits should be randomly
selected.
The sampling frame for this study should be a
list of consecutive dates between the study starting
date and the 21
st
date that follows the starting date.
Once SJS Directorate Food Services determines the
start date of the data collection for the future labour
study, the sampling frame can be determined
immediately.
ICORES 2017 - 6th International Conference on Operations Research and Enterprise Systems
222

3.7 Suggested Sampling Method
In order to reflect real operations, randomization of
the dates for on-site visits is necessary and
important. The dates should be randomly selected
and should not be revealed to the facility in advance.
Further exploration shows the variation within
each individual facility on labour productivity is
smaller relatively to the variation between facilities.
One-way analysis of variance (ANOVA) was used
to test the between and within facility variation on
labour productivity (See Table 3), i.e., number of
meals per labour hour (data from Table A).
Therefore, instead of a simple random sampling,
a stratified random sampling method can be used.
Each facility should be treated as a stratum in both
small and large facility groups. The stratified
random sampling should be conducted in the
following steps:
First, clearly specify the strata (each facility is
treated as a stratum);
Then, within each stratum (i.e., each facility),
use a simple random sampling method to
select a random sample of days from the
established sampling frame for the on-site
visit;
Collect data from each visit and calculate the
labour productivity for each facility; and
Pool the results from all facilities (i.e., all
strata) within the group (large or small) to get
an overall labour productivity measure for the
group.
The advantages of this stratified random
sampling method are:
separate estimates can be obtained for each
stratum (i.e., each individual facility) without
additional sampling; and
since the data are more homogeneous within
each stratum, the stratified sampling estimator
usually has smaller variance than the
corresponding simple random sampling
estimators from the same sample size, i.e., a
stratified sample can provide greater precision
than a simple random sample of the same size.
3.8 Sample Size and Sample Allocation
In order to do sampling, the sample size and sample
allocation should be determined first. The following
definitions are used in this determination. Noted
here, as mentioned in Section 3.7, each facility is
treated as a stratum in the following calculation.
T
total number of facilities in large or
small facility group
total number of units in the
facility,1,2,…,
total number of units in all facilities
number of samples for the
facility,1,2,…,
the total sample size for all facilities
the proportion of the sample which
will be allocated to the
facility
cost of obtaining a sample from the
facility
standard deviation for the
facility
mean for large or small facility
group
Variance for the mean of the large
or small facility group
mean for
facility in large or
small facility group
the upper 0.025 (i.e., 0.05/2) critical
point of the standard normal
distribution
What is the sample size for estimating mean
labour productivity for the large or small facility
group to within some margin of error (noted as b)
with 95% probability? This question can be
translated into eqn. (2):
Table 3: Between and within group variation.
Sum of Square f Mean Square F Significance
Between Groups 54.228 5 10.846 35.992 .000
Within Groups 7.232 24 0.301
Total 61.460 29
Design a Study for Determining Labour Productivity Standard in Canadian Armed Forces Food Services
223

/
(2)
Since the Stratified Random Sampling method is
used and the samples are drawn independently from
the strata, an unbiased estimator of the sample
variance (
for the large or small facility group
can be calculated using eqn. (3) (Cochran 1977):
1
(3)
where
.
Replacing
in eqn. (2), eqn. (2) is changed to
1
(
4
)
Solving this margin of error equation for leads to:
∑
∑
(5)
Using this equation and based on data obtained from
the large or small facility group from the pilot study,
the total sample size , required for estimating mean
labour productivity to within some margin of error b
with 95% probability can be calculated for the large
and small facility groups respectively (see Annex
B).
However, there is still one parameter
which
needs to be determined. The variable
represents
how the sample is allocated to the
stratum. There
are several ways to allocate the sample (Cochran
1977, Lohr & Stratton 2010, Montgomery &
Stratton 2010); the following allocation scheme is
recommended:
/
∑
/
(6)
/
∑
/
(
7
)
This allocation scheme was chosen based on the
following considerations:
larger sample size should be assigned to strata
containing larger number of elements
(i.e., larger
;
larger sample on less homogeneous strata (i.e.,
larger
); and
smaller samples from strata with higher cost
(i.e., higher
).
In summary, the equations above provide not
only the calculation of total sample size but also the
sample size allocation.
To be conservative and to consider the data
obtained from a less ideally designed pilot study, the
sample sizes determined based on the pilot data have
been inflated to the next integer (see Annex B).
It needs to be noted in the pilot study, the small
facility group was formed by two small facilities,
i.e., Halifax and Esquimalt. Unfortunately, Cold
Lake, Shilo and Bagotville were not included in the
pilot study. Due to insufficient data for Shilo, Cold
Lake and Bagotville from the pilot data and to get a
more robust estimation, the pooled
from the small
facility group in pilot study (i.e., Halifax and
Esquimalt) was used for Cold Lake, Shilo and
Bagotville. The detailed sample size calculation and
sample allocation can be found in Annex B. In
summary, for large facility group, 16 random
samples are needed in total. The number of samples
allocated for Wainwright, Trenton, Saint-Jean and
Gagetown are 4, 5, 3 and 4 respectively. For small
facility group, 13 random samples are needed in
total. The sample size for Bagotville, Shilo and Cold
Lake are 5, 4 and 4 respectively.
3.9 Suggested Method to Determine the
Labour Productivity
Once the data for the selected facilities are collected,
the labour performance measurer (i.e., labour
productivity) and its variance can be determined.
Two sets of labour productivity will be
determined: one for large facility group and one for
small facility group. The pooled labour productivity
for the large/small facility group can be calculated
using a weighted average of the labour productivities
(i.e., number of meals per labour hour) across
selected facilities within the large/small facility
group (see eqn.(8)). The weights individual facility
(i.e., individual stratum) receiving is
/
. As
(Cochran 1977) pointed out this self-weighting
scheme is time-saving. The same weighting scheme
is used for calculating the variance for the estimated
pooled labour productivity (see eqn. (9)).
1
⋯
(
8
)
1
⋯
1
(
9
)
ICORES 2017 - 6th International Conference on Operations Research and Enterprise Systems
224

As discussed earlier in Section 3.3, specifically
in our context, the labour performance standard
refers to the aspect and the level of labour
productivity; and the standard is considered as the
best practice in CAF Food Services. As these labour
productivity measures are generated from the
selected CAF Food Service facilities of best
practice, the labour productivity generated from the
next labour study can be considered as the initial
standard. It needs to be noted that establishing the
labour performance standard will be an evolving
process. Although the current study does not
produce a labour performance standard directly, it is
significant since it is one of the building blocks in
the early stage which will support the establishment
of the first labour performance standard for CAF
Food Services.
4 CONCLUSIONS
4.1 Summary
This paper first reviews the results from the pilot
study conducted in February and March 2015 for
CAF Food Services. Due to the issues identified
with the pilot study, this report also proposes a
revised design and analytical approach for a follow-
on study.
In summary, the target population is composed
of two groups, i.e., the large facility and small
facility groups. The large facility group consists of
Wainwright, Trenton, Saint-Jean and Gagetown; and
the small facility group consists of Bagotville, Shilo
and Cold Lake. These are chosen as facilities of best
practice on labour performance based on military
knowledge and judgement. A stratified random
sampling method is suggested being used to get the
random samples for the target population. With the
same sample size, a study with a stratified random
sampling scheme will be able to produce a more
precise estimator compared to that with a simple
random sampling scheme. The sample size and
sample allocation have been determined based on
the data obtained from the pilot study. In summary,
for the large facility group, 16 random samples are
needed in total. The number of samples allocated for
Wainwright, Trenton, Saint-Jean and Gagetown are
four, five, three and four respectively. For the small
facility group, 13 random samples are needed in
total. The sample size for Bagotville, Shilo and Cold
Lake are five, four and four respectively. The
approach for calculating weighted stratified random
sample estimates and their corresponding variances
are also determined for the future study.
Although according to the client’s request, this
study focuses only on the quantitative side of the
labour performance, we believe in order to provide
the labour performance standard for CAF Foods
Services, not only the quantitative measure, but also
qualitative measure of labour performance should be
considered. Therefore, if it is financially permitted,
we recommend that a social study (using techniques,
e.g., customer surveys, interviews, or focus groups)
be conducted to measure the qualitative aspects of
the labour performance. Only focusing on the labour
productivity may drive the facilities to pursue fast
but not high quality food services.
4.2 Significance of the Study
Unlike most of the other food industries, CAF Food
Services is not profit driven and fulfilling the
operational needs is its first priority. Given that the
CAF Food Services does not have a labour
performance standard, establishing one is
significant.
It is beneficial to provide a labour performance
standard (i.e., level of labour performance of best
practice here) against which a performance of a CAF
Food Services facility can be measured and
compared. Once developed, this labour performance
standard could then be used to ensure food service
facilities to provide efficient and effective food
service support to the CAF and may inform future
rationalization of staffing within CAF Food
Services. Routine measurement of labour
performance could also provide a way for CAF Food
Services managers to monitor and track operational
improvements over time. This study focuses on the
quantitative side of the labour performance, i.e.,
labour productivity. As summarized in (River 2000),
productivity measures can play a key role in
business process redesign and optimization,
assessing maximum sustainable outputs, lowering
products or service unit cost, and exploring the
feasibility of out sourcing.
Developing a labour performance standard will
be an evolving process. Although the current study
does not produce a labour performance standard for
CAF Food Services directly, it outlines the requisite
study design for data collection and an analytical
approach for a future study, which will underpin
future development of a labour performance
standard for CAF Food Services.
Design a Study for Determining Labour Productivity Standard in Canadian Armed Forces Food Services
225
REFERENCES
Request for Operational Research and Analysis:
Performance Measure in CAF Food Services, Mat J4 /
D Food Services, December 2014.
Definition related to the CAF Food Services, Maj Mike
Whiting, Communication on 8 December 2015.
Meeting on Request for Operational Research and.
Analysis, Maj Mike Whiting and Manchun Fang, on 18
December 2014.
Collection Tool-Labour Study, Maj Mike Whiting,
Communication on 19 January 2015.
Using Labour Productivity as a Food Services
Performance Measurement and Human Resources
Management Tool, ADM (Mat) Food Services,
Roland Tremblay, 2004.
Sampling Techniques, William G. Cochran, John Wiley &
Sons, Inc. 1977.
Sampling: Design and Analysis, Sharon L. Lohr and
Richard Stratton, ISBN 10:0-495-10527-9, 2010.
Standards, evaluative criteria and benchmarks, Better
Evaluation, Patricia Rogers, Professor of Public Sector
Evaluation, RMIT University. Melbourne. March
2014.
Annual Meal Day, Provided by Mark Whiting and Guy St-
Cyr, SJS Food Service, Communication on 24 July 2015.
Meal days for FY 13/14 and FY 15/16, Provided by Maj
Mark Whiting, Communication on 10 June 2015.
Record of Discussions for meeting between DMGOR and
SJS D Food Services, 28 May 2015.
Financial Management, Accounting Standard and
Procedures, CAF Food Service Manual, A-85-269-
001/FP-001, Nov 2013.
Modern Management. 8th ed. Upper Saddle River, NJ:
Prentice Hall Publishing, Certo SC. 2000.
Design and Analysis of Experiments, D.C. Montgomery,
Richard Stratton, 2010.
Costing Sheet for Travel for Future Labour Study, Maj
Mark Whiting, Communication on 8 June 2015.
ANNEX A: SUMMARY OF DATA
FROM PILOT STUDY
Table A: Summary statistics for Halifax obtained from the pilot study.
Facility Day
Civilian
Hours
Military
Hours
Civilian
Wages
Military
Wages
Total
Hours
Labour
Costs
# of
Meals
Meals/Hour
Halifax
D1 24 143 $615 $4086 167 $4701 483 2.9
D2 120 90 $2502 $2688 210 $5191 496 2.4
D3 152 143 $3216 $4157 295 $7373 444 1.5
D4 144 90 $3084 $2688 234 $5773 398 1.7
D5 136 98 $2901 $2917 234 $5818 340 1.5
Gagetown
D1 334 158 $6875 $4778 492 $11653 2180 4.4
D2 342 203 $7058 $5977 545 $13034 2272 4.2
D3 396 225 $8276 $6618 621 $14894 2224 3.6
D4 348 218 $7215 $6404 566 $13619 2266 4.0
D5 326 203 $6810 $5962 529 $12773 1671 3.2
Saint-Jean
D1
614 83 $12,122 $2,534 697 $14,656 3816 5.5
D2
630 68 $12,130 $2,106 698 $14,236 3556 5.1
D3
606 68 $11,640 $2,106 674 $13,747
3606 5.4
D4
556 53 $10,523 $1,664 609 $12,187 3523 5.8
D5
620 60 $12,057 $1,892 680 $13,950 3382 5.0
Wainwright
D1
168 90 $3,738 $2,745 258 $6,484 992 3.8
D2
168 83 $3,738 $2,517 251 $6,255 1051 4.2
D3
192 83 $4,269 $2,517 275 $6,786 704 2.6
D4
136 90 $2,992 $2,617 226 $5,610 963 4.3
D5
152 90 $3,365 $2,617 242 $5,983 804 3.3
Trenton
D1
104 30 $2,217 $799 134 $3,016 558 4.2
D2
80 45 $1,825 $1,170 125 $2,995 715 5.7
D3
80 53 $1,825 $1,384 133 $3,209 650 4.9
D4
72 45 $1,610 $1,226 117 $2,836 603 5.2
D5
72 38 $1,610 $1,013 110 $2,622 511 4.7
ICORES 2017 - 6th International Conference on Operations Research and Enterprise Systems
226
Table A: Summary statistics for Halifax obtained from the pilot study (Cont.).
Facility Day
Civilian
Hours
Military
Hours
Civilian
Wages
Military
Wages
Total
Hours
Labour
Costs
# of
Meals
Meals/Hour
Esquimalt
D1
200 60 $4,400 $1,658 260 $6,058 435 1.7
D2
176 83 $3,870 $2,271 259 $6,141 408 1.6
D3
176 120 $3,870 $3,267 296 $7,137 426 1.4
D4
152 98 $3,457 $2,668 250 $6,124 365 1.5
D5
168 90 $3,830 $2,397 258 $6,227 701 2.7
ANNEX B: SAMPLING
As we discussed in Section 3.8, the sample size and
sample allocation will be determined using eqns. (5),
(6) and (7).
The following sample size calculation and
sample allocation are based on the information from
the pilot study or provided by (Whiting June 8
2015). The number of the total observation units is
21 (a three-week full cycle of NSCM). For the large
facility group:
Wainwright (i.e.,i1)
–
N
21, σ
0.71, c
2.4c
– Using eqn. (6), the weight for Wainwright
is calculated:w
0.33
Trenton (i.e.,i2)
– N
21,σ
0.58,c
c
– Usingeqn.6,theweightforTrenton
iscalculated:w
0.27
Saint-Jean (i.e.,i3)
– N
21,σ
0.32,c
c
– Usingeqn.6,theweightforSaint‐
Jeaniscalculated:w
0.15
Gagetown (i.e.,i4)
– N
21,σ
0.50,c
1.9c
– Using eqn. 6, the weight for
Gagetowniscalculated:w
0.24
In the pilot study, the small facility group was
formed by two small facilities, i.e., Halifax and
Esquimalt. However it was determined later that
these three facilities, i.e., Cold Lake, Shilo and
Bagotville would be good examples of small feeding
facilities in terms of labour performance.
Although there was no data collected for these
three small facilities, there is no problem to figure
out the
and
for Cold Lake, Shilo and
Bagotville. To get a more robust estimation, the
pooled standard deviation from Halifax and
Esquimalt was used for Cold Lake, Shilo and
Bagotville; therefore, the standard deviation for all
three small facilities are computed to be, and
assumed to be identical.
For the small facility group:
Cold Lake (i.e.,i=1)
– N
21,σ
0.58,c
1.5c
– Usingeqn.6,theweightforTrenton
iscalculated:w
0.34
Shilo (i.e.,i2
– N
21,σ
0.58,c
1.7c
– Usingeqn.6,theweightforTrenton
iscalculated:w
0.32
Bagtoville (i.e.,i3
– N
21,σ
0.58,c
1.5c
– Usingeqn.6,theweightforTrenton
iscalculated:w
0.34
Let 0.25 (initial determined, can be justified
as required) and 1.96 (is the 97.5% percentile of
the standard norm distributions, the critical value for
95%), and according to eqn. (5), the sample size
required is approximate 14.59 for estimating the
mean of labour performance productivity for the
large facility group with 95% probability with
marginal error 0.25. Applying the corresponding
weights, the sample allocation is calculated for each
individual facility as follows:
Wainwright: nw
3.864
Trenton: nw
4.905
Saint-Jean: nw
2.743
Gagetown: nw
3.094
It needs to be noted that to be conservative and to
consider the less ideal design of the pilot study, the
sample sizes determined based on the pilot data have
been inflated to the next integer. Therefore, the
number of samples allocated for Wainwright,
Trenton, Saint-Jean and Gagetown are 4, 5, 3 and 4
respectively.
The same procedure is used for calculating the
sample sizes for the small facility group. Calculating
based on eqn. (5), the total sample size of 12.44 will
be required. Again, for the same reason, the sample
size determined based on the pilot data via optimal
allocation scheme have been inflated to the next
integer. Therefore, the sample size for Bagotville,
Shilo and Cold Lake are 5, 4 and 5 respectively:
Bagotville: nw
4.275
Shilo: nw
3.994
Cold Lake: nw
4.175
Design a Study for Determining Labour Productivity Standard in Canadian Armed Forces Food Services
227
