
CNV-LDC: An Optimized CNV Detection Method for Low Depth of
Coverage Data
Ayyoub Salmi
1,3
, Sara El Jadid
2
, Ismail Jamail
3
, Taoufik Bensellak
3
, Romain Philippe
1
,
Veronique Blanquet
1
and Ahmed Moussa
3
1
Animal Molecular Genetics Unit, Limoges University, Limoges, France
2
Laboratory of Telecommunication Systems and Engineering of the Decision, Ibn Tofail University, Kenitra, Morocco
3
Technology Laboratory of Information and Communication, Abdelmalek Essaadi University, Tangier, Morocco
Keywords:
Copy Number Variation, NGS Data, Read Depth, Low Depth of Coverage.
Abstract:
Recent improvements in technologies showed much greater variance of our genome than we thought. A part
of this variance is due to submicroscopic chromosomal deletions/duplications called Copy Number Variations
(CNVs). For some of these CNVs, it was clearly demonstrated that they play an important role in disease sus-
ceptibility, including complex diseases and Mendelian diseases. Last advances in next-generation sequencing
have made fast progress in analyzing data for CNVs, in so far as they promise to improve the sensitivity in de-
tection. This has led to the development of several new bioinformatics approaches and algorithms for detecting
CNVs from this data for the four common methods: Assembly Based, Split Read, Read-Paired mapping, and
Read Depth. Here we focus on the RD method that is able to detect the exact number of CNVs in comparison
with the other methods. We propose an alternative method for detecting CNVs from short sequencing reads,
CNV-LDC (Copy Number Variation-Low Depth of Coverage), that complements the existing method named
CNV-TV (Copy Number Variation-Total Variation). We optimize the signal modeling and threshold step to
lift the performance in low depth of coverage. Results of this new approach have been compared to various
recent methods on different simulated data using small and large CNVs.
1 BACKGROUND
With the fulfillment of the human genome project,
here we come walk-in ”post-genomic” era. An im-
portant discovery of recent years is that of CNVs
(Copy Number Variants), which showed that the hu-
man genome has an inter-individual variance much
higher than what previously was thought (Beckmann
et al., 2007). The term ”variation” or ”variant” in-
duced somewhat in error, in so far as it suggests that
the CNVs are only benign of the standard variants.
The significance of CNV in the pathogenesis of some
rare genetic syndromes, and also frequent multifacto-
rial diseases, is actually extremely complex.
The human genome consists of more than 3 bil-
lion base pairs and it was long thought that the DNA
chains of two randomly selected individuals were
99.9% identical. It was considered that the SNPs (Sin-
gle Nucleotide Polymorphisms) were the main source
of inter-individual variability. However, the scientific
achievements of recent years led to a complete revi-
sion of this design and uncovered a new dimension
of inter-individual genetic variability. It is submicro-
scopic chromosomal structural changes (Vissers et al.,
2003), which were called CNV. CNVs are distributed
with high probability in a not entirely random order
on all chromosomepairs and vary from one individual
to another in terms ofnumber and distribution pattern.
This is most often due to duplications or deletions at
certain chromosome segments. They include by defi-
nition more than 1000 base pairs (1 kb), but can also
extend over several million base pairs (Mb). Recently
due to widespread of genome sequencing, the opera-
tional spectrum of CNVs has been widened to include
even events as small as 50bp (Alkan et al., 2011).
Despite the fact that CNVs are often located in re-
gions with a reduced number of genes, they may also
contain hundreds of genes and regulatory elements.
Genes that are within the CNV mostly appear not to
play an important role in the embryonic development,
but rather intervene in interactions with the environ-
ment, such as in odor perception or defenses against
Salmi A., El Jadid S., Jamail I., Bensellak T., Philippe R., Blanquet V. and Moussa A.
CNV-LDC: An Optimized CNV Detection Method for Low Depth of Coverage Data.
DOI: 10.5220/0006111600370042
In Proceedings of the 10th International Joint Conference on Biomedical Engineering Systems and Technologies (BIOSTEC 2017), pages 37-42
ISBN: 978-989-758-214-1
Copyright
c
2017 by SCITEPRESS – Science and Technology Publications, Lda. All rights reserved
37

infections.
With the emergence of new technologies such as
Next Generation Sequencing (NGS), new fields of ap-
plication have emerged. This technology enables high
resolution detection of CNVs. It generates a large
number of short read sequences (from 50 to 250bp)
using reversible terminatorchemistry (Bentley, 2008).
New computational methods were developed to iden-
tify CNVs from NGS data (Zhao et al., 2013) and
using next-generation sequencing platforms (Mardis,
2013). Four known approaches are widely used: AS
(Assembly Based), SR (Split Read), RP (Read-Paired
mapping), and RD (Read Depth) (Zhao et al., 2013)
(Liu et al., 2013) (Medvedev et al., 2009) (Yoon et al.,
2009) (Xi et al., 2012) (Duan et al., 2013). In spite
of their strengths and weaknesses (Tan et al., 2014)
(Alkan et al., 2009), these approaches are usually
complementary to each other but none of them can
detect the full proportion of DNA variation.
Here we focus on RD methods that rely on the
principle of randomly sampling the short reads on
the genome, and once they are aligned to the refer-
ence genome, their density is locally proportional to
the copy number (Yoon et al., 2009). These methods
are based on a statistical hypothesis testing informing
about the relative existence of CNV through the cor-
relation between the copy number of a genomic re-
gion and the depth coverage of this region (Teo et al.,
2012). The RD approach can be classified in three
categories depending on the sample type: the sin-
gle sample, the paired sample (case/control), and the
large population sample. In the first category, we will
get a report of absolute copy number since there is no
other subject to compare with. While in the second
category we will get a report of relative copies com-
pared to controls as there are controls. For the third
category, the detection of CNVs is done by using the
overall mean of the RD.
Compared to the other approach for CNV detec-
tion detecting CNVs from NGS data, RD is able to
detect the exact number of CNVs, while SR, AS and
RP can just provide a report of only the position and
not the counts of the CNVs.
Specifically, the procedure of RD based meth-
ods includes the following steps. In a first step, the
aligned reads to the reference genome are piled up and
then counted using a sliding (Xie and Tammi, 2009)
or a predefined window. In a second step, the counts
will be normalized to eliminate biases resulting from
repeat regions and GC content (Boeva et al., 2010)
(Janevski et al., 2012), then a contiguous set of win-
dows that have the same number of CNVs is iden-
tified using a segmentation algorithm. The final step
consists in predicting the statistical significance of the
calls and filtering (Zhao et al., 2013).
Recently, many CNV detection methods have
been developed (Yoon et al., 2009) (Chiang et al.,
2008) (Gusnanto et al., 2011), but their performances
are not robust. Now, we stand in need for strong meth-
ods for detecting CNVs from NGS data.
We sought to optimize and implement an alter-
native method for detecting CNVs from short se-
quencing reads that complements the existing method
named CNV-TV (Duan et al., 2013). Here we made
the signal modeling using Fused lasso instead of lasso
because of the spatial structure of data (Tibshirani
et al., 1997). Our approach is optimized for low depth
coverage (Zhang et al., 2012) and uses an automatic
threshold selection.
2 METHODS
The first step for the CNV detection process starts
with filtering unmapped reads and PCR duplicates
that are marked with the 1024 flag using either Sam-
tools (Li et al., 2009) or Picard, then extracting read
depth signal from a BAM file. We use a 100bp non-
overlappingsliding windowto compute the mean read
depth across the genome. This gives us a better res-
olution and the ability to detect smaller CNV. The
read depth signal is then corrected for GC bias as
the GC-rich and AT-rich fragments may be under-
represented in the sequencing results (Benjamini and
Speed, 2012). The bin size is set to match the slid-
ing window size. The adjusted read count is com-
puted using the formula (1) where u
i
is the number of
reads mapped to the i
th
bin, d is the median read count
across all bin and d
i
GC
the median read count of those
bins which have the same GC-content as the i
th
bin.
Ad justedReadCount = u
i
×
d
d
i
GC
(1)
A total variation penalized least square model is
used to extract to true signal from the noise as shown
in equation (2) where y
i
is the read depth signal, x
i
is
the recovered smooth signal, φ(x) is the penalty and λ
the penalty parameter.
min
x
i
(
1
2
n
∑
i=1
(y
i
− x
i
)
2
+ λ
n−1
∑
i=1
φ(x
i+1
− x
i
)
)
(2)
In (Duan et al., 2013) the author suggests the use
of lasso to solve an alternative form of equation (2),
but we decided to use the Fused lasso considering
its better performance as demonstrated by (Tibshirani
et al., 2005). The penalty parameter Lambda was set
BIOINFORMATICS 2017 - 8th International Conference on Bioinformatics Models, Methods and Algorithms
38
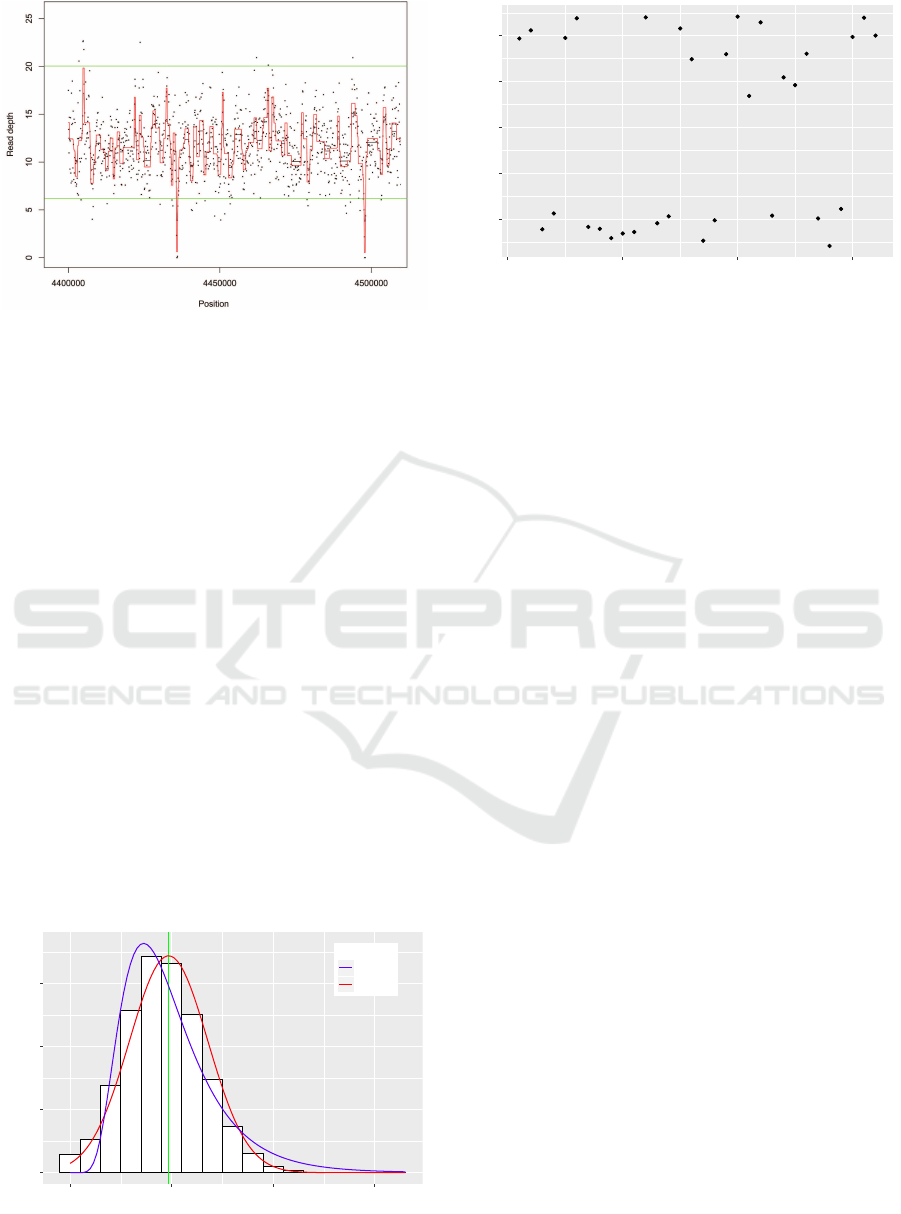
The black dots are read depth. The black line is the smoothed signal. The
red line is the corrected smoothed signal. The green lines are the cutoffs.
Figure 1: Processing result.
using an automated approach by using the Schwarz
information criterion (SIC), once this parameter is
known, the smooth signal is then extracted (figure 1).
A CNV is identified as a segment of abnormal am-
plitude, i.e. below or above an estimated cutoff. In or-
der to choose a suitable threshold, we model the read
depth as following a lognormal distribution. This al-
lows us to partially address the problem of detecting
more losses in copy number as described in (Fadista
et al., 2010) and (Turner et al., 2007). This bias could
be due to both biological and technical reasons. In
fact, when using low coverage data, we observed that
even more losses that are part of the noise are being
introduced which leads to more false positive CNVs
as shown in figure 2 that represents the read depth dis-
tribution in chromosome 20 of the sample HG00097
that was taken from the 1000 genomes project. The
threshold value to call a CNV is calculated such that
the left and right tail of the theoretical distribution
cover 5 percent of this latter.
We observed that most of the false positive CNV
calls occur near the estimated cutoffs. Those calls are
0.00
0.03
0.06
0.09
0 10 20 30
Depth
frequency
Distribution
Logormal
Normal
Figure 2: Read depth distribution for sample HG00097 at
chromosome 20.
1
2
3
4
5
0 10 20 30
calls
intensity
Figure 3: Loss of copy number calls in a genomic segment.
mixed with the true heterozygous calls as they also
happen near the cutoffs, which makes them harder to
filter.
The most of the false positive calls are introduced
as small CNVs. To further reduce their number we de-
cided to discard a fraction of the calls near the thresh-
olds. We first separated each of the losses and gains
in copy number into two groups: a first group that
is closer to the cutoff which supposedly contain the
most of the false positive calls and a second group
further from the cutoff (figure 3). After that we mod-
eled the first group as following a normal distribution.
The cutoff to remove the potential false positive calls
was calculated as the 95
th
quantile of the fitted normal
distribution.
3 RESULTS AND DISCUSSION
We made our modified version of CNV-TV available
as an R package and compared it to three other CNV
detection methods. Those methods were picked based
on the citation in literature and the free availability:
Pindel (Ye et al., 2009), CNVnator (Abyzov et al.,
2011) and DELLY2 (Rausch et al., 2012).
Those methods use different approaches to iden-
tify CNVs. Pindel uses split read, CNVnator uses
read depth and DELLY2 uses paired-end and split
read. The bin size for CNVnator was set to match
the bin size used in our method.
3.1 Data Simulation
To test the performance of our method, we used the
simulation tool ART (Huang et al., 2011) to gener-
ate synthetic next-generation sequencing reads in or-
der to get the exact measures. Escherichia coli strain
k-12 genome that has a length of 5.16Mbp and a
GC content of 50.6% was used as reference to pro-
CNV-LDC: An Optimized CNV Detection Method for Low Depth of Coverage Data
39
duce genomes with simulated CNVs. The first sim-
ulation consisted of 30 deletions and 9 duplications
with a length of 350bp to test the ability to detect
small CNVs. This procedure produced a reference
genome of 4.9Mbp. Short read sequences were gen-
erated from this reference genome with a length of
120bp, the simulated fragment size was 400bp. The
mean sequencing depth used was 12x, which is con-
sidered as a low depth coverage. The short reads were
then aligned to the reference genome using Bowtie2
(Langmead and Salzberg, 2012). Finally we used the
CNV calling methods to get a list of CNV calls which
was compared to the ground truth. True positive calls
were defined as an overlap between a CNV call and
the ground truth.
The second simulation consisted of 30 duplica-
tions and 30 deletions with a length of 1000bp. We
proceeded with the same protocol for the first simula-
tion to produce the aligned short reads.
3.2 Results for Simulated Data
Table 1: Number of detected CNVs for the first simulation.
Type Ground truth CNV-LDC Pindel CNVnator DELLY2
Deletion 30 30 113 12 33
Duplication 9 10 9 0 0
Table 1 shows the number of detected CNVs for
each method. We can see that the number of CNVs
detected by our method is very close to the ground
truth. to further investigate the results, we calculated
the F-score: a measurement of the accuracy of a given
test. It ranges between 1 and 0. A high score indi-
cates a good performance while a low score indicates
a worst performance.
Table 2: F-scores for the first simulation.
Type CNV-LDC Pindel CNVnator DELLY2
Deletion 1 0.42 0.57 0.95
Duplication 0.94 1 0 0
The values of the F-score are given in table 2. we
can clearly see that our method yields better overall
performance even if it is outperformed by Pindel in
duplications detection.
Table 3 and 4 show the number of called CNVs
ans corresponding F-scores respectively for the sec-
ond simulation. Our method was able to detect all the
simulated CNVs with no false positive calls.
Table 3: Number of detected CNVs for the second simula-
tion.
Type Ground truth CNV-LDC Pindel CNVnator DELLY2
Deletion 30 30 79 29 32
Duplication 30 30 30 16 30
Table 4: F-scores for the second simulation.
Type CNV-LDC Pindel CNVnator DELLY2
Deletion 1 0.55 0.98 0.96
Duplication 1 1 0.69 1
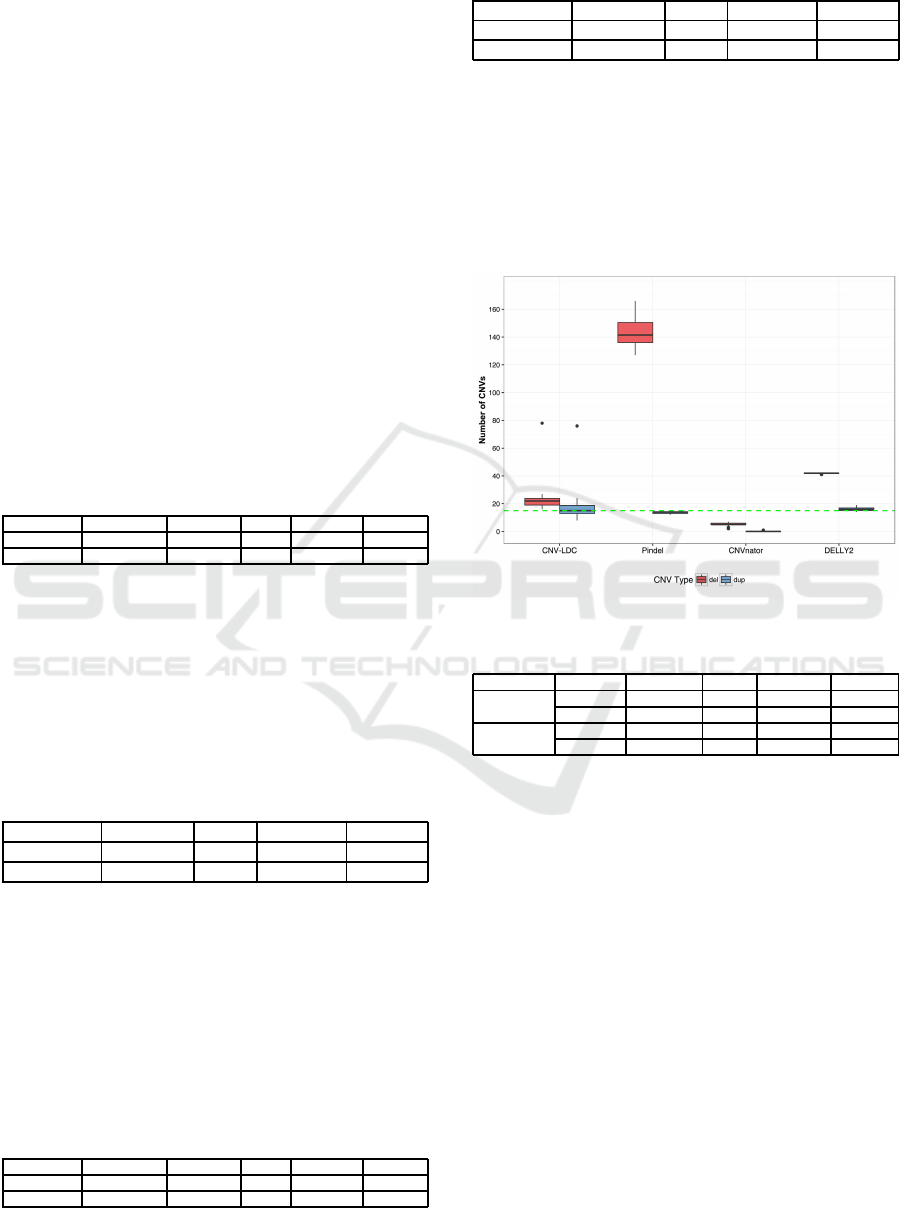
We also generated fifty simulated genomes with
15 duplications and 15 deletions with a length of
350bp distributed uniformly using independent runs.
Table 5 shows the mean and standard deviation of the
number of called CNVs. A boxplot of the results is
also given in figure 4, the green dashed line represent
the number of simulated CNVs for deletions and du-
plications.
Figure 4: Boxplot of called CNVs.
Table 5: Mean and standard deviation for fifty runs.
Type Value CNV-LDC Pindel CNVnator DELLY2
Deletion
Mean 22.5 143.42 5.24 41.76
Deviation 8.47 10.53 0.04 16.04
Duplication
Mean 16.88 13.68 0.04 06.04
Deviation 9.41 0.58 0.2 1.21
Considering the results from the simulations, we
can see that our method performs very well at calling
both small and large CNVs.
4 CONCLUSIONS
In this paper we presented an alternative version of
the CNV-TV method that relies on total variation pe-
nalized least squares model to fit the read depth signal
from a low depth of coverage sequencing data. Here
we assume that any change in the depth of coverage
in a genomic region is correlated with a change in the
copy number.
The cutoffs for CNV calling are set automatically
using a lognormal distribution to fit the read depth fre-
quency. The goal was to minimize the detected loss of
copy number caused by biological and technical bias.
To further reduce this bias, another filter was added
BIOINFORMATICS 2017 - 8th International Conference on Bioinformatics Models, Methods and Algorithms
40

for small CNVs using a fitted normal distribution for
the calls close to the cutoffs.
The results of our method were compared to those
of three other CNV detection methods using simu-
lated data to assess its performances. The simulations
consisted of small and large CNVs. In both cases, our
method yielded better overall results. The only draw-
back was the longer execution time in comparison to
the other methods.
REFERENCES
Abyzov, A., Urban, A. E., Snyder, M., and Gerstein, M.
(2011). CNVnator: An approach to discover, geno-
type, and characterize typical and atypical CNVs from
family and population genome sequencing. Genome
Research, 21(6):974–984.
Alkan, C., Coe, B. P., and Eichler, E. E. (2011). Genome
structural variation discovery and genotyping. Nat Rev
Genet, 12(5):363–376.
Alkan, C., Kidd, J. M., Marques-Bonet, T., Aksay, G., An-
tonacci, F., Hormozdiari, F., Kitzman, J. O., Baker, C.,
Malig, M., Mutlu, O., Sahinalp, S. C., Gibbs, R. A.,
and Eichler, E. E. (2009). Personalized copy number
and segmental duplication maps using next-generation
sequencing. Nature Genetics, 41(10):1061–1067.
Beckmann, J. S., Estivill, X., and Antonarakis, S. E. (2007).
Copy number variants and genetic traits: closer to the
resolution of phenotypic to genotypic variability. Nat
Rev Genet, 8(8):639–646.
Benjamini, Y. and Speed, T. P. (2012). Summarizing and
correcting the GC content bias in high-throughput se-
quencing. Nucleic Acids Research, 40(10):e72–e72.
Bentley, D. R. (2008). Accurate whole human genome se-
quencing using reversible terminator chemistry. Na-
ture, 456(7218):53–59.
Boeva, V., Zinovyev, A., Bleakley, K., Vert, J.-P., Janoueix-
Lerosey, I., Delattre, O., and Barillot, E. (2010).
Control-free calling of copy number alterations in
deep-sequencing data using GC-content normaliza-
tion. Bioinformatics, 27(2):268–269.
Chiang, D. Y., Getz, G., Jaffe, D. B., Zhao, X., Carter,
S. L., Russ, C., Nusbaum, C., Meyerson, M., and Lan-
der, E. S. (2008). High-resolution mapping of copy-
number alterations with massively parallel sequenc-
ing. Nature Methods, 6(1):99–103.
Duan, J., Zhang, J.-G., Deng, H.-W., and Wang, Y.-P.
(2013). CNV-TV: A robust method to discover copy
number variation from short sequencing reads. BMC
Bioinformatics, 14(1):150.
Fadista, J., Thomsen, B., Holm, L.-E., and Bendixen, C.
(2010). Copy number variation in the bovine genome.
BMC Genomics, 11(1):284.
Gusnanto, A., Wood, H. M., Pawitan, Y., Rabbitts, P.,
and Berri, S. (2011). Correcting for cancer genome
size and tumour cell content enables better estimation
of copy number alterations from next-generation se-
quence data. Bioinformatics, 28(1):40–47.
Huang, W., Li, L., Myers, J. R., and Marth, G. T. (2011).
ART: a next-generation sequencing read simulator.
Bioinformatics, 28(4):593–594.
Janevski, A., Varadan, V., Kamalakaran, S., Banerjee, N.,
and Dimitrova, N. (2012). Effective normalization for
copy number variation detection from whole genome
sequencing. BMC Genomics, 13(Suppl 6):S16.
Langmead, B. and Salzberg, S. L. (2012). Fast gapped-read
alignment with bowtie 2. Nature Methods, 9(4):357–
359.
Li, H., Handsaker, B., Wysoker, A., Fennell, T., Ruan,
J., Homer, N., Marth, G., Abecasis, G., and and,
R. D. (2009). The sequence alignment/map format
and SAMtools. Bioinformatics, 25(16):2078–2079.
Liu, B., Morrison, C. D., Johnson, C. S., Trump, D. L.,
Qin, M., Conroy, J. C., Wang, J., and Liu, S. (2013).
Computational methods for detecting copy number
variations in cancer genome using next generation
sequencing: principles and challenges. Oncotarget,
4(11):1868–1881.
Mardis, E. R. (2013). Next-generation sequencing plat-
forms. Annual Rev. Anal. Chem., 6(1):287–303.
Medvedev, P., Stanciu, M., and Brudno, M. (2009). Com-
putational methods for discovering structural variation
with next-generation sequencing. Nature Methods,
6(11s):S13–S20.
Rausch, T., Zichner, T., Schlattl, A., Stutz, A. M., Benes,
V., and Korbel, J. O. (2012). DELLY: structural vari-
ant discovery by integrated paired-end and split-read
analysis. Bioinformatics, 28(18):i333–i339.
Tan, R., Wang, Y., Kleinstein, S. E., Liu, Y., Zhu, X., Guo,
H., Jiang, Q., Allen, A. S., and Zhu, M. (2014). An
evaluation of copy number variation detection tools
from whole-exome sequencing data. Human Muta-
tion, 35(7):899–907.
Teo, S. M., Pawitan, Y., Ku, C. S., Chia, K. S., and Salim,
A. (2012). Statistical challenges associated with de-
tecting copy number variations with next-generation
sequencing. Bioinformatics, 28(21):2711–2718.
Tibshirani, R. et al. (1997). The lasso method for vari-
able selection in the cox model. Statistics in medicine,
16(4):385–395.
Tibshirani, R., Saunders, M., Rosset, S., Zhu, J., and
Knight, K. (2005). Sparsity and smoothness via the
fused lasso. Journal of the Royal Statistical Society:
Series B (Statistical Methodology), 67(1):91–108.
Turner, D. J., Miretti, M., Rajan, D., Fiegler, H., Carter,
N. P., Blayney, M. L., Beck, S., and Hurles, M. E.
(2007). Germline rates of de novo meiotic deletions
and duplications causing several genomic disorders.
Nature Genetics, 40(1):90–95.
Vissers, L. E., de Vries, B. B., Osoegawa, K., Janssen,
I. M., Feuth, T., Choy, C. O., Straatman, H., van der
Vliet, W., Huys, E. H., van Rijk, A., Smeets, D.,
van Ravenswaaij-Arts, C. M., Knoers, N. V., van der
Burgt, I., de Jong, P. J., Brunner, H. G., van Kessel,
A. G., Schoenmakers, E. F., and Veltman, J. A. (2003).
Array-based comparative genomic hybridization for
the genomewide detection of submicroscopic chromo-
CNV-LDC: An Optimized CNV Detection Method for Low Depth of Coverage Data
41

somal abnormalities. The American Journal of Human
Genetics, 73(6):1261–1270.
Xi, R., Lee, S., and Park, P. J. (2012). A survey of
copy-number variation detection tools based on high-
throughput sequencing data. Current Protocols in Hu-
man Genetics, pages 7–19.
Xie, C. and Tammi, M. T. (2009). CNV-seq, a
new method to detect copy number variation using
high-throughput sequencing. BMC Bioinformatics,
10(1):80.
Ye, K., Schulz, M. H., Long, Q., Apweiler, R., and Ning,
Z. (2009). Pindel: a pattern growth approach to detect
break points of large deletions and medium sized in-
sertions from paired-end short reads. Bioinformatics,
25(21):2865–2871.
Yoon, S., Xuan, Z., Makarov, V., Ye, K., and Sebat, J.
(2009). Sensitive and accurate detection of copy num-
ber variants using read depth of coverage. Genome
Research, 19(9):1586–1592.
Zhang, J., Wang, J., and Wu, Y. (2012). An improved ap-
proach for accurate and efficient calling of structural
variations with low-coverage sequence data. BMC
bioinformatics, 13(6):1.
Zhao, M., Wang, Q., Wang, Q., Jia, P., and Zhao, Z.
(2013). Computational tools for copy number varia-
tion (CNV) detection using next-generation sequenc-
ing data: features and perspectives. BMC Bioinfor-
matics, 14(Suppl 11):S1.
BIOINFORMATICS 2017 - 8th International Conference on Bioinformatics Models, Methods and Algorithms
42
