
Design of a Portable Low-Cost Impedance Analyzer
Abdulwadood Al-Ali
1
, Ahmad Elwakil
2
, Abdelaziz Ahmad
2
and Brent Maundy
1
1
Dept. Elect. Computer Eng., University of Calgary, Calgary, Canada
2
Dept. Elect. Computer Eng., University of Sharjah, Sharjah, U.A.E.
Keywords:
Bio-Impedance, Impedance Spectroscopy, Impedance Analyzer.
Abstract:
Impedance analyzers available in the market are mostly bulky and often very expensive. In this paper, a
low-cost, portable impedance analyzer is designed and implemented. The design utilizes the well-known,
impedance network analyzer chip AD5933 and is capable of measuring a spectrum of impedances in the range
5 Hz to 100 kHz from 10 Ω to 100 kΩ. Its specifications allow it to be used in agriculture for monitoring the
bio-impedance of fruits in different stages of their lives, especially during the growth period while maintaining
low-cost.
1 INTRODUCTION
Impedance spectroscopy is the study of the small-
signal electrical response of an object to yield useful
information about its structure “from mass transport,
rates of chemical reactions, corrosion, and dielec-
tric properties, to defects, microstructure, and com-
positional influences on the conductance of solids”
(Barsoukov and Macdonald, 2005). Any property
that affects the flow of current in a certain material
can be investigated and studied through impedance
spectroscopy (Barsoukov and Macdonald, 2005).
Impedance spectroscopy has also been used exten-
sively to investigate the behavior of biological tis-
sues. Particularly monitoring the vitality of a fruit
through different stages of its life (Rose et al., 2013)
(Jamaludin et al., 2015). By measuring the impedance
spectrum of a fruit, important properties can be cor-
related to this impedance such as the acidity and
sugar content (Borges et al., 2012; V
¨
ain
¨
ol
¨
a and Repo,
2000). The frequency range 10 Hz to 100 kHz, is
satisfactory for most fruits. In that range, most fruits
have an impedance magnitude between 10 Ω to 100
kΩ.
Few methods were previously discussed to ex-
tract the Cole-Cole impedance module (Cole and
Cole, 1941), such as those in (Freeborn et al., 2013),
(Maundy et al., 2015) and (Valente and Demos-
thenous, 2016). Meanwhile, there are hardly any
portable low-cost impedance analyzers in the mar-
ket that can be employed on a wide scale. Recall
that agricultural applications cover large areas of land
hence the need for a battery operated low-cost wire-
less device.
In this work, we use the commercial AD5933
impedance analyzer chip along with an Atmel AT-
mega328P micro-controller unit (MCU) to achieve
this task. The MCU sets the sweeping parameters in
the AD5933 registers (the excitation voltage, the start
frequency, the frequency increment and the number
of steps) while managing the measured impedance
data to be stored on a MicroSD card before being
sent through Bluetooth to a PC for further processing.
Many recently proposed impedance analyzer designs
(Hoja and Lentka, 2013; Breniuc et al., 2014; Simic,
2013; Chabowski et al., 2015) have also employed the
AD5933 since it is the only single chip impedance an-
alyzer available in the market. However, overcoming
its internal design limitations is not straight forward,
as shall be explained below.
2 SYSTEM DESIGN
The proposed system, whose complete picture is
shown in Fig. 1 uses an ATmega328P to control the
AD5933 through its I
2
C interface. To achieve, porta-
bility the measured impedance data is saved into an
SD card and sent afterwards through Bluetooth to a
PC using an HC-05 Bluetooth module. This module
was chosen since it is widely used and well known for
it is flexibility in choosing the baud rate, compatibil-
ity, low cost and low power consumption. The system
is also provided with two 3.7V batteries of 4400mAh
104
Al-Ali A., Elwakil A., Ahmad A. and Maundy B.
Design of a Portable Low-Cost Impedance Analyzer.
DOI: 10.5220/0006121901040109
In Proceedings of the 10th International Joint Conference on Biomedical Engineering Systems and Technologies (BIOSTEC 2017), pages 104-109
ISBN: 978-989-758-216-5
Copyright
c
2017 by SCITEPRESS – Science and Technology Publications, Lda. All rights reserved

to achieve full portability.
2.1 AD5933 and Analog Front-End
The AD5933 chip uses a voltage-controlled oscillator
as an excitation signal. It has a precise direct dig-
ital synthesizer (DDS) and impedance measurement
is done by sensing the current going through the un-
known impedance under test, converting it to a volt-
age and then using an internal 12-bit analog to digital
converter (ADC) along with a Discrete Fourier Trans-
form (DFT) engine to extract the real (R) and imagi-
nary (I) parts of the impedance. The extracted R and
I values are saved in the chip’s registers which can
be accessed through an I
2
C interface. However, the
AD5933 has the following limitations:
2.1.1 Frequency Range
The AD5933 has the ability to do measurements
within the frequency range 1 kHz to 100 kHz with-
out any external components. The lower limit of this
frequency range is affected by the ADC sampling rate
which in turn defines the resolution of the DFT as
shown by equations (1) and (2) (Devices, 2012)
ADC Sampling rate =
MCLK
16
(1)
DFT Resolution =
ADC Sampling rate
1024
(2)
Using the internal on chip oscillator, the excitation
frequency can’t go below 1 kHz since it is provided
with a 16.778 MHz clock that will therefore result in a
1.04 MHz sampling rate which will limit the DFT res-
olution to 1 kHz. For the excitation signal frequency
to go below 1 kHz, the clock that drives the AD5933
has to be changed for each range of frequencies. The
authors of (Chabowski et al., 2015) showed that the
excitation signal frequency ( f
w
) can be chosen pre-
cisely and that the spectral leakage and the spikes in
the current to voltage converter can be avoided by us-
ing equation (3) with integer values of k between 16
and 32 (Devices, 2012).
f
w
= k ·
MCLK
1024 ×16
(3)
Using this equation, we control the master clock
(MCLK) using an external programmable oscilla-
tor which lowered the limit of the frequency to 5
Hz. However, the upper frequency limit cannot be
changed since it was limited to 100 kHz by the anti-
aliasing filter located before the ADC internal to the
chip.
2.1.2 DC Cancellation
Although the AD5933 has a perfect DDS core that can
provide very precise excitation signals at different fre-
quencies, this excitation signal has a DC-bias which
is different for each excitation amplitude. A DC volt-
age difference across biological cells under test might
cause polarization (Chabowski et al., 2015). There-
fore, a high pass filter is necessary to cancel the DC
component of the excitation before reaching the un-
known impedance. We employed a passive RC filter
with a cutoff frequency of 135 mHz in our design,
which was a sufficient solution for DC cancellation
and it did not add any complexity to the design.
2.1.3 Output Impedance
The AD5933 has an output impedance that depends
on the excitation amplitude and that can be relatively
high in some cases (Devices, 2012; Devices, 2013a).
To solve this problem, a buffer with a very low out-
put impedance was added to isolate the unknown
impedance from the chip (Devices, 2013c).
2.1.4 Impedance Range
The measurable impedance range is affected by the
linearity and the calibration process inside the chip.
The manufacturer circuit note recommends using a
simple inverting amplifier with gain −R
f b
/Z
unknown
in
order to sense the current in the unknown impedance
and convert it to voltage (Devices, 2013b). The ADC
inside the chip is limited in terms of its input voltage
tothe range 15mV-5V (Chabowski et al., 2015). Since
the input of the ADC (V
ADC
) is given by
V
ADC
=V
in
×−(R
f b
/Z
unknown
)×PGA
gain
×FilterGain
(4)
and since the on-chip PGA and filter both have unity
gain, the linearity of the ADC depends only on the
ratio R
f b
/Z
unknown
. Our extensive experiments have
shown that the linearity of the gain factor (used in the
calibration process) can only be preserved by keeping
the ratio R
f b
/Z
unknown
between
1
3.5
and 3.5. There-
fore, to expand the measurable magnitude of Z
unknown
,
a multiple R
f b
solution was adopted where four dif-
ferent values of R
f b
(33 Ω, 330 Ω, 3.3 kΩ and 33
kΩ) were switched into the circuit through two (single
pole, double throw) switches switch as needed (De-
vices, 2004).
2.2 Data Processing
The AD5933 needs to be calibrated with a known
impedance by calculating the gain factor which repre-
Design of a Portable Low-Cost Impedance Analyzer
105
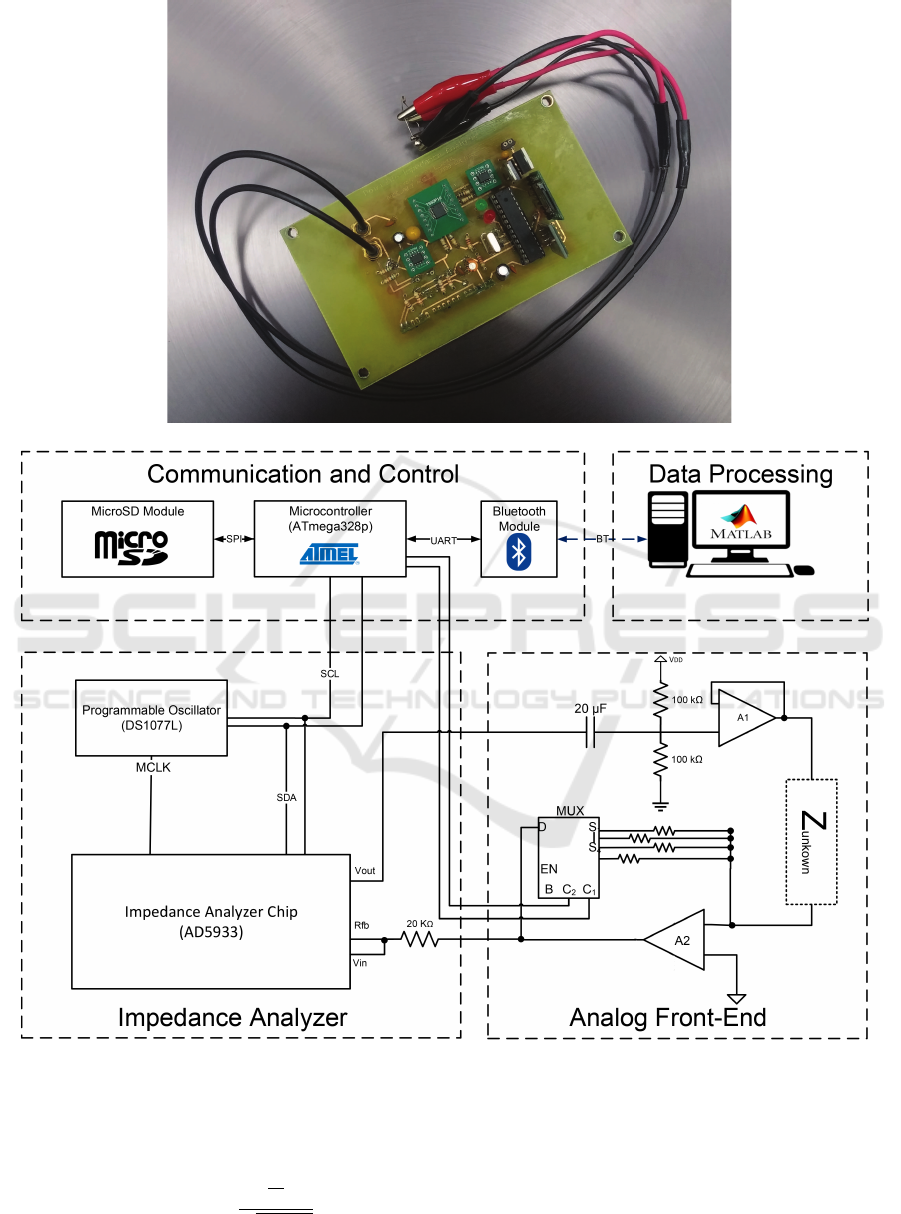
(a)
(b)
Figure 1: The designed portable impedance analyzer. (a) PCB implementation (b) System Design.
sents the gain of the system calculated using equation
(5)
GainFactor =
1
R
c
√
R
2
+ I
2
(5)
where R
c
is the calibration resistor value while R and
I are the values in the real and imaginary registers re-
spectively. The calibration methods mentioned in the
AD5933 datasheet are typically for small frequency
ranges. In the proposed design calibration is being
done using a lookup table to provide a gain factor
value for each point in the sweep which reduces the
BIODEVICES 2017 - 10th International Conference on Biomedical Electronics and Devices
106
error in the measurements significantly. After calcu-
lating the impedance magnitude, the phase should be
also calibrated by using a resistor to get the system
phase that should be subtracted from the calculated
phase as
Unknown Phase = (Φ
measured
−Φ
System
) (6)
where Φ
System
is the phase of the system calcu-
lated using a known calibration resistor (where Φ =
tan
−1
I
R
).
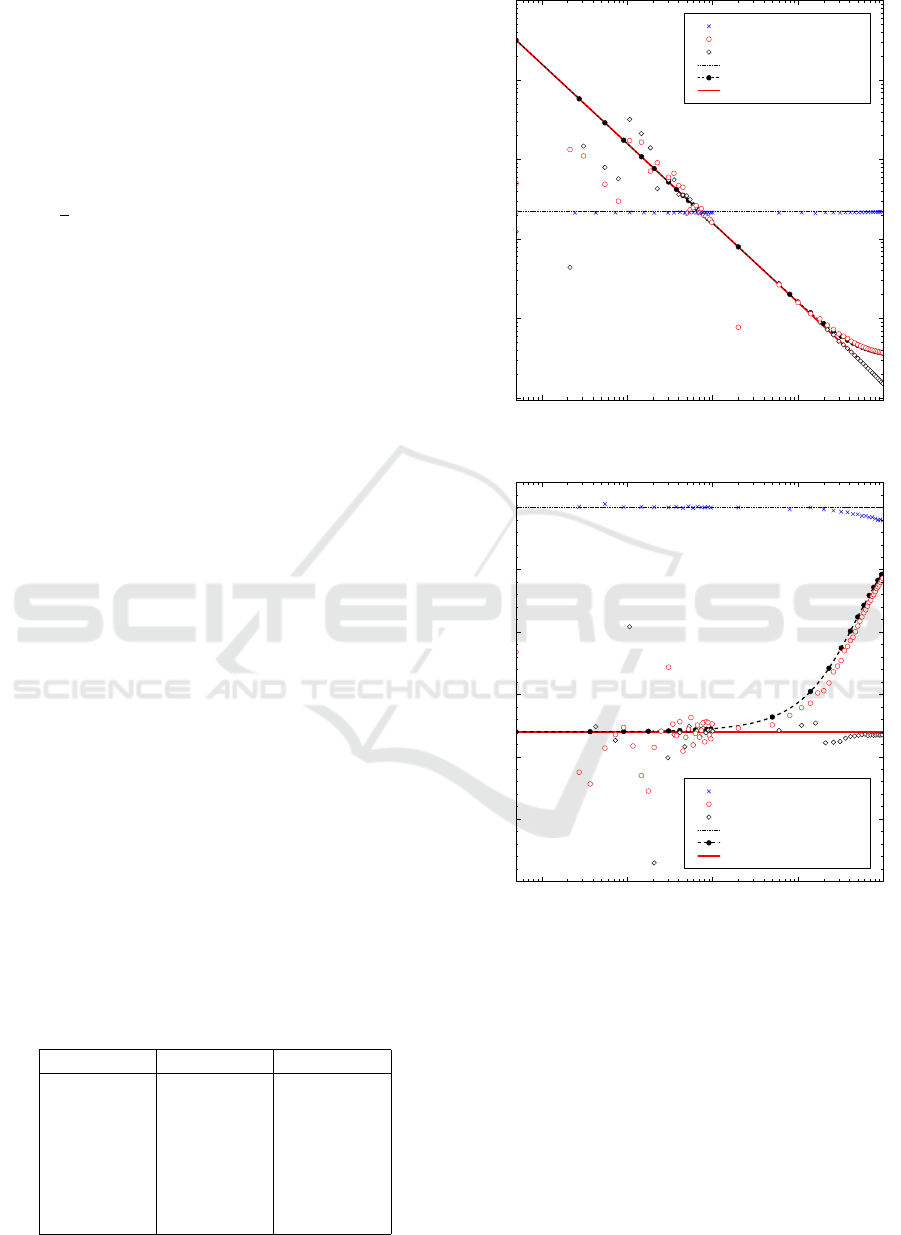
3 EXPERIMENTAL RESULTS
The device was first tested using off shelf resistive and
capacitive components with standard tolerances. The
measured magnitude and phase are shown respec-
tively in Figs. 2(a) and (b) for the following cases:
A 22 kΩ Resistor, 10 nF Capacitor and an RC com-
bination of 330 Ω series with 10 nF. The theoretical
values are also plotted in the same figure.
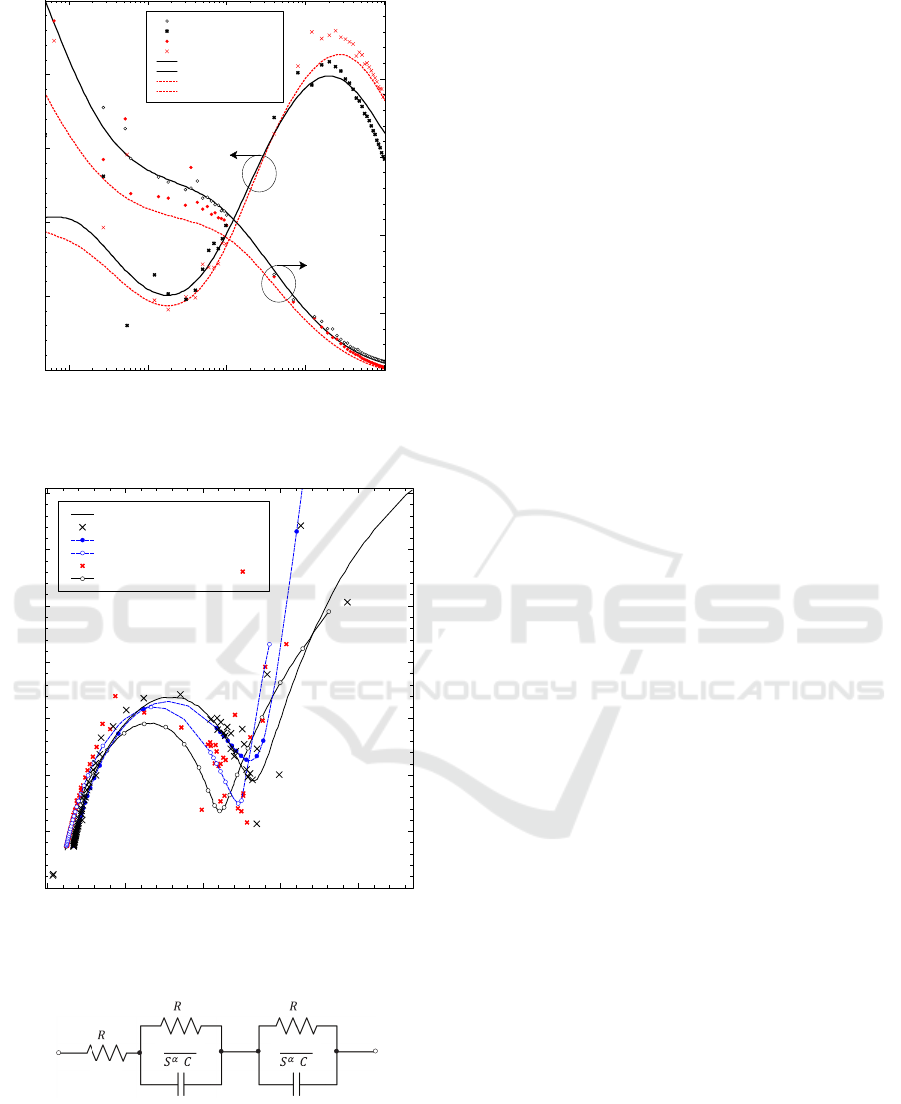
The impedance of two different apples was then
measured using both our device and the industry
standard PSM3750 impedance analyzer (Newton 4th
LTD, UK) fitted with an IAI fixture (Impedance Anal-
ysis Interface) (4th LTD, 2005). The measurements
were done using gold plated electrodes and using the
same placing for both measurements to minimize the
error caused by electrodes place and type (Freeborn
et al., 2016). The bode plot for both the magnitude
and the phase is shown in Fig. 3 while the Nyqust
plot is shown in Fig. 4. It is clear that the device pro-
vides acceptable results in comparison with one of the
best devices in the market albeit with portability and
very low cost of around $150. Using an optimization
and curve fitting algorithm to the measured data us-
ing our device, a double dispersion Cole-Cole model
was constructed as shown in Fig. 5 (where s = jω)
with the values in Table 1, and the Nyquist plot from
the model is shown also in Fig. 4. The device test-
ing showed that it draws around 170 mA in the worst
case and is able to work for around 24 hours with the
provided 4400 mAh batteries.
Table 1: Fitting model values.
Component Apple #1 Apple #2
R
∞
(Ω) 2.1947 k 1.4432 k
R
1
(Ω) 90.992 k 24.229 k
R
2
(Ω) 25.2579 k 45.323 k
C
1
(F) 9.7962E-07 2.3946E-08
α
1
0.8078 0.7383
C
2
(F) 3.2705E-08 6.9596E-07
α
2
0.7138 0.96447
22 kΩ Measured
10 nF & 330 kΩ Measured
10 nF Measured
22 kΩ Calculated
10 nF & 330 kΩ Calculated
10 nF Calculated
Impedance (Ω)
100
1k
10k
1M
10M
Frequency (Hz)
10
1
10
2
10
3
10
4
10
5
(a)
22 kΩ Measured
10 nF & 330 kΩ Measured
10 nF Measured
22 kΩ Calculated
10 nF & 330 kΩ Calculated
10 nF Calculated
Phase (Degree)
−150
−125
−100
−75
−50
−25
0
Frequency (Hz)
10
1
10
2
10
3
10
4
10
5
(b)
Figure 2: Impedance (a) magnitude and (b) phase measure-
ments from off shelf discrete components compared to ac-
tual values.
4 CONCLUSION
A portable low cost impedance analyzer was designed
and implemented. The device can be left in the field
to do continuous measurements for around 24 hours
and the data can be obtained wirelessly afterwards for
a low cost of around 150$. It can measure impedance
between 10 Ω and 100 kΩ, in a frequency range from
Design of a Portable Low-Cost Impedance Analyzer
107
Impedance Apple #1
Phase Apple #1
Impedance Apple #2
Phase Apple #2
|A| Impedance Apple #1
|A| Phase Apple #1
|A| Impedance Apple #2
|A| Phase Apple #2
Impedance (Ohm)
10
4
4×10
4
5×10
4
Phase (Degree)
−90
−80
−70
−60
−50
−40
Frequency (Hz)
10 100 1000 10
4
10
5
Figure 3: Comparison of measured phase and magnitude
using the proposed device and the PSM3750-IAI results.
|A| measurements Apple #1
Proposed system Meas. Apple #1
Fitted data Apple #1
Fitted data Apple #2
Proposed system Meas. Apple #2
|A| measurements Apple #2
-ImZ
0
2.5k
5k
7.5k
10k
12.5k
15k
17.5k
ReZ
0 10k 20k 30k 40k
Figure 4: Impedance Nyquist plot measured using the pro-
posed device compared to PSM3750-IAI measurements.
1
1
1
1
2
2
1 2
∞
Figure 5: Double dispersion Cole-Cole fitting Model.
5 Hz to 100 kHz with a simple low-cost design. Such
a device is very useful for studying a living object
through different stages of its life without interrupt-
ing its natural behaviour. In agriculture the availabil-
ity of such an impedance analyzer makes it possible
to determine a lot of information about the crops even
before harvest, such as what practices contribute to
the quality of the crops, the perfect time for harvest,
determining the level of certain chemicals in the crops
and many other factors.
REFERENCES
4th LTD, N. (2005). IAI Impedance Analysis Interface user
manual.
Barsoukov, E. and Macdonald, J. (2005). Impedance Spec-
troscopy: Theory, Experiment, and Applications. John
Wiley & Sons, 2 edition.
Borges, E., Matos, A., Cardoso, J., Correia, C., Vasconce-
los, T., and Gomes, N. (2012). Early detection and
monitoring of plant diseases by bioelectric impedance
spectroscopy. In Bioengineering (ENBENG), 2012
IEEE 2nd Portuguese Meeting in, pages 1–4. IEEE.
Breniuc, L., David, V., and Haba, C.-G. (2014). Wearable
impedance analyzer based on AD5933. In Electri-
cal and Power Engineering (EPE), 2014 International
Conference and Exposition on, pages 585–590.
Chabowski, K., Piasecki, T., Dzierka, A., and Nitsch, K.
(2015). Simple wide frequency range impedance me-
ter based on ad5933 integrated circuit. Metrology and
Measurement Systems, 22(1):13–24.
Cole, K. S. and Cole, R. H. (1941). Dispersion and absorp-
tion in dielectrics i. alternating current characteristics.
The Journal of Chemical Physics, 9(4):341–351.
Devices, A. (2004). ADG849 3 V/5 V CMOS 0.5 SPDT/2:1
Mux in SC70 Data Sheet.
Devices, A. (2012). Evaluation Board User Guide UG-364.
Devices, A. (2013a). 1 MSPS, 12-Bit Impedance Converter,
Network Analyzer AD5933 Datasheet. Rev. E.
Devices, A. (2013b). AD5933 Circuit Note. Rev. A.
Devices, A. (2013c). AD8605/AD8606/AD8608 Datasheet.
Rev. N.
Freeborn, T. J., Elwakil, A. S., and Maundy, B. J. (2016).
Electrode location impact on cole-impedance param-
eters using magnitude-only measurements. In IEEE
59th Int. Midwest Symposium on Circuits and Systems
(MWSCAS), volume 1, pages 21–24. IEEE.
Freeborn, T. J., Maundy, B., and Elwakil, A. S. (2013).
Cole impedance extractions from the step-response
of a current excited fruit sample. Comput. Electron.
Agric., 98:100–108.
Hoja, J. and Lentka, G. (2013). A family of new gener-
ation miniaturized impedance analyzers for technical
object diagnostics. Metrology and Measurement Sys-
tems, 20(1).
Jamaludin, D., Aziz, S. A., Ahmad, D., and Jaafar, H. Z.
(2015). Impedance analysis of labisia pumila plant
water status. Information Processing in Agriculture,
2(3):161–168.
Maundy, B., Elwakil, A., and Allagui, A. (2015). Ex-
tracting the parameters of the single-dispersion cole
BIODEVICES 2017 - 10th International Conference on Biomedical Electronics and Devices
108

bioimpedance model using a magnitude-only method.
Comput. Electron. Agric., 119(C):153–157.
Rose, E. J., Pamela, D., and Rajasekaran, K. (2013). Apple
vitality detection by impedance measurement. Inter-
national Journal of Advanced Research in Computer
Science and Software Engineering, 9:144–148.
Simic, M. (2013). Realization of complex impedance
measurement system based on the integrated circuit
ad5933. In Telecommunications Forum (TELFOR),
2013 21st, pages 573–576.
V
¨
ain
¨
ol
¨
a, A. and Repo, T. (2000). Impedance spectroscopy
in frost hardiness evaluation of rhododendron leaves.
Annals of Botany, 86(4):799–805.
Valente, V. and Demosthenous, A. (2016). Wideband fully-
programmable dual-mode CMOS analogue front-end
for electrical impedance spectroscopy. Sensors,
16(8):1159.
Design of a Portable Low-Cost Impedance Analyzer
109
