
On using Support Vector Machines for the Detection and Quantification
of Hand Eczema
Stefan Schn
¨
urle
1
, Marc Pouly
1
, Tim vor der Br
¨
uck
1
, Alexander Navarini
2
and Thomas Koller
1
1
Lucerne University of Applied Sciences and Arts, Rotkreuz, Switzerland
2
Department of Dermatology, University Hospital of Zurich, Zurich, Switzerland
Keywords:
Machine Learning, Support Vector Machines, Classification, Eczema Detection and Quantification.
Abstract:
Hand eczema is one of the most frequent skin diseases affecting up to 14% of the population. Early detec-
tion and continuous observation of eczemas allows for efficient treatment and can therefore relieve symptoms.
However, purely manual skin control is tedious and often error prone. Thus, an automatic approach that can
assist the dermatologist with his work is desirable. Together with our industry partner swiss4ward, we devised
an image processing method for hand eczema segmentation based on support vector machines and conducted
several experiments with different feature sets. Our implementation is planned to be integrated into a clinical
information system for operational use at the University Hospital Zurich. Instead of focusing on a high accu-
racy like most existing state-of-the-art approaches, we selected F
1
score as our primary measure. This decision
had several implications regarding the design of our segmentation method, since all popular implementations
of support vector machines aim for optimizing accuracy. Finally, we evaluated our system and achieved an F
1
score of 58.6% for front sides of hands and 43.8% for back sides, which outperforms several state-of-the-art
methods that were tested on our gold standard data set as well.
1 INTRODUCTION
Hand eczema is one of the most frequent dermatoses,
affecting up to 14% of the population, and more than
20% have moderate-to-severe disease requiring inten-
sive treatment (Hald et al., 2008). It can occur in all
ages, commonly follows a chronic course and persists
10-15 years after onset (Meding et al., 2005). Hand
eczema manifests by redness of the skin, scaling,
fissures, pain, itching, papules and blisters, as well
as clear discharge and sometimes bacterial infection
with subsequent pustules. Although the area it usually
affects is small, it still can have grave consequences
for the patient, leading to impairment or disability to
work in many professions. Hand eczema ranks among
the most prevalent occupational diseases (Diepgen,
2003) and can be caused by e.g. exposure to con-
tact allergens and irritants (Hald et al., 2008). Costs
caused by such occupational contact diseases (OCD)
consist of direct medical costs and indirect costs as-
sociated with lost workdays and loss of productiv-
ity. Data on the economic impact of OCD reveals
that in the US alone, annual direct costs for physi-
cians, clinic services and prescription drugs were as
high as USD 1.6 billion, with indirect costs of ap-
proximately USD 566 million for lost productivity
(Meding et al., 2005). In Europe, OCD constitute up
to 30% of all occupational diseases, for which com-
pensation is payable with an average incidence rate
of 0.5 to 1.9 cases per 1000 full-time workers per
year (Diepgen, 2003). Since these figures originate
from registries, they may even underestimate the ac-
tual number of cases as registries are known to be in-
complete due to under-diagnosis and under-reporting
of diseases (Diepgen, 2003). British studies reported
an estimate of approximately 4 million working days
to be lost every year resulting from work related skin
diseases. The costs for these lost days were estimated
to be approximately GBP 200 million per year (En-
glish, 2016).
If hand eczema cannot be prevented, e.g., by
changing profession, early detection of exacerbation
is key to an effective treatment (Diepgen, 2003).
Moisturizers and gloves are often used as secondary
prevention to avoid relapses. However, these have
weak adherence rates by affected patients. More se-
vere cases require the application of topical steroids
or other drugs for a few days to reduce disease activ-
ity. In this process, dermatitis patients rely on their
own perception whether their skin condition is sta-
SchnÃijrle S., Pouly M., vor der BrÃijck T., Navarini A. and Koller T.
On using Support Vector Machines for the Detection and Quantification of Hand Eczema.
DOI: 10.5220/0006125000750084
In Proceedings of the 9th International Conference on Agents and Artificial Intelligence (ICAART 2017), pages 75-84
ISBN: 978-989-758-220-2
Copyright
c
2017 by SCITEPRESS – Science and Technology Publications, Lda. All rights reserved
75

ble or worsening and therefore they often miss the
point in time when early treatment of a relapse would
be efficacious to prevent full-edged eczema. Active
drugs against eczema cannot be used indefinitely due
to costs and side-effects such as skin thinning, ten-
dency to bruising, local suppression of the immune
system resulting in danger of cancer and infection, as
well as systemic side effects.
Eczema of the hand is a well-defined disease that
can be driven by allergic and toxic-irritative effects on
the skin, most often by both. The ability to measure
eczema severity in a reproducible manner is crucial
for management of treatment. Hence, much effort has
gone into creating and validating scores for eczema
(Johansen et al., 2011). Once physicians are trained
to use scores, studies have shown good agreement in
the assessment of the overall extent of eczema. How-
ever, these scores need to take into account the many
clinical subtypes, namely chronic dry fissured hand
eczema, palmar hyperkeratotic hand eczema, vesicu-
lar hand eczema, nummular hand eczema and pulpitis
(Johansen et al., 2011). Thus, grading of hand eczema
currently still is a time-consuming manual process
and in urgent need of improvement. As an example,
the most widely used Hand Eczema Severity Index
(HECSI) takes a dermatologist about 10 minutes to
fill in. Considering this situation, establishing a (semi-
) automatic way to objectively quantify eczematous
skin changes to support diagnostic and therapeutic de-
cisions by physicians as well as patients is of utmost
importance.
Our ultimate project goal consists of an objective
detection and quantification of hand eczema for auto-
mated computation of clinical scores, monitoring and
documentation of the disease process. When brought
to mobile devices, the same application further allows
patients to react early on worsening disease states and
physicians to use tele-dermatology on a novel level. In
(Suter et al., 2014), we presented first results from a
supervised statistical learning algorithm built on tex-
tons and nearest neighbor classification. In this paper,
we show that Support Vector Machines (SVMs) using
a revised and extended feature set and preceding com-
plex data cleaning yields superior results in compari-
son to our previous work and the current literature.
2 LITERATURE
The following literature review is limited to ap-
proaches that either segment eczema affected skin re-
gions from healthy skin or categorize skin diseases
into several classes including eczema. (Nisar et al.,
2013) determine eczema affected areas by clustering
the image with features from different color models.
Besides the analysis of color distributions, the use of
texture recognition methods has proven very useful.
(Mittra and Parekh, 2011) introduce an approach for
image categorization that detects several skin diseases
by means of gray level co-occurrence matrices over
specific image areas, whose entries are taken as tex-
ture features. (Malik et al., 2001) describe a system
for segmenting image regions by contour and texture
properties built on filter responses. (Cula et al., 2004)
extend this approach using a series of special lighting
conditions to derive a so-called bidirectional feature
histogram. They have applied this technique to de-
tect psoriasis, carcinoma, cases of urticarial vasculi-
tis and other skin defects. (Varma and Zisserman,
2005) claim superior results in texture classification
using a texture method from single images using ro-
tationally invariant filters. In this method, a texture
is represented by a histogram of textons, and a tex-
ton is represented by the centroid of a cluster of fil-
ter bank responses over all pixels of the current input
image patch. Based on this approach we derived a
classifier for eczema quantification based on textons
(Suter et al., 2014). (Varma and Zisserman, 2009)
modified their previous approach for material classi-
fication from 2005 to use pixel neighborhood patches
instead of filters. They conclude that this can outper-
form filter bank based classification. Another statis-
tical approach presented by (Sparavigna and Maraz-
zato, 2010) quantitatively evaluates color and coarse-
ness differences in skin. Using a concept called co-
herence length, they can detect skin defects and also
compare changes over time. In addition to image fea-
tures, (Yasir et al., 2014) incorporate data from pa-
tients and medical investigations such as liquid type,
liquid color, elevation, feeling, sex and age.
In several approaches, image filters are applied
prior to classification or segmentation or as a post
processing step to refine the results. (Amarathunga
et al., 2015) increase the contrast of the image and
additionally employ a median and Gauss filter to re-
duce the effect of noise or small hairs. After all fea-
ture values are determined, they are typically com-
bined by a supervised machine learning approach to a
single outcome. (Yasir et al., 2014) as well as (Abdul-
Rahman et al., 2012) use an artificial neural network
for classification. (Amarathunga et al., 2015) tested
several different machine learning approaches, in par-
ticular AdaBoost, Bayes Networks, decision trees,
multilayer perceptrons and Naive Bayes, where multi-
layered perceptrons performed best in their study.
(Nisar et al., 2013) employ an unsupervised ap-
proach (i.e. k-means clustering) for lesion segmenta-
tion. The texton-based eczema recognition approach
ICAART 2017 - 9th International Conference on Agents and Artificial Intelligence
76

(Suter et al., 2014) exploits nearest neighbor search
to determine the feature vector (and its associated
class label) most correlated to the input feature vec-
tor measured in terms of chi-square. (van der Maaten
and Postma, 2007) describe several generally usable
advanced texture recognition approaches, which are
presumably useful for eczema recognition, in particu-
lar frequency histograms, complex wavelet transform,
spin images and polar Fourier features. Finally, (Liu
and Fieguth, 2012) employed random projections of
the high dimensional texture patch vectors with the
goal to compress data without losing the ability to dis-
tinguish between texture classes.
The reported evaluation results of the individual
approaches are summarized in Table 1.
Table 1: Reported evaluation results for eczema categoriza-
tion (C) and segmentation (S).
Method Measure Goal Value
(Mittra and Parekh, 2011) Accuracy C 96.6%
(Yasir et al., 2014) Success Rate C 88.0%
(Amarathunga et al., 2015) Accuracy C 85.0%
(Suter et al., 2014) Accuracy S 78.0%
(Nisar et al., 2013) Accuracy S 76.6%
3 TRAINING DATA
In our previous work, we had access to photographs
of hands showing eczema patches of different size and
degrees of severity labeled by a single dermatologist
who created an overlay bit-mask for every image to
point out eczema regions, see Figure 1. Training and
evaluation was done on a per-pixel basis, being fully
aware that manual labeling can never be done with
such precision. In fact, some issues with data qual-
ity, such as labeled areas beyond the edges of hands,
could be sorted out algorithmically, and some ma-
chine learning algorithms are known to cope with a
certain degree of noise in training data. However, ret-
rospectively this issue was largely underestimated.
Picture of Hands
Position of the ecema
Figure 1: Image with eczema overlay mask.
In daily routine, dermatologists use to focus on the
most expressive and thus clinically relevant eczema
patches. Not surprisingly, small patches were there-
fore considered clinically relevant on some images
but not on others, and false positive diagnoses of clas-
sifiers were later assessed to correctly show eczema
patches that, in comparison to other areas on the same
image, were just not expressive enough for the la-
beling dermatologist. This made statistical evaluation
of classifiers nearly impossible. In order to weaken
this human bias in our data, we strived for obtaining
labeled images that represent a consensus diagnosis
among a group of experts. For this purpose we devel-
oped an online platform, where each invited dermatol-
ogist was asked to label a random sample of images
from our corpus, and derived a consensus diagnosis
per image through majority voting, see Figure 2.
Table 2: Performance of baseline classifiers on front-side
hand images; area error is reported in percentage points.
Classifier
Accuracy (%)
Recall (%)
Precision (%)
Specificity (%)
F
1
score (%)
Area error (pp)
Coin Flip 50.00 49.99 12.73 50.00 20.30 37.26
Majority Class 87.26 0.00 n/a 100.00 n/a 12.74
Minority Class 12.74 100.00 12.74 0.00 22.60 87.26
Table 3: Performance of baseline classifiers on back side
hand images; area error is reported in percentage points.
Classifier
Accuracy (%)
Recall (%)
Precision (%)
Specificity (%)
F
1
score (%)
Area error (pp)
Coin Flip 49.99 49.99 7.07 49.99 12.39 42.94
Majority Class 92.93 0.00 n/a 100.00 n/a 7.07
Minority Class 7.07 100.00 7.07 0.00 13.21 92.93
A second important observation regarding train-
ing and evaluation data concerns the intrinsic class
imbalance of eczema detection. Our available data ex-
poses an average ratio of 1:8 on front side and 1:15 on
back side hand images between eczema and healthy
skin pixels. As shows in Tables 2 and 3, a trivial
classifier that always outputs the majority class label
(i.e. healthy skin) would reach an accuracy of 87% or
93%, respectively. Classifier optimization and evalu-
ation based on accuracy (and similar measures) as re-
ported by the competing approaches in the literature
(see Table 1) is therefore not an option. Instead, we
subsequently report F
1
score measurements for clas-
On using Support Vector Machines for the Detection and Quantification of Hand Eczema
77
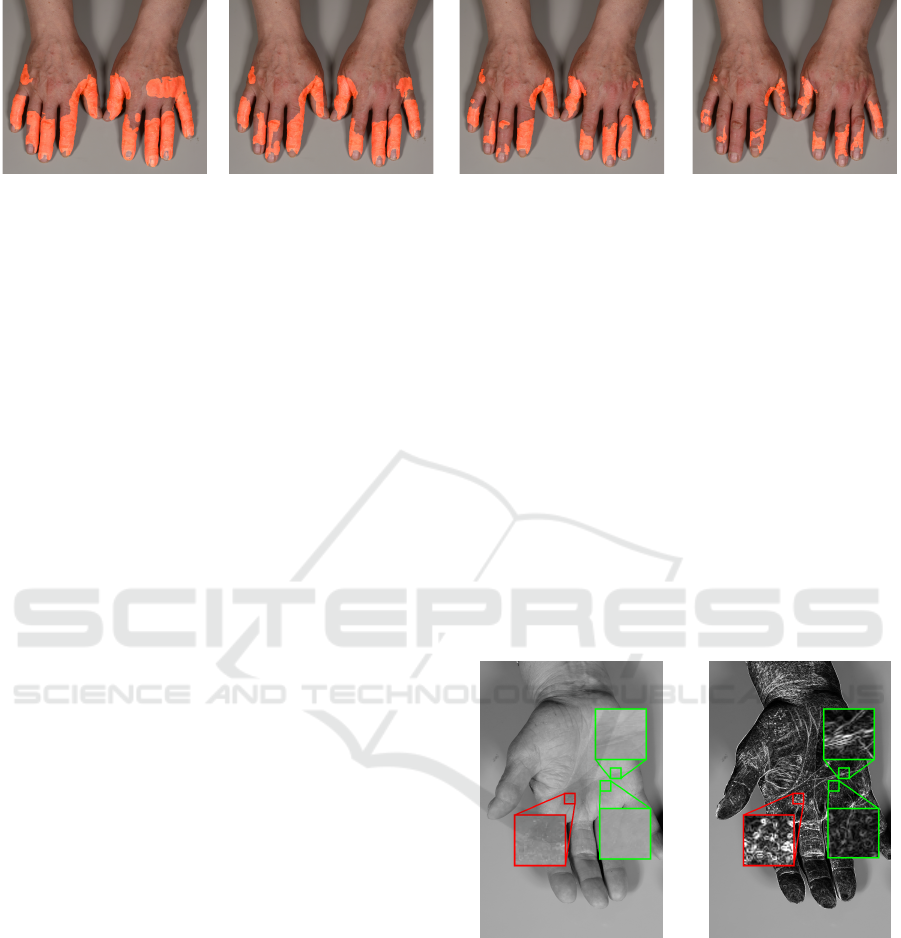
Figure 2: Consolidated diagnosis of at least 30%, 50%, 70% and 99% of the involved experts.
sifiers (see Section 5). High recall is reached when
most, ideally all, eczema pixels are correctly pre-
dicted; high precision, on the other hand, is reached
when most, ideally all, healthy skin pixels are cor-
rectly predicted. The F
1
score as the harmonic mean
between recall and precision takes these two often
contradictory goals into account.
4 METHODS
A Support Vector Machine (SVM) is used for classi-
fication with a variety of different input features. The
features are described in this section followed by the
different combinations employed in our experiments.
In contrast to the state-of-the-art eczema detection
and segmentation methods, we strive to reach a high
F
1
score and not necessarily the best possible accu-
racy. Optimizing for F
1
score presents a challenge,
since almost all SVM implementations target accu-
racy. One of the rare systems actually able to opti-
mize for the F
1
score, SVMPerf (Joachims, 2005) per-
formed very slowly on our dataset and therefore had
to be ruled out. Instead, we opted to use the (accuracy
optimizing) SVM implementation LIBSVM (Chang
and Lin, 2011) and boosted the F
1
score by the fol-
lowing measures:
• We oversampled our training data and removed
Tomek links, see Section 4.2. Oversampling nor-
mally improves the F
1
-Score obtained for imbal-
anced data sets for the following reason: Since the
SVM model reflects the distribution of the data,
the majority class will usually be predicted more
often by the SVM than the minority class. How-
ever, the F
1
-Score usually focuses on the minority
class (this is also the case in our scenario). So the
precision will be quite high but the recall poor.
Strongly deviating precision and recall values re-
sult in a low F
1
-Score (harmonic mean of preci-
sion and recall). By oversampling the values in
the minority class, the values of recall and pre-
cision draw closer together and therefore the F
1
-
Score increases (see also (Liu, 2004)).
• False positives and false negatives were weighted
differently inside the quadratic optimization pro-
cess conducted by the SVM. For determining the
optimal weights, we applied a grid search to the
training set and chose the combination of weights
and regularization parameters that led to the high-
est F
1
score on a held out set, see Section 4.3.
4.1 Features
We masked out the image background and calculated
all features from pixels showing skin only. To calcu-
late the features, a pixel’s neighborhood of 41 ×41
pixels is considered. Figure 3 highlights some dif-
ferences between textures of eczematous and healthy
skin; the red square shows an eczematous region, the
green squares two healthy regions (the lower shows
smooth skin, the upper skin with hand lines, respec-
tively), and their magnification.
(a) Grayscale image. (b) Gradient magnitude
from grayscale image
(Sobel operator).
Figure 3: Difference between eczematous and healthy skin.
4.1.1 Filters and Textons
Filter sets have a long history in image processing and
were inspired by models of processing in the early
stages of the primate visual system. Often they are
modeled using radially symmetric and odd- and even-
symmetric filters at different resolution (Malik et al.,
2001). In (Varma and Zisserman, 2005) a set of 38
ICAART 2017 - 9th International Conference on Agents and Artificial Intelligence
78

filters is used, which are combined into 8 filter re-
sponses (MR8) by calculating the maximum across
multiple orientations. The filters include a Gaussian,
a Laplacian of a Gaussian and first and second deriva-
tive filters at six orientations and three scales. More
recently (Mellor et al., 2008) uses combinations of
filters to achieve more invariance with respect to con-
trast, rotation and scale. While filter responses contain
a rich detail of the pixel neighborhood, they might not
be a very efficient representation of the relevant fea-
tures of a class. Therefore, they are often aggregated
from all the responses of a single class and clustered.
The resulting cluster centers called textons form a dic-
tionary. In this work, the MR8 filter set is used to-
gether with other features, see Section 4.1.4.
4.1.2 Gray Level Co-occurrence Matrix
Another popular approach to capture the texture prop-
erties of a patch is the gray level co-occurrence matrix
(GLCM) introduced by (Haralick et al., 1973). The
GLCM measures how often a specific combination of
a pixel value and the value of a neighboring pixel in a
specific direction occurs in the patch. All channels of
all color spaces take values between 0 and 255, thus
resulting in GLCMs of dimension 256×256. The ma-
trix can be calculated using different spacings to the
neighboring pixel, often called stride, and in differ-
ent directions. For this work, we use a stride of one
and average over the 4 principle directions to yield a
rotational invariant description. Moreover, we calcu-
late the GLCMs once on the grayscale images, once
on the CIE Lab L* channel, as suggested by (Gebejes
and Huertas, 2013), and once on the magnitude of the
gradient of the grayscale images to accentuate certain
eczema structures like fissures. Following (Haralick
et al., 1973) and (Gebejes and Huertas, 2013), we cal-
culate several features from the GLCM, namely en-
tropy, energy, homogeneity, contrast and dissimilar-
ity, see Equations (1). p(i, j) ∈ R denotes the (i, j)
th
component in the GLCM.
Entropy = −
∑
i, j
p(i, j)log p(i, j)
Energy =
∑
i, j
p(i, j)
2
Homogeneity =
∑
i, j
p(i, j)
1+|i−j|
Contrast =
∑
i, j
(i − j)
2
p(i, j)
Dissimilarity =
∑
i, j
|i − j|p(i, j)
(1)
According to (Gebejes and Huertas, 2013), these fea-
tures are connected to each other; they emphasize the
following aspects:
• Entropy aims to capture spatial disorder. Ran-
dom distributions would gain high entropy,
whereas solid tone images result in zero entropy.
• Energy is a measure of local homogeneity, thus
constituting the opposite of entropy. More homo-
geneous images correspond to high energy, con-
stant images expose an energy of 1.
• Homogeneity measures the uniformity of the
non-zero entries and is equal to 1 when the image
exposes no variation.
• Contrast captures the variation in the GLCM. If
neighboring pixels are similar in their value, con-
trast is low. Constant images correspond to a con-
trast of zero.
• Dissimilarity measures variation of gray level
pairs, similarly to contrast, but contrast grows
quadratically. Constant images expose a dissim-
ilarity of zero.
4.1.3 Color
Images tend to be available in the RGB color space.
However, this space is not optimal for image process-
ing as the channels are highly correlated, are psycho-
logically non-intuitive and non-uniform in respect to
the perceived differences between colors. As the train-
ing data is labeled by experts who might rely on color
differences, this cannot be neglected. Our calcula-
tion are performed in the CIE Lab color space, which
has the advantage of being an absolute color space
that uses perceptual uniformity. Additionally we use
the HSI (Hue, Saturation, Intensity) color space for
a more intuitive description of color and better sep-
aration of the color tone values as for example red-
ness might be an influential property for distinguish-
ing eczema.
For the detection of eczema it seem to be a valid
hypothesis that color provides additional information,
and thus several texture properties should be calcu-
lated using color. In order to describe the neighbor-
hood of a pixel, we calculate several color moments
(Stricker and Orengo, 1995), namely the mean, the
empirical standard deviation, the skewness and the
kurtosis on each channel of the RGB, the CIE Lab
and the HSI color spaces, see Equations (2). p( j) ∈ R
denotes the color channel value of the j
th
pixel in the
considered neighborhood of N ∈N pixels.
Mean (µ) =
1
N
∑
N
j=1
p( j)
Standard Dev. =
q
1
N
∑
N
j=1
(p( j) −µ)
2
Skewness =
3
q
1
N
∑
N
j=1
(p( j) −µ)
3
Kurtosis =
4
q
1
N
∑
N
j=1
(p( j) −µ)
4
(2)
On using Support Vector Machines for the Detection and Quantification of Hand Eczema
79

Table 4: Correlation coefficients of selected features with
class label.
Feature PCC
GLCM grayscale dissimilarity 0.30
GLCM grayscale+Sobel entropy 0.29
CM CIELab std. dev. 0.24
CM RGB kurtosis 0.21
MR8 T40 texton #9 0.18
MR8 T40 texton #17 -0.14
CM HSI mean -0.18
GLCM Sobel homogeneity -0.27
4.1.4 Feature Combinations
We conduct several experiments with different feature
sets, of which the most interesting results were ob-
tained by the following settings:
• T40: Histograms of 40 textons calculated from the
filter responses of the MR8 filter bank. No color
moments or GLCMs are used.
• CM1/GLCM1: Color moments in RGB space
and GLCM on grayscale image.
• T40/CM1/GLCM2: 40 textons, color moments
on CIE Lab space, GLCM on CIE Lab L* chan-
nel, GLCM on grayscale images with Sobel oper-
ator.
• T40/CM3/GLCM3: Like T40/CM1/GLCM2 but
with additional color moments on RGB and HSI
space, and an additional GLCM calculated on the
grayscale image.
• T40/CM3/GLCM3/TL/S: T40/CM3/GLCM3
with the removal of Tomek links with subsequent
oversampling via SMOTE (see Section 4.2).
• CM3/GLCM3/TL/S: T40/CM3/GLCM3/TL/S
but without the texton features.
We calculate the Pearson product-moment cor-
relation coefficient (PCC) for all features with re-
spect to the corresponding class for each example and
found that features from the GLCMs show the high-
est |PCC|, followed by the color moments, followed
by the texton histogram features. A high PCC magni-
tude indicates (linearly) discriminating features. Ta-
ble 4 shows a selection of features from one image
with their PCC value.
4.2 Data Preprocessing
Since the available data is imbalanced, in our most
successful experiments, the minority (i.e. positive)
class is oversampled by applying the Synthetic Mi-
nority Oversampling Technique (SMOTE) algorithm
developed in (Chawla et al., 2002). For each example
of the positive class, SMOTE determines its K nearest
positive neighbors with respect to the Euclidean dis-
tance. Then, one of those neighbors is selected ran-
domly, and a new data instance is created at a ran-
domly chosen position on the line segment between
the original data example and the selected neighbor.
We set K = 5 and repeatedly apply SMOTE until the
minority are majority classes are of similar size.
There are some potential issues when applying
SMOTE, e.g., its application might amplify existing
problems such as outliers or noise, and it assumes the
neighborhood of a positive example is also positive
(Batuwita and Palade, 2013; Wu and Chang, 2003).
One strategy to mitigate these issues is the application
of data cleaning techniques such as the removal of
Tomek links. Given two examples E
i
and E
j
belonging
to different classes with distance d(E
i
, E
j
) between E
i
and E
j
: A pair (E
i
, E
j
) is called a Tomek link if there
is not an example E
l
, such that d(E
i
, E
l
) < d(E
i
, E
j
)
or d(E
j
, E
l
) < d(E
i
, E
j
) (Batista et al., 2004)
1
. We
search the data examples for Tomek links and remove
their negative class example only to not further dimin-
ish the positive class examples. This is repeated until
no further Tomek links exist.
For the features x barely correlated to the class
(|PCC| < 0.1), we calculate a number of transforma-
tions like
√
x or ln|x|. If the |PCC| of the transformed
feature is increased, we provide the transformed fea-
ture instead of the original to the SVM.
Due to runtime considerations, a subset of up to
1 ‰ (about 10
4
examples) is sampled in a random-
ized, stratified fashion from the available training data
and used to train the SVM.
4.3 Evaluation
The available image material consists of a total of
48 hand photographs of a size of 1-2 megapixels, of
which 24 show front sides, and the other 24 show
back sides of hands. For each photography, there are
between 1 and 11 associated expert labels which are
consolidated to the final label, the experts’ consensus
diagnoses. The hands are separated from the back-
ground and only pixels displaying skin are used as
data examples. We evaluate our approach for images
of front and back sides separately. This accounts for
the presumed differences in the skin’s structure (e.g.
wrinkles) as well as in specific skin features (e.g. hair
density) between the front and back sides of hands,
1
Please note that in the literature there exist several non-
equivalent definitions of Tomek links.
ICAART 2017 - 9th International Conference on Agents and Artificial Intelligence
80
as previous work suggests (Suter et al., 2014). Since
our corpus is comparatively small, we evaluate using
a 9-fold cross-validation. From the 24 images, those
6 with the least number of expert’s labels are held
out to serve as test set for the SVM’s hyperparame-
ter search for each fold, leaving 18 images, of which
for each fold 2 are evaluated. A single confusion ma-
trix is calculated on all folds’ results. From this ma-
trix, we report accuracy, precision, recall, the F
1
score
and an absolute area error, see Equations (3) (T/F =
true/false, P/N = positives/negatives). The area error
is reported because it is a contributing factor for the
HECSI score as mentioned in Section 1.
Accuracy =
T P+T N
T P+FN+T N+F P
Precision =
T P
T P+FP
Recall =
T P
T P+FN
Specificity =
T N
T N+FP
F
1
Score = 2 ·
Precision·Recall
Precision+Recall
Area Error = |
(T P+FN)−(T P+FP)
T P+FN+T N+F P
|
(3)
For all our experiments, we utilize the LIBSVM
implementation (Chang and Lin, 2011) of an SVM,
together with the Gaussian radial based function
(RBF) kernel and different error costs for the two
classes (reflecting the ratio of the number of negative
to positive training examples as proposed by (Ben-
Hur and Weston, 2010)). For each fold, we conduct
a grid search over the SVM’s hyperparameters C (the
weight of the optimization objective’s regularization
term, i.e. the misclassification cost) and γ (the free pa-
rameter of the RBF kernel, γ = (2σ
2
)
−1
), using the
fold’s training examples to train the SVM and the
held out examples to evaluate its performance. The
SVM with the hyperparameters yielding the highest
F
1
score is retained and the fold’s 2 unseen images
are predicted.
5 RESULTS
In this section, we present the results of the exper-
iments selected and described in Section 4.1.4. The
keys to the visualizations are provided in Figure 4 in-
dicating the colors and symbols used in the plots.
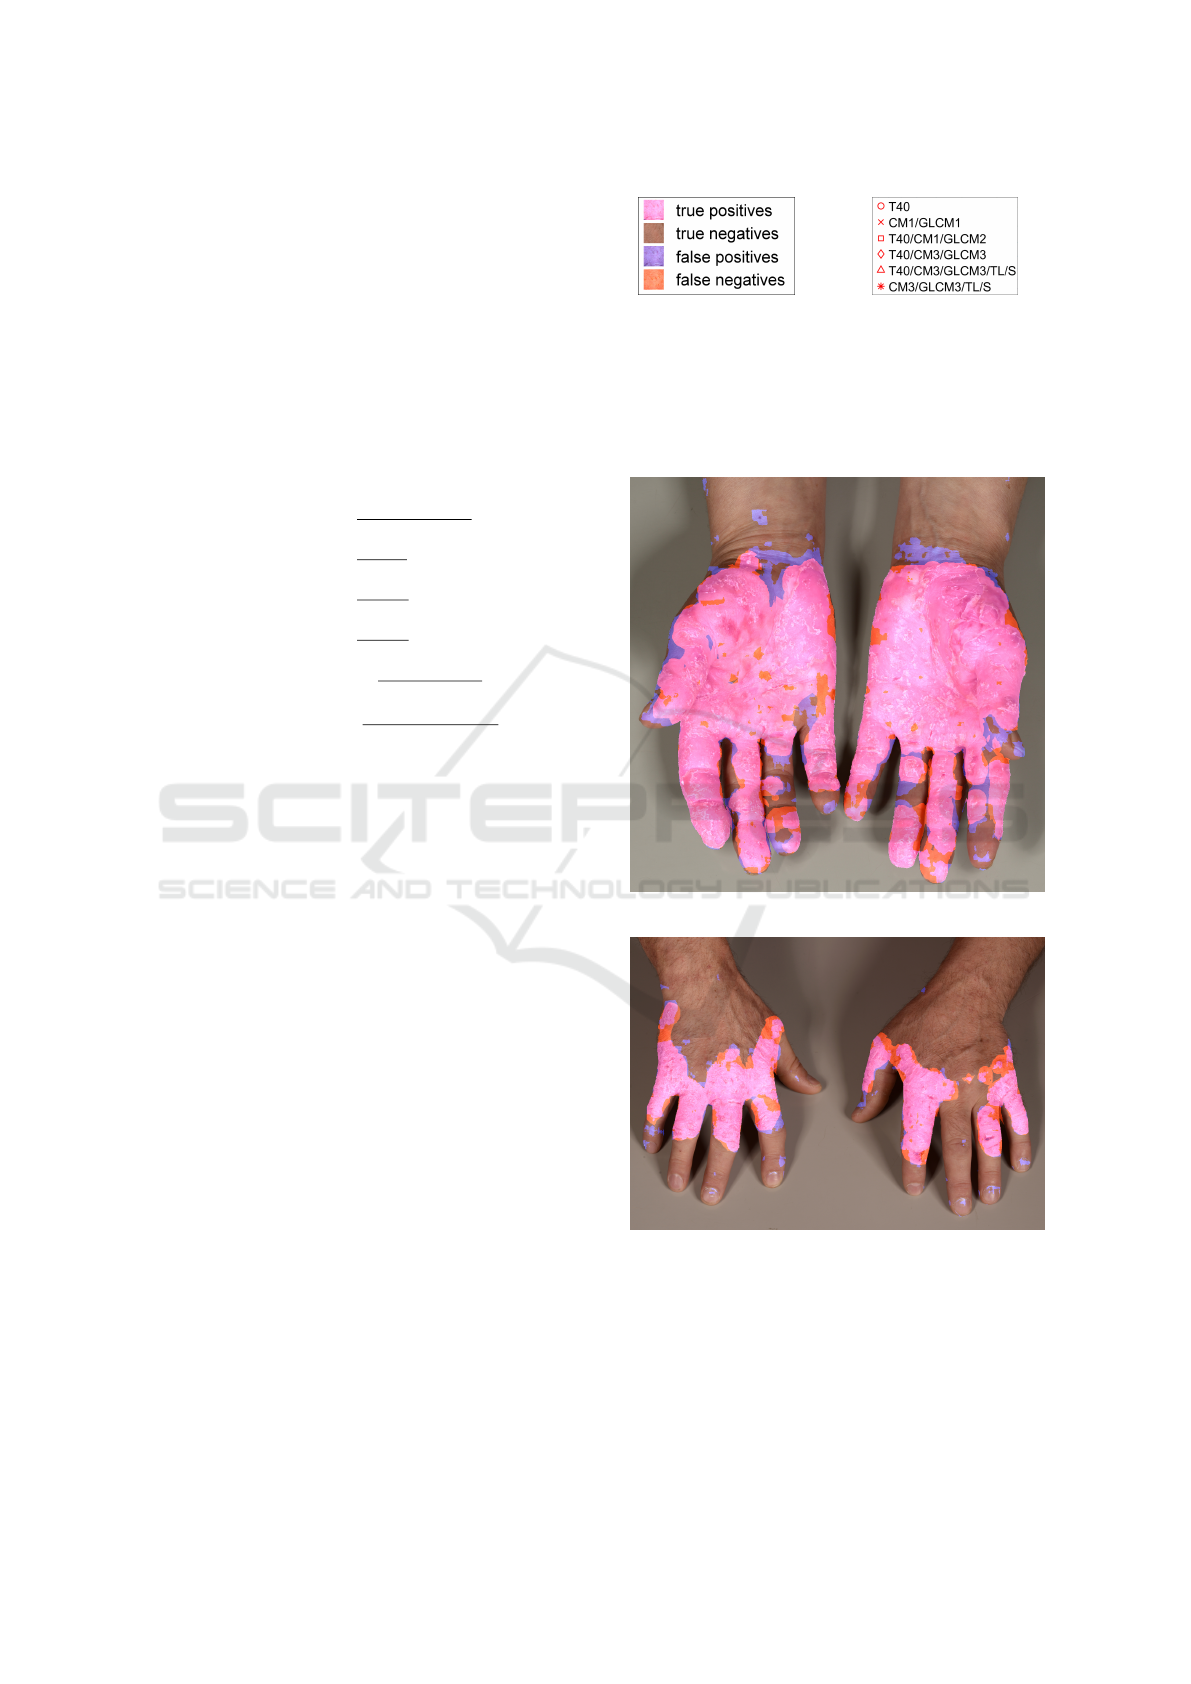
Figure 5 shows the best results obtained over all
experiments for the front and back sides sets, respec-
tively. Their individual F
1
scores reach a satisfac-
tory level. This objective measurement corresponds
to the intuitive impression conveyed by the images.
From the visualization, it is obvious that the predicted
(a) Colors key. (b) Experiments key.
Figure 4: Keys to visualizations in this section.
classes form connected regions, and not e.g. scattered
pixels all across the image. We conclude that the fea-
tures chosen capture the differences between eczema-
tous and healthy skin quite well.
(a) Best front side image with F
1
= 91.97%.
(b) Best back side image with F
1
= 86.75%.
Figure 5: Results with highest F
1
score of all experiments.
Tables 5 and 6 show the results of the experiments
for front and back sides of hands, respectively. All ex-
periments clearly outperform the baseline classifiers
introduced in Section 3 with respect to the F
1
score –
not necessarily with respect to accuracy, area error
or other metrics, which again puts emphasis on the
On using Support Vector Machines for the Detection and Quantification of Hand Eczema
81
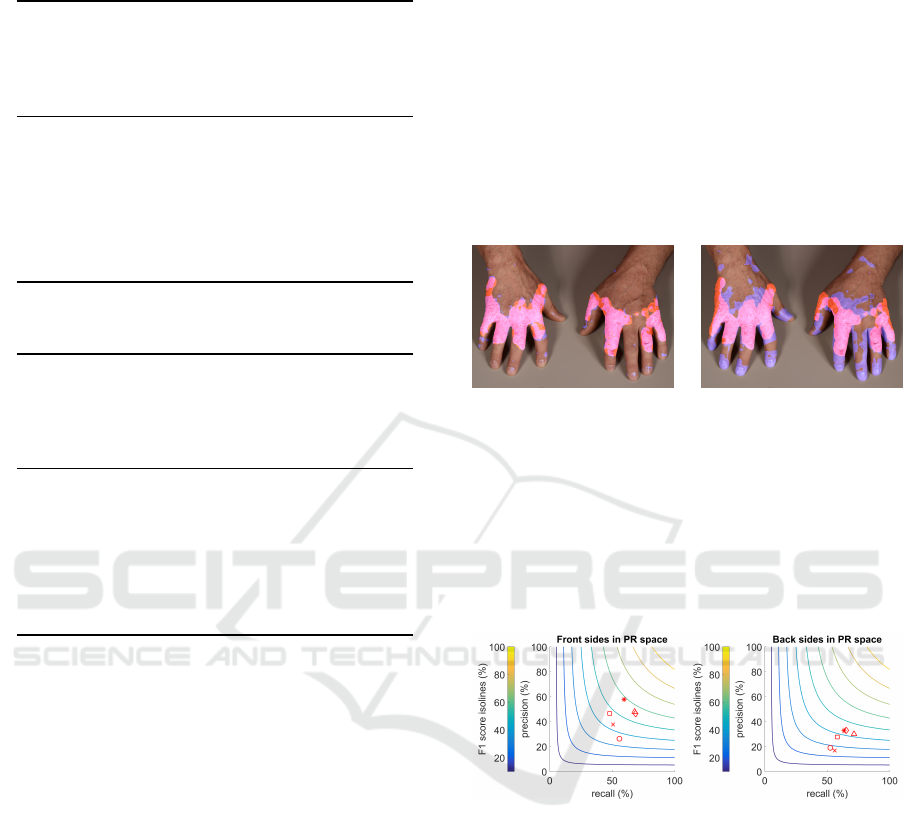
Table 5: Summary of experiments: front sides of hands.
Experiment
Accuracy (%)
Recall (%)
Precision (%)
Specificity (%)
F
1
score (%)
Area error (pp)
T40 74.50 55.73 26.33 77.24 35.77 14.83
CM1/GLCM1 83.01 50.69 37.61 87.73 43.18 7.77
T40/CM1/GLCM2 86.33 48.00 46.46 91.92 47.22 8.15
T40/CM3/GLCM3 85.88 68.69 46.33 88.38 55.34 6.68
T40/CM3/GLCM3/TL/S 86.53 67.92 47.97 89.25 56.23 7.39
CM3/GLCM3/TL/S 89.29 59.54 57.69 93.63 58.60 4.60
Table 6: Summary of experiments: back sides of hands.
Experiment
Accuracy (%)
Recall (%)
Precision (%)
Specificity (%)
F
1
score (%)
Area error (pp)
T40 80.71 52.49 18.90 82.86 27.80 13.31
CM1/GLCM1 77.39 55.90 16.86 79.02 25.91 18.04
T40/CM1/GLCM2 86.27 58.13 27.63 88.41 37.46 9.97
T40/CM3/GLCM3 88.20 65.14 33.04 89.95 43.84 8.38
T40/CM3/GLCM3/TL/S 86.22 71.43 30.06 87.35 42.32 10.55
CM3/GLCM3/TL/S 88.17 63.48 32.68 90.05 43.15 8.26
necessity to focus on metrics like the F
1
score when
evaluating classification performance on imbalanced
data.
The T40 experiment, conducted by utilizing tex-
ton frequencies as features for the SVM only, shows
the worst results with respect to all measurements ex-
cept recall on the front sides. The results are compa-
rable to previous work (Suter et al., 2014) with a sim-
pler classifier, which suggests that texton frequencies
alone are not sufficient to provide satisfactory results
for detecting hand eczema.
When enriching the texton features with color mo-
ments and features calculated from GLCMs, even
when abstaining from using texton features at all, the
classification performance improves considerably. Ta-
ble 5 shows continuous improvements with respect to
the F
1
score the more features are used, culminating in
the best performance when additionally oversampling
of the training examples and data cleaning is con-
ducted. Clearly, improvements in precision allowed
for improvements in the F
1
score as well. For the back
sides of hands shown in Table 6, similar observations
hold. However, here the final CM3/GLCM3/TL/S ex-
periment lead to a slightly worse precision. This can
be caused by differences with respect to skin fea-
tures (e.g. hair density), or the different ratio between
eczema and healthy skin pixels as observed in Sec-
tion 3. Further research will be necessary to defini-
tively isolate this effect.
For a particular image, Figure 6 opposes the
best result (experiment CM3/GLCM3/TL/S from Fig-
ure 5) to the worst (experiment T40). Observe in par-
ticular the big difference in precision. Moreover, Fig-
ure 6b provides several insights on difficulties for the
classifier, e.g., fingernails are often detected as false
positives, and wrinkles pose another challenge.
(a) F
1
= 86.75%. (b) F
1
= 65.56%.
Figure 6: Same image in different experiments.
In Figure 7, we plot the F
1
score of the discussed
experiments for front and back sides separately into
precision-recall (PR)space. The hyperbolic isolines of
the F
1
score are plotted in steps of 10 percentage
points to provide for a better intuition of the PR space.
This emphasizes another challenge for almost all clas-
sifiers, which is to reach a satisfactory precision level.
(a) Front sides. (b) Back sides.
Figure 7: F
1
score in PR space with a number of isolines.
In Figure 8, we display the area error reached by
our classifier. The visualization consists of a box plot
of each expert’s absolute area error (or deviation) with
respect to the consensus diagnoses. We suggest to in-
terpret this box plot as the baseline that should be
reached by the predictions of a trained classifier. The
arithmetic mean is plotted as a blue dot and the area
errors of the experiments are displayed in the same
figure, right to the central axis the box plot is aligned
on. Disregarding outliers, human experts seem to dif-
fer from the consensus diagnoses by about 0 to 10 per-
centage points. Our best classifier for the front side of
hands performs as well as the median of the experts’
labels, which is a very satisfactory result with respect
to the area error metric. The best classifiers for the
ICAART 2017 - 9th International Conference on Agents and Artificial Intelligence
82

back sides of hands do not reach the median, but at
least would not be considered outliers (like the worst
classifiers) compared to the box plot. Again, this indi-
cates that eczema detection on the back sides of hands
is more challenging than on the front sides.
(a) Front sides. (b) Back sides.
Figure 8: Area error as box plots.
For comparison, we have implemented the ap-
proach of (Varma and Zisserman, 2009) for eczema
detection and obtained an accuracy of 81.2% for front
and 86.63% for back sides of hands, while observing
a surprisingly low F
1
score on our data set: 30.48%
for front sides, 14.79% for back sides, respectively.
In addition, we evaluated the unsupervised clustering-
based segmentation of (Nisar et al., 2013), see Sec-
tion 2. The highest F
1
score was achieved by cluster-
ing on the red channel of the RGB color space model
(selecting adapt light compensate as preprocessing),
i.e. F
1
score of 15.04% for front sides and 14.47% for
back sides of hand.
6 CONCLUSION AND OUTLOOK
Our results demonstrate that a combination of differ-
ent families of features enhanced with extensive data
cleaning before being fed into a standard SVM clas-
sifier leads to superior results for distinguishing be-
tween healthy and eczematous skin as compared to
several state-of-the-art techniques. We previously at-
tempted (Suter et al., 2014) to integrate color with
the MR8 features directly as suggested in (Varma
and Zisserman, 2005), but were not able to reach a
significant improvement compared to pure MR8 fea-
tures without color information. We now show a much
more successful integration of color features giving a
major improvement over the previous results.
Results on the back side of the hand are cur-
rently not as good as on the front, presumably due
to e.g. more hairs, other structures with finger nails
and more prominent wrinkles on the joints. So, fur-
ther challenges remain to still improve on the features
or maybe use different learning strategies for different
parts of the hand.
One of the most crucial elements of any success-
ful supervised learning approach is the quality of the
input data. In our project, we have seen large differ-
ences between the labelling of the data from different
dermatologists and have shown a way to mitigate this
problem using a consensus diagnosis. Nonetheless,
we aim to provide dermatologists with better tools for
the labelling in order to get more homogeneous data.
Recently, deep learning has been very success-
ful in image classification (Krizhevsky et al., 2012;
Szegedy et al., 2015) and object detection (Szegedy
et al., 2013; Ren et al., 2015). As Neural Networks
aim to learn the complete image processing pipeline,
the feature selection is done by the network, mak-
ing it unnecessary to specify the feature combina-
tions beforehand. We are going to investigate these
approaches for eczema detection as well as some re-
cent techniques that use neural networks either only
for feature selection or only as a classifier.
ACKNOWLEDGEMENTS
We would like to thank CTI
2
for funding this re-
search and swiss4ward
3
and the University Hospital
of Zurich
4
for the productive collaboration.
REFERENCES
Abdul-Rahman, S., Norhan, A. K., Yusoff, M., Mohamed,
A., and Mutalib, S. (2012). Dermatology diagno-
sis with feature selection methods and artificial neu-
ral network. In Proceedings of the IEEE EMBS
Conference on Biomedical Engineering and Sciences
(IECBES), pages 371–376. IEEE.
Amarathunga, A., Ellawala, E., Abeysekara, G., and Amal-
raj, C. (2015). Expert system for diagnosis of skin
diseases. International Journal of Scientific and Tech-
nology Research, 4(1).
Batista, G. E. A. P. A., Prati, R. C., and Monard, M. C.
(2004). A study of the behavior of several methods
for balancing machine learning training data. ACM
SIGKDD Explorations Newsletter, 6(1):20–29.
Batuwita, R. and Palade, V. (2013). Class imbalance learn-
ing methods for support vector machines. In He, H.
and Ma, Y., editors, Imbalanced learning, pages 83–
99. John Wiley & Sons, Inc, Hoboken, New Jersey.
Ben-Hur, A. and Weston, J. (2010). A user’s guide to sup-
port vector machines. Methods in molecular biology
(Clifton, N.J.), 609:223–239.
2
Commission for Technology and Innovation, CTI,
http://www.kti.admin.ch/
3
http://swiss4ward.com/
4
http://www.en.usz.ch/
On using Support Vector Machines for the Detection and Quantification of Hand Eczema
83

Chang, C.-C. and Lin, C.-J. (2011). LIBSVM:
A library for support vector machines. ACM
Transactions on Intelligent Systems and Tech-
nology, 2:27:1–27:27. Software available at
http://www.csie.ntu.edu.tw/ cjlin/libsvm.
Chawla, N. V., Bowyer, K. W., Hall, L. O., and Kegelmeyer,
W. P. (2002). Smote: synthetic minority over-
sampling technique. Journal of Artificial Intelligence
Research, 16(1):321–357.
Cula, O. G., Dana, K. J., Murphy, F. P., and Rao, B. K.
(2004). Bidirectional imaging and modeling of skin
texture. IEEE Transactions on Biomedical Engineer-
ing, 51(12):2148–2159.
Diepgen, T. L. (2003). Occupational skin-disease data in
europe. International Archives of Occupational and
Environmental Health, 76(5):331–338.
English, J. (2016). Current concepts of irritant contact der-
matitis. Occupational and Environmental Medicine,
61:722726.
Gebejes, A. and Huertas, R. (2013). Texture characteriza-
tion based on grey-level co-occurrence matrix. In Pro-
ceedings of the Conference of Informatics and Man-
agement Sciences, volume 2, pages 375–378. EDIS -
Publishing Institution of the University of Zilina.
Hald, M., Berg, N., Elberling, J., and Johansen, J. (2008).
Medical consultations in relation to severity of hand
eczema in the general population. The British Journal
of Dermatology, 158:773–777.
Haralick, R. M., Shanmugam, K., and Dinstein, I. (1973).
Textural features for image classification. IEEE
Transactions on Systems, Man, and Cybernetics,
SMC-3(6):610–621.
Joachims, T. (2005). A support vector method for multi-
variate performance measures. In Proceedings of the
22nd International Conference on Machine Learning
(ICML), Bonn, Germany.
Johansen, J. et al. (2011). Classification of hand eczema:
clinical and aetiological types. Based on the guideline
of the Danish Contact Dermatitis Group. Contact Der-
matitis, 65(1):13–21.
Krizhevsky, A., Sutskever, I., and Hinton, G. E. (2012). Im-
agenet classification with deep convolutional neural
networks. In Proceedings of the Conference on Neural
Information Processing Systems (NIPS), pages 1097–
1105.
Liu, A. Y. (2004). The effect of oversampling and un-
dersampling on classifying imbalanced text datasets.
Master’s Thesis, University of Texas.
Liu, L. and Fieguth, P. (2012). Texture classification from
random features. IEEE Transactions on Pattern Anal-
ysis and Machine Intelligence, 34(3):574–586.
Malik, J., Belongie, S., Leung, T., and Shi, J. (2001). Con-
tour and texture analysis for image segmentation. In-
ternational journal of computer vision, 43(1):7–27.
Meding, B., Wrangsj
¨
o, K., and J
¨
arvholm, B. (2005).
Fifteen-year follow-up of hand eczema: persistence
and consequences. The British Journal of Dermatol-
ogy, 152:975–980.
Mellor, M., Hong, B.-W., and Brady, M. (2008). Locally
rotation, contrast, and scale invariant descriptors for
texture analysis. IEEE Transactions on Pattern Anal-
ysis and Machine Intelligence, 30(1):52–61.
Mittra, A. K. and Parekh, D. R. (2011). Automated detec-
tion of skin diseases using texture. International Jour-
nal of Engineering Science and Technology, 3:4801–
4808.
Nisar, H., Ch’ng, Y. K., Chew, T. Y., Tang, J., Yap, V.,
and Yeap, K. (2013). A color space study for skin
lesion segmentation. In Proceedings of the Interna-
tional Conference on Circuits and Systems (ICCAS),
pages 172–176. IEEE.
Ren, S., He, K., Girshick, R., and Sun, J. (2015). Faster
r-cnn: Towards real-time object detection with region
proposal networks. In Proceedings of the Conference
on Neural Information Processing Systems (NIPS),
pages 91–99.
Sparavigna, A. and Marazzato, R. (2010). An image-
processing analysis of skin textures. Skin research and
technology, 16(2):161–167.
Stricker, M. A. and Orengo, M. (1995). Similarity of
color images. In Niblack, W. and Jain, R. C., edi-
tors, Proceedings of the IS&T/SPIE’s Symposium on
Electronic Imaging: Science & Technology, SPIE Pro-
ceedings, page 381. SPIE.
Suter, C., Navarini, A., Pouly, M., Arnold, R., Gutzwiller,
F. S., Meier, R., and Koller, T. (2014). Detection
and quantification of hand eczema by visible spectrum
skin pattern analysis. In Schaub, T., Friedrich, G., and
O’Sullivan, B., editors, ECAI 2014, volume volume
263 of Frontiers in Artificial Intelligence and Appli-
cations, pages 1101–1102. IOS Press, Amsterdam.
Szegedy, C., Liu, W., Jia, Y., Sermanet, P., Reed, S.,
Anguelov, D., Erhan, D., Vanhoucke, V., and Rabi-
novich, A. (2015). Going deeper with convolutions.
In Proceedings of the IEEE Conference on Computer
Vision and Pattern Recognition, pages 1–9.
Szegedy, C., Toshev, A., and Erhan, D. (2013). Deep neural
networks for object detection. In Proceedings of the
Conference on Neural Information Processing Sys-
tems (NIPS), pages 2553–2561.
van der Maaten, L. and Postma, E. (2007). Texton-based
texture classification. In Proceedings of Belgium-
Netherlands Artificial Intelligence Conference.
Varma, M. and Zisserman, A. (2005). A statistical approach
to texture classification from single images. Interna-
tional Journal of Computer Vision, 62(1-2):61–81.
Varma, M. and Zisserman, A. (2009). A statistical ap-
proach to material classification using image patch ex-
emplars. IEEE transactions on pattern analysis and
machine intelligence, 31(11):2032–2047.
Wu, G. and Chang, E. Y. (2003). Class-boundary alignment
for imbalanced dataset learning. In Proceedings of the
ICML 2003 workshop on learning from imbalanced
data sets II, Washington, DC, pages 49–56.
Yasir, R., Rahman, M. A., and Ahmed, N. (2014). Der-
matological disease detection using image processing
and artificial neural network. In Proceedings of the
International Conference on Electrical and Computer
Engineering (ICECE), pages 687–690.
ICAART 2017 - 9th International Conference on Agents and Artificial Intelligence
84
