
Towards Enhancing the Visual Analysis of Interdomain Routing
Alex Ulmer
1
, J
¨
orn Kohlhammer
1
and Haya Shulman
2
1
Fraunhofer Institute for Computer Graphics Research IGD Darmstadt, Darmstadt, Germany
2
Fraunhofer Institute for Secure Information Technology SIT Darmstadt, Darmstadt, Germany
Keywords:
Interdomain Routing, Border Gateway Protocol, BGP, Problem Characterization, Visual Analysis, Log Data,
Roadmap.
Abstract:
Interdomain routing with Border Gateway Protocol (BGP) plays a critical role in the Internet, determining
paths that packets must traverse from a source to a destination. Due to its importance BGP also has a long
history of prefix hijack attacks, whereby attackers cause the traffic to take incorrect routes, enabling traffic
hijack, monitoring and modification by the attackers. Proposals for securing the protocol are adopted slowly
or erroneous. Our goal is to create a novel visual analytics approach that facilitates easy and timely detection
of misconfigurations and vulnerabilities both in BGP and in the secure proposals for BGP. This work initiates
the analysis of the problem, the target users and state of the art approaches. We provide a comprehensive
overview of the BGP threats and describe incidents that happened over the past years. The paper introduces
two new user groups beside the network administrators, which should also be addressed in future approaches.
It also contributes a survey about visual analysis of interdomain routing with BGP and secure proposals for
BGP. The visualization approaches are rated and we derive seven key challenges that arise when following our
roadmap for an enhanced visual analysis of interdomain routing.
1 INTRODUCTION
Interdomain routing is one of the main components
to make the Internet work. The core protocol that is
used for communication between Autonomous Sys-
tems (ASes) is already more than 20 years old. The
Border Gateway Protocol (BGP) was introduced in
the early 90s and was continuously updated until its
latest version in 2006. At the time the protocol was
developed the assumption was that each AS can trust
its neighbors. No security features were integrated
in the protocol, which poses a serious threat nowa-
days. The severity of this problem is highly under-
estimated by companies and governments. A typical
argument is that there is no need to secure the infras-
tructure of the Internet when the data is already en-
crypted so that even if data is intercepted, it is still
safe. But there are two problems. On the one hand,
the encryption may eventually be decoded. On the
other hand, the data may not reach its destination.
The second aspect is very important as most busi-
nesses are handled online, and a downtime of multi-
ple hours can cause huge financial damage. There are
already several incidents happening each year where
big parts of the Internet suffer from disrupted connec-
tions caused by routing problems. Several new proto-
cols have been proposed (Kent et al., 2000; Ganichev
et al., 2010), but none of them was established. The
reason is that all ASes need to switch to the new pro-
tocol at once to gain a benefit. This is not feasible in
practice because many international stakeholders fol-
low different goals. To keep the routing operational,
Internet Service Providers (ISPs) developed custom
rules and filter mechanisms to prevent incorrect prop-
agation of routing updates. But these are individual
workarounds and not general solutions to the prob-
lem. Because of these facts, we believe that a more
promising way is to enhance the current protocol in a
way that even single adopters gain a benefit. This low-
ers the barrier to use the new features and may lead to
a contagious diffusion of the enhancements. There-
fore, we determined three opening steps that lead to
more practical BGP improvements.
1. Analysis of current activities in interdomain rout-
ing on a global scope
2. Detection of the most frequently exploited weak-
nesses
3. Evaluation and development of security exten-
sions and configurations for improved routing
The focus of this work is on the first step. In the past,
multiple applications were proposed to approach this
Ulmer A., Kohlhammer J. and Shulman H.
Towards Enhancing the Visual Analysis of Interdomain Routing.
DOI: 10.5220/0006126702090216
In Proceedings of the 12th International Joint Conference on Computer Vision, Imaging and Computer Graphics Theory and Applications (VISIGRAPP 2017), pages 209-216
ISBN: 978-989-758-228-8
Copyright
c
2017 by SCITEPRESS – Science and Technology Publications, Lda. All rights reserved
209
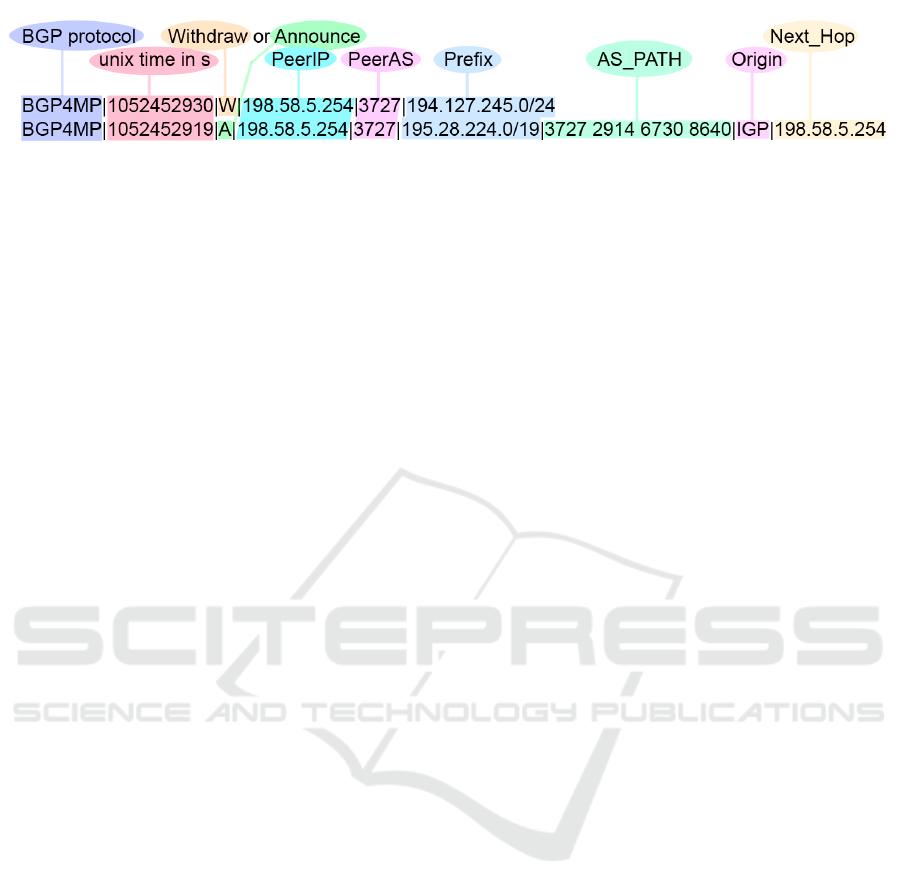
Figure 1: Border Gateway Protocol Update Log Example.
problem (see Section 4), but all of them are limited to
the inspection of a specific subnet of ASes or an IP
Prefix. This suffices to solve immediate routing prob-
lems, but it does not give an overview of the whole
state of the routing infrastructure. We believe that
the overview is necessary to get a profound compre-
hension of the network and its known and unknown
weak spots. Thus, new scalable and interactive visu-
alizations have to be developed to facilitate forensics
and monitoring. Additionally, machine learning algo-
rithms have to support the user by suggesting anoma-
lous behavior with the help of visualizations. Users
can then much faster decide if the suggestion can be
confirmed or denied. Finally, we also take a look at
the target user of those applications. Most of the pro-
posed tools require strong expert knowledge to inter-
pret the visualizations and gain insights. But not all
user groups have the same expertise (see Section 3).
The goal of future applications should be to present
the information as simple as possible with the possi-
bility to dig as deep as possible for details.
The paper is structured as follows. At first, we char-
acterize the problem and explain well-known weak
spots in Section 2. Second, in Section 3, we introduce
the target user groups and highlight the significance
of user centered design for this problem. In Section
4 we analyze the data sources, which can be used to
reconstruct the routing infrastructure. After that we
summarize our study of the related work by rating the
visualization tools and techniques according to their
strengths and weaknesses. Finally, we formulate a
roadmap for this problem and conclude with upcom-
ing challenges, which have to be tackled. The main
contributions of the paper are:
1. A domain characterization for interdomain rout-
ing with a problem, user and data analysis.
2. Summary of strengths and weaknesses of state of
the art visual analysis tools for interdomain rout-
ing.
3. Definition of a roadmap for an improved visual
analysis of the global routing infrastructure.
2 PROBLEM
CHARACTERIZATION
The Internet infrastructure was not designed with se-
curity in mind, and it is alarmingly vulnerable. We
consider the security of one of the most central proto-
cols in the Internet’s infrastructure: interdomain rout-
ing i.e. routing between the administrative domains,
or ASes, that define the Internet
2.1 BGP Events
As highlighted by many high-profile configuration
errors and attacks (e.g., (BGP-Hijack, 2014)), the
Border Gateway Protocol (BGP) is insecure (Ballani
et al., 2007).
IP prefix hijacking is one of the central threats, which
allows attackers to divert traffic to traverse an incor-
rect route. This enables attacks such as monitoring
and censorship, injection of malicious software and
spying on sensitive information. One way of hijack-
ing a route is to make use of the fact that more spe-
cific prefix announcements are preferred. If for ex-
ample AS1 announces the prefix 192.128.0.0/16 and
AS2 announces 192.128.0.0/24. The /24 indicates
that more bits of the IP address are fixed, resulting in
a smaller and thus more specific range. Consequently,
all the traffic to the IP space announced by AS2 will
be routed over AS2 instead of AS1. This happened by
mistake when Telekom Pakistan hijacked Youtube in
2008 (BGP-Hijack, 2008).
Route leaks are another problem as they lead to over-
loaded ASes and, thus, to connection failures. A re-
cent event in 2015 showed how a leak by Telekom
Malaysia influences the entire Internet (BGP-Hijack,
2015). By incorrectly announcing over 150k pre-
fixes, most of the traffic around the world was routed
through a few ASes. This caused high latencies and
packet losses worldwide.
Route flappings have similar consequences, but on a
smaller scale. They occur when an AS is announcing
and withdrawing prefixes every other second, for ex-
ample when the system is rebooting because of tech-
nical issues. This causes a high computational load
IVAPP 2017 - International Conference on Information Visualization Theory and Applications
210

for the neighboring ASes, which again leads to higher
latencies and packet loss.
2.2 Security Solutions
Extensive standardization and development efforts are
invested in establishing secure interdomain routing.
However, the adoption of BGP security solutions is
difficult and proceeds slowly (Goldberg, 2014). There
are two complementary approaches to securing the in-
terdomain routing that were put forth by the IETF’s
Secure Inter-Domain Routing (SIDR) group: (1) ori-
gin authentication by deploying the Resource Public
Key Infrastructure (RPKI) (Lepinski and Kent, 2012),
followed by (2) path validation by replacing BGP
with BGPsec (Bellovin et al., 2014), a secure inter-
domain routing protocol that extends BGP. RPKI cer-
tifies records binding an IP-prefix with the number
and public key of its originating Autonomous Sys-
tem, i.e., the AS that “owns” that prefix. RPKI certifi-
cates allow BGP routers to perform origin authentica-
tion (Mohapatra et al., 2013) i.e. detect and discard
prefix hijacks These are BGP route advertisements
with an announced IP prefix where the AS is not its
legitimate owner. Prefix hijacks happen frequently
(e.g., see (BGP-Hijack, 2014; BGPMon, 2014; An-
dree Toonk, 2015)) and motivate the adoption of
RPKI, which is finally gaining traction (NIST, 2015).
Origin authentication (via RPKI) provides an impor-
tant first step towards securing interdomain routing,
yet it is insufficient to prevent path-manipulation at-
tacks. In particular, even with RPKI fully deployed,
the attacker can still perform the next-AS attack, i.e.,
announce a fake link between the attacker and the vic-
tim AS.
To address this and other path-manipulation attacks,
the IETF is standardizing BGPsec (Bellovin et al.,
2014), which uses digitally-signed BGP announce-
ments. BGPsec prevents a BGP-speaking router from
announcing a path that is not a legitimate extension of
a valid path that it received. To ensure this, BGPsec
requires each AS to sign every path advertisement that
it sends to another AS and validates all the signa-
tures of previous ASes along the path. Unlike RPKI,
integration of BGPsec necessitates changes to BGP
routers and introduces a non-trivial run-time compu-
tational overhead (Goldberg, 2014). Worse yet, recent
work on the adoption of BGP security (Lychev et al.,
2013) shows that in partial deployment, BGPsec is
expected to achieve disappointingly meager security
benefits over RPKI, while potentially even leading to
less security and other undesirable phenomena (e.g.,
routing instabilities). Another problem is erroneous
adoption of RPKI. In particular, many ROAs are in-
correct (Iamartino, 2015; Iamartino et al., 2015), de-
motivating the adoption of Route Origin Validation
(ROV). The phenomenon manifests itself even among
big and important ISPs, such as Swisscom. Further-
more, roughly 9% of ROAs can potentially disconnect
the legitimate organizations from the Internet. One
example for such bad ROAs is issuing a ROA for an
IP prefix even though some of its subprefixes belong
to other organizations that do not have ROAs. As a re-
sult, if tomorrow the entire Internet adopted BGP se-
curity with RPKI the immediate consequence would
be thousands of legitimate destination IP prefixes go-
ing offline due to misconfigurations.
2.3 Challenges
Given the problems of the BGP events and the effec-
tivity of the security solutions we develop the follow-
ing abstract challenges:
• The mentioned BGP incidents lasted about 2
hours until their cause was determined and coun-
termeasures were taken. The challenge is to re-
duce the time to detect these issues to enable faster
reactions through a combination of automated and
visual means.
• The adoption of the security features is very slow.
The challenge is to gather data for all ASes and
see, which of them have adopted the security fea-
tures correctly.
• It is not certain how effective the security features
are treating the threats. The challenge is to evalu-
ate the security features by analyzing their corre-
lation with the BGP incidents.
The above serious obstacles and pitfalls facing the
adoption of secure BGP in tandem with the multitude
of prefix hijacking attacks, show that current systems
fail to detect misconfigurations. In particular, they fail
to provide a clear and timely view of the adoption of
security mechanisms to Internet operators and system
administrators.
3 USER CHARACTERIZATION
Several user groups have to tackle the problem of
analyzing and monitoring the routing infrastructure.
User-centered design is very important for our prob-
lem as we have multiple target groups with different
goals, tasks and abilities. Details of this research field
are summarized in Endsley’s book Designing for sit-
uation awareness (Endsley, 2016). In the following,
we analyze potential user groups for the analysis of
Towards Enhancing the Visual Analysis of Interdomain Routing
211

interdomain routing. Problems with the routing in-
frastructure concern a huge part of the world popula-
tion, while only a few organizations are actively mon-
itoring the system. Therefore, we determined four
main target user groups, which have an interest in the
analysis of routing at a global scale.
1. Administrators and Security Operation Centers
(SOCs)
2. Business Analysts
3. Internet Regulators and Law Enforcement Agen-
cies (LEAs)
4. Researchers
Each of the user groups has different goals, strategies
to process information, and decisions to make.
Administrators or SOCs have to watch the system and
keep it running. They have to constantly monitor
changes in their area of responsibility and make fast
decisions. Therefore, they need assistance in handling
the huge amounts of data for a smaller part of the
infrastructure in realtime. Their expertise is strong,
which means they need an overview of the system,
but should also be able to access detailed information.
In recent years this user group has been the primary
target in visual cyber security approaches and their
specific needs were analyzed by (Fink et al., 2009).
Business analysts have to analyze the market so that
their company can make better strategic decisions.
Their business expertise is strong, but they are not
familiar with the technical aspects of routing. This
means they need an overview of the whole routing in-
frastructure to find information on how they can im-
prove the situation for their company. This includes
a focused view on their own properties in the system,
but also a view on the status of competing companies.
A detailed drill-down as for the administrators might
lead to information overload and should be avoided.
Internet regulators and LEAs have different goals, but
their way of using a routing analysis tool is similar.
They need to have an overview of the whole system
to spot irregularities, as well as being able to drill
down to detailed information. Regulators need this to
inform owners of misconfigured ASes, while LEAs
need the information to track down criminals.
Researchers are interested in the routing infrastruc-
ture for many years as many new protocols where
proposed to replace BGP. Nevertheless, none of them
succeeded because it is not possible to make all stake-
holders in the world switch simultaneously to a new
protocol. One solution is to create enhanced versions
of BGP so that single adopters gain benefits imme-
diately. For such specific improvements the current
state of the routing infrastructure has to be analyzed
thoroughly. Therefore, the researchers need a global
overview of all anomalies in routing to invent new
solutions. But also detailed information about fre-
quencies, locations and types of anomalies have to
be presented. Besides making an application usable
and useful, user experience (UX) has to be consid-
ered. A detailed overview for UX is given by Hart-
son in The UX Book (Hartson and Pyla, 2012). For
our problem case we have to attract and convince four
different user groups to use a new application. There-
fore, we need to introduce new features to the users
by preserving their mental model of the problem. As
routing is a problem of sending packets from one part
of the world to another, the user usually has a geo-
graphical map in his mind (Golledge, 1999). Using
a geographical visualization as a starting point gen-
erates a faster understanding and thus, convinces the
user to analyze deeper. However, the current work-
flow of the user has to be considered so that existing
procedures can still be followed. Finally, the eval-
uation has to be performed differently for each user
group. Administrators and SOCs are expecting a gain
in efficiency, so aspects like interaction speed and re-
sponse times have to be analyzed. The main focus is
monitoring of hijacks, route leaks and flapping. Reg-
ulators and LEAs have to detect anomalies on a global
scale. For them, monitoring and forensics have simi-
lar severity. Regulators have to detect route leaks and
flapping while LEAs need to find criminal hijackers.
Business analysts and researchers are more interested
in a higher effectivity for finding new insights from
the data. Here the main focus is forensics. Business
analysts want to analyze how different peerings in-
fluence the market. Researchers are interested in the
adoption of security features and their influence on
the stability of the infrastructure. Therefore, it has to
be proven that novel functionalities enable the user to
detect events, which previously were not visible.
4 VISUAL INTERACTIVE
ANALYSIS
In many domains data visualization has been proven
to reveal insights faster and thus accelerating the de-
cision process. However, in the field of routing anal-
ysis the integration of advanced visual analytics tech-
niques is still an open challenge. Although multiple
tools have been developed, most of them are not scal-
able to large amounts of data and do not make use
of machine learning methods. Recently, advances in
machine learning improved the automatic detection of
patterns, but these processes are still not flawless. The
human cognitive system can make better decisions
with less knowledge than a computer, but it is not
IVAPP 2017 - International Conference on Information Visualization Theory and Applications
212

Figure 2: Locations of BGP Monitoring Points: Routeviews (red), RIPE NCC (yellow).
as good in processing huge amounts of data. There-
fore, the solution of visual analytics (Keim et al.,
2010) is to combine automatic filtering and catego-
rization with manual verification through interactive
visualizations. This enables the user to monitor huge
amounts of data as well as doing forensic work on
past events.
We determined the following specific requirements
for the analysis of BGP updates based on the three
steps introduced in Section 1:
• Visualizations that are able to show the AS net-
work and BGP updates of the entire world on dif-
ferent levels of detail.
• Automatic anomaly detection in routing changes
by learning through user feedback.
• Optimized visualizations for all target user
groups.
• Support improvement in interdomain routing for
researchers and ISPs by evaluating current secu-
rity features.
4.1 Data Sources
The basis for the visual analysis are the data sources.
In the case of interdomain routing there are three dif-
ferent types of log data we can extract information
from:
1. BGP Updates
2. Routing Tables
3. Traceroutes
The first two represent the control layer. The rules
for data packet routing are stored in the tables, which
are kept up-to-date by the BGP updates. Traceroutes
are the actual routes the data packets take and thus
represent the data layer. In the past 17 years, data
collectors were placed around the world by two orga-
nizations: Routeviews (RouteViews, 2016) and RIPE
NCC (RIPE-NCC, 2016). They record propagated
BGP updates at the locations shown in Figure 2. Ad-
ditionally, Routeviews provides the full routing tables
along with the BGP updates. Routing tables are stored
in each AS and represent a fast lookup of the next AS
for a given destination IP. The data is publicly avail-
able and can be downloaded at the respective web-
sites. Because the routing tables show an aggregation
of the BGP updates, we are going to look at the up-
dates in more detail. First of all, both IPv4 and IPv6
updates are recorded and stored in the same log files.
After parsing them from the Multi-Threaded Routing
Toolkit (MRT) format to text files, a single BGP up-
date looks as shown in Figure 1. The amount of up-
dates highly depends on the position of the monitor-
ing node in the router network. If the AS has more
neighbors, more updates will come in. The average
amount of updates in a 15 minute time window are
240k with peaks at up to 7 million updates. To give a
better feeling of the vast amount of data, all updates
in June 2015 in text format amount to approx. 860
gigabytes. Although the control layer gives a good
overview of the routing, the actual path of the data
packets is determined by local preferences of the AS.
Based on the configurations and the workload of a
router, data packets can take different paths to their
destination. To see the actual path of the packets we
have to look at the data layer, particularly the tracer-
outes.
Traceroutes show the actual path a data packet takes
from a source to its destination. Due to the sheer num-
ber of IP routes, it is not feasible to check all routes
Towards Enhancing the Visual Analysis of Interdomain Routing
213

Table 1: Evaluation of current BGP Analysis tools: + Strength, - Weakness, 0 neutral, ? unknown.
Application
Acces-
sibility
Scalability
Discover
BGP
Incidents
Display
Security
Feature
Adoption
Change
Analysis
State
Compari-
son
Global
Explo-
ration
Local
Monitor-
ing
LinkRank
(Lad et al., 2004)
+ ? - - + - - 0
BGPlay
(Di Battista et al., 2005)
++ - - - + - - 0
Cyclops
(Chi et al., 2008)
++ 0 + - - - - +
BGPeep
(Shearer et al., 2008)
- ? 0 - + + - +
BGPmon / BGP Stream
(Yan et al., 2009)
+ 0 + - - - - +
VisTracer
(Fischer et al., 2012)
- ? + - ++ + + +
BGP Visibility Scanner
(Lutu et al., 2013)
- 0 - - + 0 - 0
BGPViewer
(Papadopoulos et al., 2013a)
- ? 0 - + - + 0
BGPfuse
(Papadopoulos et al., 2013b)
- ? + - + + - -
Netfork
(Di Donato et al., 2016)
- ? - - ++ - 0 -
RoutingWatch
(Ceneda et al., 2016)
- ? 0 - + + - +
ThousandEyes
(ThousandEyes, 2016)
+ 0 + - 0 - - ++
from any IP to another. A traceroute to any desti-
nation IP can only be performed from the source IP.
But there are multiple providers of online services to
trace the route from a small set of locations around
the world (e.g. Level3 LookingGlass, locaping.com).
The biggest collection of traceroutes is provided by
CAIDA (Center for Applied Internet Data Analy-
sis) (CAIDA, 2016). Within their Archipelago (Ark)
Measurement Infrastructure project they installed 160
monitoring nodes around the world. The units send
out probes to over 10 million /24 routed networks in
a period of 2-3 days, logging the route of the probe.
These results provide a rough reconstruction of the
routing infrastructure, but show the real paths the data
packets take after going through the local configura-
tion of each AS.
4.2 Visual Analysis Tools
After we performed the problem and user characteri-
zation, we analyzed multiple tools from the research
domain and also commercial applications. At first we
looked at general aspects, which are important for the
success of a routing analysis tool like accessibility and
scalability. Next we analyzed if the tools cover the
two most specific tasks of our user groups: discov-
ery of BGP incidents and a relation to the adoption of
security features. These are valuable for administra-
tors, SOCs, regulators, LEAs and researchers. After
that we assessed how well the tools cover the less spe-
cific goals like change analysis and state comparison,
which are interesting for business analysts. Finally,
we categorized the tools to see if they are more use-
ful for global exploration or local monitoring. Table 1
shows our results of the state of the art analysis with
respect to our criteria.
5 ROADMAP AND CHALLENGES
Our focus was determined by the user groups that
we defined in Section 3, and the goals they want to
achieve. We also looked at which of the common
BGP issues, explained in Section 2, can be detected
by the tools. A special remark is that none of the
applications is covering the adoption of security fea-
tures of ASes. This can give insight in how effective
the security solutions are by analyzing the correlation
of incidents and adoption. Finally, we took a detailed
look at how the different visual analysis methods
are utilized. The scalability of the applications was
difficult to assess due to the overall low accessibility.
To fill the gap in the current approaches, we see the
following challenges to advance the research in this
field considerably. Our roadmap for a new approach
specifically targets the known BGP issues, described
in Section 2, to allow an effective recognition through
visual analytics approaches. Along this line, the
following challenges have to be addressed:
IVAPP 2017 - International Conference on Information Visualization Theory and Applications
214

1. Currently, all approaches rely on the user to find
anomalies in the data. If the data is enriched by
other sources, and larger overviews are presented,
this will overwhelm the user. We need techniques,
that identify interesting events automatically, and
techniques that are able to learn ”interesting” pat-
terns based on the users feedback. Thus, ma-
chine learning algorithms and visual analytics ap-
proaches should be integrated.
2. Current approaches also show that the research fo-
cus was laid on local monitoring, while global ex-
ploration tasks where rarely considered. The pri-
mary challenge is to make the application scalable
to provide overviews of all ASes and their connec-
tions in one view.
3. The presented approaches show different tech-
niques for analysis and comparison. It is a chal-
lenge to integrate these techniques in one tool
with multiple-linked views. Animations of sin-
gle changes address the humans preattentive cog-
nition (Fisher, 2010), while static change analysis
allows to explore details, especially when com-
paring different states side by side. A combined
approach could make use of both advantages.
4. An important challenge is the treatment of the
data sources. To make the application as accurate
as possible, information from routing tables, BGP
updates, traceroutes and security features have to
be merged. This creates a difficult challenge for
storing the data and making it accessible with low
response times.
5. Accessibility is a key feature to involve new users,
usually requiring a web application that is eas-
ily accessible without having to download vast
amounts of data.
6. Beside the usability, the user experience has to
be kept in mind. The basic routing problem
can be seen as a path finding problem. Usu-
ally the human associates this with a cognitive
map (Golledge, 1999). So it is more natural to
introduce the user to a geographic representation
and transfer to a structured layout after the user
knows what to look at.
7. For user studies members of the four user groups
have to be acquired. The groups consist of ad-
ministrators, business analysts, regulators and re-
searches with the goal to improve interdomain
routing. First prototypes should be based on the
users current workflows to make the introduction
to a new tool as seamless as possible.
6 CONCLUSION
To create a roadmap towards enhancing the visual
analysis of interdomain routing, we analyzed the cur-
rent problem state and highlighted recent incidents.
We proposed new target user groups which have to be
considered in the future. We described their goals,
tasks and abilities which have to be addressed to
achieve a high acceptance rate for new applications.
After the problem and the users were defined, we
studied current visual analysis solutions for analyzing
interdomain routing. All applications have strengths
in specific tasks or techniques, but none of them is
able to address all needs of one user group, let alone
of all user groups. Our next steps will follow this
roadmap to develop a suite of visualizations that pro-
vide different views on the BGP data, targeting the
four different user groups and providing a solution to
the introduced unsolved BGP issues. This research
will be in line with current advances towards a more
secure interdomain routing infrastructure and our fu-
ture work on the visual analysis of complex networks.
ACKNOWLEDGEMENTS
This work was supported by the German Federal Min-
istry of Education and Research (BMBF) and the Hes-
sen State Ministry of Higher Education, Research and
the Arts (HMWK) within the Center for Research in
Security and Privacy (CRISP).
REFERENCES
Andree Toonk (2015). BGP Hijack Incident by Syrian
Telecommunications Establishment. BGPMon blog.
Ballani, H., Francis, P., and Zhang, X. (2007). A study of
prefix hijacking and interception in the internet. In
ACM SIGCOMM Computer Communication Review,
volume 37, pages 265–276. ACM.
Bellovin, S., Bush, R., and Ward, D. (2014). Security Re-
quirements for BGP Path Validation. RFC 7353 (In-
formational).
BGP-Hijack (2008). Renesys blog pakistan hijacks youtube
2008. http://research.dyn.com/2008/02/pakistan-
hijacks-youtube-1/.
BGP-Hijack (2014). Hijack event today by in-
dosat. http://www.bgpmon.net/hijack-event-today-by-
indosat.
BGP-Hijack (2015). Global collateral damage of tm-
net leak. http://research.dyn.com/2015/06/global-
collateral-damage-of-tmnet-leak/.
BGPMon (2014). Turkey Hijacking IP ad-
dresses for popular Global DNS providers.
Towards Enhancing the Visual Analysis of Interdomain Routing
215

http://www.bgpmon.net/turkey-hijacking-ip-
addresses-for-popular-global-dns-providers/.
CAIDA (2016). Center for applied internet data analysis.
http://www.caida.org/data.
Ceneda, D., Di Bartolomeo, M., Di Donato, V., Patrignani,
M., Pizzonia, M., and Rimondini, M. (2016). Rout-
ingwatch: Visual exploration and analysis of routing
events. In NOMS. IEEE.
Chi, Y.-J., Oliveira, R., and Zhang, L. (2008). Cyclops: the
as-level connectivity observatory. ACM SIGCOMM
Computer Communication Review, 38(5):5–16.
Di Battista, L. C. G., Mariani, F., and Pizzonia, M. P. M.
(2005). Visualizing interdomain routing with bgplay.
Di Donato, V., Patrignani, M., and Squarcella, C. (2016).
Netfork: Mapping time to space in network visual-
ization. In Proceedings of the International Working
Conference on Advanced Visual Interfaces, pages 92–
99. ACM.
Endsley, M. R. (2016). Designing for situation awareness:
An approach to user-centered design. CRC press.
Fink, G. A., North, C. L., Endert, A., and Rose, S. (2009).
Visualizing cyber security: Usable workspaces. In Vi-
sualization for Cyber Security, 2009. VizSec 2009. 6th
International Workshop on, pages 45–56. IEEE.
Fischer, F., Fuchs, J., Vervier, P.-A., Mansmann, F., and
Thonnard, O. (2012). Vistracer: a visual analytics
tool to investigate routing anomalies in traceroutes. In
Proceedings of the ninth international symposium on
visualization for cyber security, pages 80–87. ACM.
Fisher, D. (2010). Animation for visualization: opportuni-
ties and drawbacks. Ch, 19:329–352.
Ganichev, I., Dai, B., Godfrey, P., and Shenker, S.
(2010). Yamr: Yet another multipath routing protocol.
ACM SIGCOMM Computer Communication Review,
40(5):13–19.
Goldberg, S. (2014). Why is it taking so long to secure inter-
net routing? Communications of the ACM, 57(10):56–
63.
Golledge, R. G. (1999). Wayfinding behavior: Cognitive
mapping and other spatial processes. JHU press.
Hartson, R. and Pyla, P. S. (2012). The UX Book: Process
and guidelines for ensuring a quality user experience.
Elsevier.
Iamartino, D. (2015). Study and Measurements of the RPKI
Deployment.
Iamartino, D., Pelsser, C., and Bush, R. (2015). Measuring
bgp route origin registration and validation. In Inter-
national Conference on Passive and Active Network
Measurement, pages 28–40. Springer.
Keim, D. A., Kohlhammer, J., Ellis, G., and Mansmann, F.
(2010). Mastering the information age-solving prob-
lems with visual analytics. Florian Mansmann.
Kent, S., Lynn, C., and Seo, K. (2000). Secure border gate-
way protocol (s-bgp). IEEE Journal on Selected areas
in Communications, 18(4):582–592.
Lad, M., Zhang, L., and Massey, D. (2004). Link-rank: A
graphical tool for capturing bgp routing dynamics. In
NOMS, volume 1, pages 627–640. IEEE.
Lepinski, M. and Kent, S. (2012). An infrastructure to
support secure internet routing. RFC 6480 (Informa-
tional).
Lutu, A., Bagnulo, M., and Maennel, O. (2013). The
bgp visibility scanner. In Computer Communications
Workshops (INFOCOM WKSHPS), 2013 IEEE Con-
ference on, pages 115–120. IEEE.
Lychev, R., Goldberg, S., and Schapira, M. (2013). BGP
Security in Partial Deployment: Is the Juice worth the
Squeeze? In SIGCOMM, pages 171–182. ACM.
Mohapatra, P., Scudder, J., Ward, D., Bush, R., and Austein,
R. (2013). BGP Prefix Origin Validation. RFC 6811
(Proposed Standard).
NIST (2015). NIST RPKI Monitor. https://rpki-
monitor.antd.nist.gov/.
Papadopoulos, S., Moustakas, K., and Tzovaras, D.
(2013a). Bgpviewer: Using graph representations to
explore bgp routing changes. In Digital Signal Pro-
cessing (DSP), 2013 18th International Conference
on, pages 1–6. IEEE.
Papadopoulos, S., Theodoridis, G., and Tzovaras, D.
(2013b). Bgpfuse: using visual feature fusion for the
detection and attribution of bgp anomalies. In Pro-
ceedings of the Tenth Workshop on Visualization for
Cyber Security, pages 57–64. ACM.
RIPE-NCC (2016). Rseaux ip europens network coordi-
nation centre. https://www.ripe.net/analyse/internet-
measurements/routing-information-service-ris/ris-
raw-data.
RouteViews (2016). Bgp routing database.
http://www.routeviews.org/.
Shearer, J., Ma, K.-L., and Kohlenberg, T. (2008). Bgpeep:
An ip-space centered view for internet routing data.
In Visualization for Computer Security, pages 95–110.
Springer.
ThousandEyes (2016). Bgp route monitoring.
https://www.thousandeyes.com/.
Yan, H., Oliveira, R., Burnett, K., Matthews, D., Zhang, L.,
and Massey, D. (2009). Bgpmon: A real-time, scal-
able, extensible monitoring system. In CATCH’09.
Cybersecurity Applications & Technology.
IVAPP 2017 - International Conference on Information Visualization Theory and Applications
216
