
Distinguishing between MicroRNA Targets from Diverse Species
using Sequence Motifs and K-mers
Malik Yousef
1,*
, Waleed Khalifa
2
, İlhan Erkin Acar
3
and Jens Allmer
4,5,*
1
Community Information Systems, Zefat Academic College, Zefat, 13206, Israel
2
Computer Science, The College of Sakhnin, Sakhnin, 30810, Israel
3
Biotechnology, Izmir Institute of Technology, 35430 Urla, Izmir, Turkey
4
Molecular Biology and Genetics, Izmir Institute of Technology, 35430 Urla, Izmir, Turkey
5
Bionia Incorporated, IZTEKGEB A8, 35430 Urla, Izmir, Turkey
Keywords: MicroRNA, Target Prediction, Motif, Machine Learning.
Abstract: A disease phenotype is often due to dysregulation of gene expression. Post-translational regulation of protein
abundance by microRNAs (miRNAs) is, therefore, of high importance in, for example, cancer studies.
MicroRNAs provide a complementary sequence to their target messenger RNA (mRNA) as part of a complex
molecular machinery. Known miRNAs and targets are listed in miRTarBase for a variety of organisms. The
experimental detection of such pairs is convoluted and, therefore, their computational detection is desired
which is complicated by missing negative data. For machine learning, many features for parameterization of
the miRNA targets are available and k-mers and sequence motifs have previously been used. Unrelated
organisms like intracellular pathogens and their hosts may communicate via miRNAs and, therefore, we
investigated whether miRNA targets from one species can be differentiated from miRNA targets of another.
To achieve this end, we employed target information of one species as positive and the other as negative
training and testing data. Models of species with higher evolutionary distance generally achieved better results
of up to 97% average accuracy (mouse versus Caenorhabditis elegans) while more closely related species did
not lead to successful models (human versus mouse; 60%). In the future, when more targeting data becomes
available, models can be established which will be able to more precisely determine miRNA targets in host-
pathogen systems using this approach.
1 INTRODUCTION
Proteins have a large influence on the phenotype and,
therefore, their abundance can be fine-tuned on
several levels while their dysregulation may often
lead to disease. The most direct regulators of protein
abundance are microRNAs (miRNAs) which are
involved in post-transcriptional gene regulation
(Erson-Bensan, 2014). They modulate protein
abundance via interacting with messenger RNA
(mRNA) thereby fine-tuning translation rates (Saçar
and Allmer, 2013). To achieve this, a short stretch of
nucleotides (mature miRNA; ~20 nt) serves as a
recognition sequence within the RNA induced
silencing complex (RISC). Post-transcriptional
regulation via miRNAs is found in a wide range of
species ranging from viruses (Grey, 2015) to plants
(Yousef et al., 2015). Experimentally determined
mature miRNAs and pre-miRNAs (their sources) are
stored in miRBase (Griffiths-Jones, 2010) and its
release 21 contains about 28,000 mature miRNAs
(~2,600 for human), but it has been estimated that
more miRNAs may exist (Londin et al., 2015).
Unfortunately, the experimental detection of
miRNAs is difficult since they can only be analyzed
when co-expressed with their target mRNAs which is
impossible to achieve for all miRNA-mRNA pairs at
the moment (Saçar and Allmer, 2013). Therefore,
computational prediction of pre-miRNAs is
employed and most approaches are based on machine
learning using two-class classification (Allmer, 2014;
M. Saçar and Allmer, 2014). Such ab initio models
have been established for metazoan (Allmer and
Yousef, 2012) and we have shown that similar models
can be trained for plants (Yousef et al., 2015).
Machine learning for pre-miRNAs depends on
parameterization of the biological structure and many
features are available (Sacar and Allmer, 2013). We
Yousef M., Khalifa W., Acar Ä
ˇ
r. and Allmer J.
Distinguishing between MicroRNA Targets from Diverse Species using Sequence Motifs and K-mers.
DOI: 10.5220/0006137901330139
In Proceedings of the 10th International Joint Conference on Biomedical Engineering Systems and Technologies (BIOSTEC 2017), pages 133-139
ISBN: 978-989-758-214-1
Copyright
c
2017 by SCITEPRESS – Science and Technology Publications, Lda. All rights reserved
133

have recently also added sequence motifs as
additional features for describing pre-miRNAs
(Yousef et al., 2016a). Parameterization is important
to train classifiers which, based on a feature-value set,
can learn to differentiate between the positive
(miRNA) and the negative class. Many machine
learning approaches like support vector machines
(Ding, Zhou, & Guan, 2010) and random forest (Jiang
et al., 2007) have been used but in general two-class
classifications suffers from the lack of bona fide
negative pre-miRNA examples (Khalifa et al., 2016).
The same is true, if not worse, for negative examples
of the targets of miRNAs. Such targets are short
stretches of nucleotides complementary to the mature
sequences incorporated into RISC. Experimentally
supported, so called miRNA-mRNA duplexes, are
available in miRTarBase (Hsu et al., 2011) and
TarBase (Sethupathy et al., 2006), but there is no
dataset for which it is clear that it does not contain
target sites for even selected miRNAs. This is
especially complicating the computational prediction
of miRNA targets (Hamzeiy et al., 2014). Therefore,
one-class classification has been used for miRNA
target prediction (Yousef et al., 2016b).
Here we employ two class classification, but
avoid the problem of missing negative data since
instead of trying to determine miRNA targets we
investigate the difference among miRNA targets
among species. Thus, it is our aim to differentiate
between miRNA targets of one species by using
another species as negative training data employing
only sequence-based features, which means that
positive and negative classes derived from known
miRNA targets. Our approach is further supported by
the finding that miRNA targets are not highly
conserved within vertebrate, fly, and nematode
3’UTRs (Chen and Rajewsky, 2006). For family
classification of pre-miRNAs Ding et al. used n-
grams (Ding et al., 2011) which is somewhat related
to the problem investigated here. Ding et al. aimed to
assign a miRNA to a family of miRNAs while we are
determining to which species a miRNA target
belongs. We further aimed to establish the
evolutionary distance which allows differentiation
between targets of different species. We observed a
slight trend to better differentiation for species that
are further apart evolutionarily, but especially mouse
and rat examples present unexpected outliers which
may be due to low quality data and low relative
amount of data available for rat. Facilitating the
differentiation of miRNA targets among species may
in the future allow the investigation of
communication between host and parasite (Saçar et
al., 2014; Saçar Demirci et al., 2016).
2 MATERIALS & METHODS
2.1 Datasets
We downloaded all microRNAs’ targets for all
species available on miRTarbase with about 500
targets or more. Data for Homo sapiens (has),
Caenorhabditis elegans (Cel), Mus musculus (Mmu),
Rattus norvegicus (Rno), and Bos taurus (Bta) were
downloaded from miRTarBase (Release 6.0: Sept. 15,
2015); for details see Table 1.
The miRNA-mRNA duplexes, representing
miRNA targets were filtered according to sequence
similarity using USEARCH (Edgar, 2010) on the
sequences of each species and also on a per species
basis to ensure that there is no bias due to multiple
identical target sequences. We only found 74 similar
sequences between Hsa and Mmu, which were
removed.
Table 1: List of the species whose known miRNA mRNA
duplexes were used in this study and their amounts
available on miRTarBase.
Species
Number of
target sites
After
Cleaning
Average
Duplex
Length
Cel 4,029 2,233 23.2
Mmu 54,951 9,278 29.0
Hsa 317,542 89,752 25.2
Rno 658 532 22.5
Bta 489 393 24.1
2.2 Parameterization of MicroRNA
Targets
2.2.1 K-mers
These are short stretches of nucleotides of length k
which are also termed n-grams or words. Such
sequence-based features were used for ab initio pre-
miRNA detection, and may also be useful for target
prediction (Yousef et al., 2016b). Formally, a k-mer
is one element of the relevant alphabet, here {A, U,
C, G}. A 2-mer can generate 16 different elements:
AA, AC, …, UU. Higher k have also been used (Çakır
and Allmer, 2010), but here we limited k to 1 ≤ k ≤ 3
leading to 84 features. As features k-mer frequencies
were calculated from the target sequences divided by
the k-mers in the sequence given by len(sequence) - k
+ 1.
2.2.2 Motif Features Describing MicroRNA
Targets
Instead of describing exact sub sequences, motifs
BIOINFORMATICS 2017 - 8th International Conference on Bioinformatics Models, Methods and Algorithms
134
allow for approximate matches including some
degree of error tolerance. The MEME (Multiple
Expectation Maximization for Motif Elicitation)
Suite (Bailey, T. L. et al., 2009) was used to establish
motifs which are short stretches of nucleotides that
occur more frequently than expected by chance
within the given set of sequences. MEME is based on
(Bailey and Elkan, 1994) which repeatedly searches
for ungapped sequence motifs within the input
sequences which explains its long runtime. MEME
provides regular expressions and sequence profiles to
represent the motifs. Profiles are more informative
than regular expressions, which is why, different from
our previous works (Yousef et al., 2016a, 2015), we
decided to use profiles for feature creation. For each
species we discovered 100 motifs serving either as
positive or negative data thus 200 motifs were
available for each experiment in addition to 84 k-
mers. To calculate feature scores, profiles were
aligned with the target sequence and shifted along
until the end of the profile reached the end of the
sequence or vice versa in case the profile was longer
than the sequence. At each position, a score was
calculated by adding up the frequencies in the profile
for matching nucleotides at their respective positions.
The motif position leading to the highest score is
reported as the final score for that input sequence.
2.2.3 Feature Vector and Feature Selection
For each experiment 284 features were available, but,
not all features are equally effective to train a machine
learning classifier and therefore, we used KNIME
(Berthold et al., 2008) to calculate information gain
(Yang and Pedersen, 1997) on a per experiment basis
and accepted the 100 features with highest
information gain. This feature set was used during
model establishment to select from the possible
features in this study: A … U (k=1), AA … UU (k=2),
AAA … UUU (k=3), Motif
1
, Motif
2
, Motif
3
, …,
Motif
n
; where n=200.
2.3 Classification Approach
Random Forest (RF) was used for classification in
this study since it outperformed support vector
machines (Vapnik, 1995), decision trees (DT), and
Naive Bayes (NB) in tests preceding the study. The
classification approach was setup using the data
analytics platform KNIME (Berthold et al., 2008).
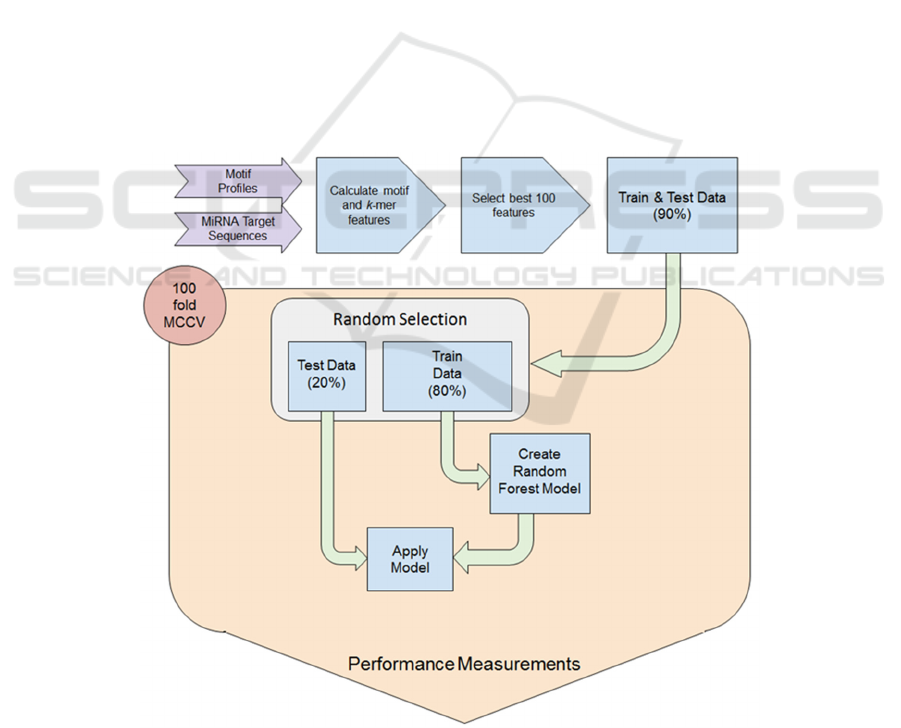
Figure 1: Workflow for model establishment. Data was transformed into a feature vector and the best 100 were selected.
During the 100-fold MCCV training and testing scheme 80% randomly selected examples were used to train the classifier
and 20% were used for testing. All performance measures for testing and holdout data were collected during CV and reported
at the end of the workflow.
Distinguishing between MicroRNA Targets from Diverse Species using Sequence Motifs and K-mers
135

Models were trained and tested using 100 fold Monte
Carlo Cross Validation (Xu and Liang, 2001) and in
each fold of the cross validation (CV) the data were
split into 80% training and 20% testing. During
random selection, negative and positive examples
were sampled in equal amounts since we showed that
this approach is beneficial for model establishment in
pre-miRNA detection (Sacar and Allmer, 2013). For
each of the 100-fold Monte Carlo cross validation
(MCCV) the performance was recorded (Figure 1).
Table 2: Number of motifs and k-mers among the top 100
features during training and testing according to the training
scheme in Figure 1.
# of motifs # of
k
-mers
Mmu vs Cel 23 77
Rno vs 24 76
Hsa vs Cel 22 78
Rno vs Hsa 24 76
Bta vs mmu 26 74
Bta vs Hsa 26 74
Bta vs Cel 71 29
Rno vs Cel 65 35
Rno vs Bta 33 67
Hsa vs Mmu 63 37
2.3.1 Model Performance Evaluation
For each established model we calculated a number
of performance measures for the evaluation of the
classifier such as sensitivity, specificity and accuracy
according to the following formulations (with TP:
true positive, FP: false positive, TN: true negative,
and FN referring to false negative classifications):
Sensitivity = TP / (TP + FN); (SE, Recall)
Specificity = TN / (TN + FP); (SP)
Precision = TP / (TP + FP)
F-Measure = 2 (precision * recall) / (precision +
recall)
Accuracy = (TP + TN) / (TP + TN + FP + FN);
(ACC)
MCC =
TP TNFP FN
TPFP
TPFN
TNFN
TNFP
; Matthews
Correlation Coefficient (Matthews, 1975).
All reported performance measures refer to the
average of 100-fold Monte Carlo Cross Validation
(MCCV).
3 RESULTS AND DISCUSSION
The random forest classifier was used to establish
machine learned models using an 80/20 split from
random sampled and stratified training and testing
data during 100-fold MCCV (Figure 1). During
feature selection generally few motifs (22-33%) were
selected, but for Bta vs Cel, Rno vs Cel, and Has vs
Mmu 63-71% were selected (Table 2).
In general, about 25% of the informative features
were motifs which, given the low amount of examples
available for some species (Table 2), was to be
expected. The number of features that should
optimally be used for classification was tested (Figure
2). For many tests even low number of features lead
to relatively good results. To select the most suitable
number of features we used species combinations
which lead to slightly above 70% average accuracy
since lower and higher accuracies may be biased.
Therefore, we selected 100 features since for Bta vs
Cel and for Rno vs Cel this number of features led to
the best average accuracy (Figure 2).
The feature sets consisting of 100 parameters
were then used to establish models to differentiate
between miRNA targets from one versus the other
species (Table 3).
Table 3 indicates that distantly related species
(Figure 3) are easier to differentiate using the trained
models. Examples are Mmu vs Cel, Hsa vs Cel, Bta
vs Cel, and Rno vs Cel. However, Rno vs Mmu which
are the perhaps most closely related species (Figure
3) in this study achieved an unexpectedly high
accuracy whereas Hsa vs Mmu and Rno vs Bta were
according to expectations. Table 3 provides the
average accuracy and other model performance
measures. To confirm that the 100 fold model training
and testing is of low variance, accuracy was recorded
at each step (Figure 4). The distribution was best for
Mmu vs. Cel and worst for Rno vs. Bta judged by the
interquartile distance. Interestingly, all tests
involving Bta contain large interquartile ranges.
According to the results in Table 3 both Rno and
Mmu may contain foreign examples in their datasets
such that they 1) become different from each other
and 2) do not fit to the general expectation. For Mmu
we previously discovered that filtering their pre-
miRNAs by a very simple measure (RPM > 100)
leads to a 10% increase in average model accuracy for
pre-miRNA detection (Saçar Demirci and Allmer,
manuscript in preparation). It seems likely, that the
effect of this may be even more pronounced in
dependent datasets like miRNA targets since pre-
miRNAs that are unlikely true lead to targets which
are impossibly true. This seems to strongly affect
classification accuracy in this case.
BIOINFORMATICS 2017 - 8th International Conference on Bioinformatics Models, Methods and Algorithms
136
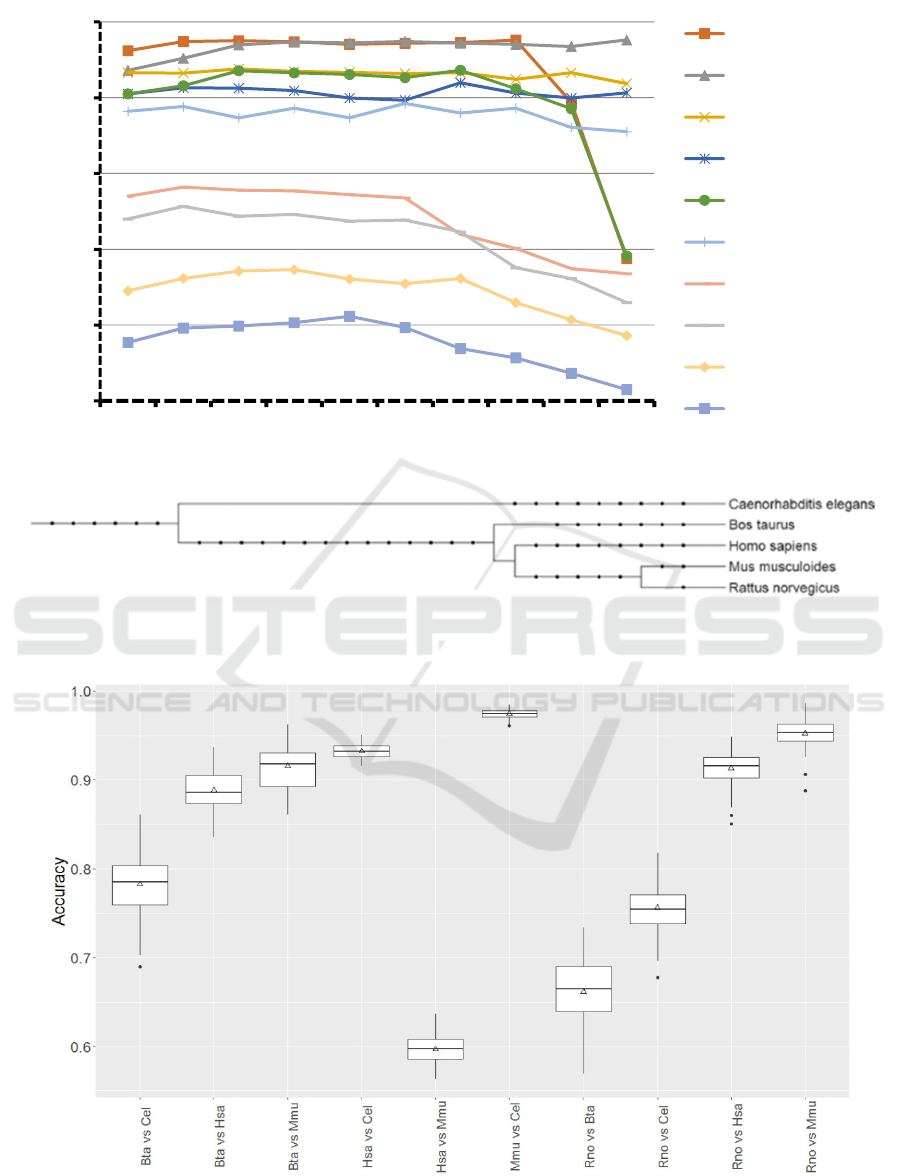
Figure 2: Average accuracy in respect to number of selected features.
Figure 3: Phylogenetic relationship among organisms and groups used in this study was established using phyloT
(http://phylot.biobyte.de). Itol (http://itol2.embl.de/) was used to create this graph (Letunic & Bork, 2011).
Figure 4: Accuracy distribution over 100 fold MCCV for models establishment to differentiate miRNA targets between
selected species.
0,50
0,60
0,70
0,80
0,90
1,00
284 100 50 40 30 20 10 5 2 1
Mmu vs Cel
Rno vs Mmu
Hsa vs Cel
Rno vs Hsa
Bta vs Mmu
Bta vs Hsa
Bta vs Cel
Rno vs Cel
Rno vs Bta
Hsa vs Mmu
Distinguishing between MicroRNA Targets from Diverse Species using Sequence Motifs and K-mers
137

4 CONCLUSIONS
Machine learning has become an important tool for
miRNA and miRNA target detection; however,
missing negative data poses an obstacle (Allmer and
Yousef, 2012). The general aim for miRNA target
prediction is to determine the targets in the 3’UTRs
of known genes. In this work we intended to study
whether it is possible to establish machine models
that can differentiate between miRNA targets from
different species. A somewhat related approach
previously categorized miRNAs into families,
thereby, showing that miRNAs can be related (Ding
et al., 2011). Contradicting this approach is that
miRNAs can evolve rapidly (Liang and Li, 2009).
Our aim is further supported by the finding that
3’UTRs (the most abundant targets for miRNAs) are
not highly conserved (Chen and Rajewsky, 2006).
Machine learning was performed using an 80/20 100-
fold MCCV approach and it was shown that 100
selected features and among them generally about
30% motifs was a successful mixture for model
establishment. While in general the results reflected
our expectations and we can conclude that given
proper examples miRNA targets can be differentiated
if the phylogenetic distance is high and that it is not
possible to distinguish between miRNA targets of
closely related species. Additionally, we were able to
show that it seems likely that among rat and mouse
examples in miRTarBase there seem to be many
incorrect target assignments. Nonetheless, it is our
contention that miRNA targets can be distinguished
between unrelated species which will be especially
useful for the detection of targets in host-pathogen
systems (Saçar et al., 2014; Saçar Demirci et al.,
2016).
ACKNOWLEDGEMENTS
The work was supported by the Scientific and
Technological Research Council of Turkey [grant
number 113E326] to JA. The work was supported by
the Zefat academic college for MY. MY
acknowledges Anas Yousef’s help in this research.
REFERENCES
Allmer, J. (2014). Computational and bioinformatics
methods for microRNA gene prediction. Methods in
Molecular Biology (Clifton, N.J.), 1107, 157–75.
http://doi.org/10.1007/978-1-62703-748-8_9.
Allmer, J., & Yousef, M. (2012). Computational methods
for ab initio detection of microRNAs. Frontiers in
Genetics, 3, 209. http://doi.org/10.3389/
fgene.2012.00209.
Bailey, T. L., Boden, M., Buske, F. A., Frith, M., Grant, C.
E., Clementi, L., Noble, W. S. (2009). MEME SUITE:
tools for motif discovery and searching. Nucleic Acids
Research, 37(Web Server issue), W202-8.
http://doi.org/10.1093/nar/gkp335.
Bailey, T. L., & Elkan, C. (1994). Fitting a mixture model
by expectation maximization to discover motifs in
biopolymers. Proceedings / ... International Conference
on Intelligent Systems for Molecular Biology; ISMB.
International Conference on Intelligent Systems for
Molecular Biology, 2, 28–36. Retrieved from
http://www.ncbi.nlm.nih.gov/pubmed/7584402.
Berthold, M. R., Cebron, N., Dill, F., Gabriel, T. R., Kötter,
T., Meinl, T., Wiswedel, B. (2008). KNIME: The
Konstanz Information Miner. In SIGKDD Explorations
(Vol. 11, pp. 319–326). http://doi.org/10.1007/978-3-
540-78246-9_38.
Çakır, M. V., & Allmer, J. (2010). Systematic
computational analysis of potential RNAi regulation in
Toxoplasma gondii. In 2010 5th International
Symposium on Health Informatics and Bioinformatics
(pp. 31–38). Ankara, Turkey: IEEE. http://doi.org/
10.1109/HIBIT.2010.5478909.
Chen, K., & Rajewsky, N. (2006). Deep conservation of
microRNA-target relationships and 3’UTR motifs in
vertebrates, flies, and nematodes. Cold Spring Harbor
Symposia on Quantitative Biology, 71, 149–56.
http://doi.org/10.1101/sqb.2006.71.039.
Ding, J., Zhou, S., & Guan, J. (2010). MiRenSVM: towards
better prediction of microRNA precursors using an
ensemble SVM classifier with multi-loop features.
BMC Bioinformatics, 11 Suppl 1(Suppl 11), S11.
http://doi.org/10.1186/1471-2105-11-S11-S11.
Ding, J., Zhou, S., & Guan, J. (2011). miRFam: an effective
automatic miRNA classification method based on n-
grams and a multiclass SVM. BMC Bioinformatics,
12(1), 216. http://doi.org/10.1186/1471-2105-12-216.
Edgar, R. C. (2010). Search and clustering orders of
magnitude faster than BLAST. Bioinformatics, 26(19),
2460–2461.
http://doi.org/10.1093/bioinformatics/btq461.
Erson-Bensan, A. E. (2014). Introduction to microRNAs in
biological systems. Methods in Molecular Biology
(Clifton, N.J.), 1107, 1–14. http://doi.org/10.1007/978-
1-62703-748-8_1.
Grey, F. (2015). Role of microRNAs in herpesvirus latency
and persistence. The Journal of General Virology, 96(Pt
4), 739–51. http://doi.org/10.1099/vir.0.070862-0.
Griffiths-Jones, S. (2010). miRBase: microRNA sequences
and annotation. Current Protocols in Bioinformatics /
Editoral Board, Andreas D. Baxevanis ... [et Al.],
Chapter 12, Unit 12.9.1-10. http://doi.org/
10.1002/0471250953.bi1209s29.
Hamzeiy, H., Allmer, J., & Yousef, M. (2014).
Computational methods for microRNA target
prediction. Methods in Molecular Biology (Clifton,
BIOINFORMATICS 2017 - 8th International Conference on Bioinformatics Models, Methods and Algorithms
138

N.J.), 1107, 207–21. http://doi.org/10.1007/978-1-
62703-748-8_12.
Hsu, S.-D., Lin, F.-M., Wu, W.-Y., Liang, C., Huang, W.-
C., Chan, W.-L., Huang, H.-D. (2011). miRTarBase: a
database curates experimentally validated microRNA-
target interactions. Nucleic Acids Research,
39(Database issue), D163-9. http://doi.org/10.1093/
nar/gkq1107.
Jiang, P., Wu, H., Wang, W., Ma, W., Sun, X., & Lu, Z.
(2007). MiPred: classification of real and pseudo
microRNA precursors using random forest prediction
model with combined features. Nucleic Acids
Research, 35(Web Server issue), W339-344.
http://doi.org/10.1093/nar/gkm368.
Khalifa, W., Yousef, M., Saçar Demirci, M. D., & Allmer,
J. (2016). The impact of feature selection on one and
two-class classification performance for plant
microRNAs. PeerJ, 4, e2135. http://doi.org/
10.7717/peerj.2135.
Letunic, I., & Bork, P. (2011). Interactive Tree Of Life v2:
online annotation and display of phylogenetic trees
made easy. Nucleic Acids Research, 39(suppl), W475–
W478. http://doi.org/10.1093/nar/gkr201.
Liang, H., & Li, W.-H. (2009). Lowly expressed human
microRNA genes evolve rapidly. Molecular Biology
and Evolution, 26(6), 1195–8. http://doi.org/10.1093/
molbev/msp053.
Londin, E., Loher, P., Telonis, A. G., Quann, K., Clark, P.,
Jing, Y., Rigoutsos, I. (2015). Analysis of 13 cell types
reveals evidence for the expression of numerous novel
primate- and tissue-specific microRNAs. Proceedings
of the National Academy of Sciences, 112(10), E1106–
E1115. http://doi.org/10.1073/pnas.1420955112.
Matthews, B. W. (1975). Comparison of the predicted and
observed secondary structure of T4 phage lysozyme.
BBA - Protein Structure, 405(2), 442–451.
http://doi.org/10.1016/0005-2795(75)90109-9.
Saçar, M., & Allmer, J. (2014). Machine Learning Methods
for MicroRNA Gene Prediction. In M. Yousef & J.
Allmer (Eds.), miRNomics: MicroRNA Biology and
Computational Analysis SE - 10 (Vol. 1107, pp. 177–
187). Humana Press. http://doi.org/10.1007/978-1-
62703-748-8_10.
Sacar, M. D., & Allmer, J. (2013). Data mining for microrna
gene prediction: On the impact of class imbalance and
feature number for microrna gene prediction. In 2013
8th International Symposium on Health Informatics and
Bioinformatics (pp. 1–6). IEEE.
http://doi.org/10.1109/HIBIT.2013.6661685.
Saçar, M. D., & Allmer, J. (2013). Current Limitations for
Computational Analysis of miRNAs in Cancer.
Pakistan Journal of Clinical and Biomedical Research,
1(2), 3–5. Retrieved from https://www.researchgate.
net/publication/260487667_Current_Limitations_for_
Computational_Analysis_of_miRNAs_in_Cancer.
Saçar, M. D., Bağcı, C., & Allmer, J. (2014).
Computational Prediction of MicroRNAs from
Toxoplasma gondii Potentially Regulating the Hosts’
Gene Expression. Genomics, Proteomics &
Bioinformatics, 12(5), 228–238. http://doi.org/
10.1016/j.gpb.2014.09.002.
Saçar Demirci, M. D., Bağcı, C., & Allmer, J. (2016).
Differential Expression of T. gondii MicroRNAs in
Murine and Human Hosts. In Non-coding RNAs and
inter-kingdom communication. Springer.
Sethupathy, P., Corda, B., & Hatzigeorgiou, A. G. (2006).
TarBase: A comprehensive database of experimentally
supported animal microRNA targets. RNA, 12(2), 192–
7. http://doi.org/10.1261/rna.2239606.
Vapnik, V. N. (1995). The nature of statistical learning
theory. New York, New York, USA: Springer-Verlag.
Retrieved from
http://dl.acm.org/citation.cfm?id=211359.
Xu, Q.-S., & Liang, Y.-Z. (2001). Monte Carlo cross
validation. Chemometrics and Intelligent Laboratory
Systems, 56(1), 1–11. http://doi.org/10.1016/S0169-
7439(00)00122-2.
Yang, Y., & Pedersen, J. O. (1997). A Comparative Study
on Feature Selection in Text Categorization.
Proceedings of the Fourteenth International Conference
on Machine Learning (ICML’97), 412–420. http://
doi.org/10.1093/bioinformatics/bth267.
Yousef, M., Allmer, J., & Khalifa, W. (2016a). Accurate
Plant MicroRNA Prediction Can Be Achieved Using
Sequence Motif Features. Journal of Intelligent
Learning Systems and Applications, 8(1), 9–22.
http://doi.org/10.4236/jilsa.2016.81002.
Yousef, M., Allmer, J., & Khalifa, W. (2016b). Feature
Selection for MicroRNA Target Prediction -
Comparison of One-Class Feature Selection
Methodologies. In Proceedings of the 9th International
Joint Conference on Biomedical Engineering Systems
and Technologies (pp. 216–225). Rome: SCITEPRESS
- Science and and Technology Publications.
http://doi.org/10.5220/0005701602160225.
Yousef, M., Allmer, J., & Khalifaa, W. (2015). Plant
MicroRNA Prediction employing Sequence Motifs
Achieves High Accuracy.
Distinguishing between MicroRNA Targets from Diverse Species using Sequence Motifs and K-mers
139
