
Automated Segmentation of Upper Airways from MRI
Vocal Tract Geometry Extraction
Antti Ojalammi and Jarmo Malinen
Department of Mathematics and Systems Analysis, Aalto University, Otakaari 1, Espoo, Finland
Keywords:
MRI, 3D Image Processing, Automatic Surface Extraction, Vocal Tract.
Abstract:
An algorithm for automatically extracting a triangulated surface mesh of the human vocal tract from 3D MRI
data is proposed. The algorithm is based on a combination of anatomic landmarking, seeded region growing,
and smoothing. Using these methods, a mask is automatically created for removing unwanted details not
associated with the vocal tract from the MRI voxel data. The mask is then applied to the original MRI data,
after which marching cubes algorithm is used for extracting a triangulated surface. The proposed method can
be used for processing large datasets, e.g., for validation of numerical methods in speech sciences as well as
for anatomical studies.
1 INTRODUCTION
We propose an algorithm for extracting vocal tract
(VT) geometries from greyscale voxel images, produ-
ced by static 3D Magnetic Resonance Imaging (MRI).
The motivation for such an algorithm, requiring at
most minimal user intervention, lies in the need to
process large MRI datasets of the upper airways and
mouth area. As such, the voxel data produced by an
MRI scanner is suitable for patient examinations by
specialists such as radiologists, using the software and
the user interface provided by the scanner manufactu-
rer. Applications for the extracted surface models for
the VT include (i) producing anatomic models by ra-
pid prototyping for patient examinations, planning of
treatment, etc., by medical professionals, and (ii) ge-
nerating computational meshes for numerical simula-
tions of a wide range of biophysical phenomena rela-
ted to speech production, breathing, and swallowing
function.
MRI examinations are useful for improving the
current understanding of the relation between ana-
tomy, phonation, and articulation. Depending on the
particular purpose, MRI data is required both from he-
althy test subjects as well as from patients requiring,
e.g., surgical treatment or rehabilitation. Because of
the lack of ionising radiation, the MRI examinations
are an attractive alternative to X-ray Computed Tomo-
graphy that would, however, produce a better spatial
and temporal resolution. This aspect is particularly
important when imaging healthy test subjects without
an underlying medical condition that would warrant
the use of radiation.
A lot of earlier work has been done in segmen-
tation as well as image processing, both overall and
in general medical context; see, e.g., (Gonzalez and
Woods, 2001; Sharma et al., 2010). The main issues
in segmenting the MRI data of the VT are caused by
the quality of raw voxel data and the characteristics
of the MRI technology: (i) the inability of MRI to
isolate osseous structures from the air volume due to
the common low hydrogen content of both of these
media, and (ii) motion artefacts due to the scanning
time that may exceed 10 seconds for a single statio-
nary 3D image in high resolution. As such, both of
these problems can be alleviated (however, at a de-
finite cost) by choices in MRI sequences, their para-
meterisation, and even by using a scanner with field
strength at 3 T or even higher. Further challenges are
associated to non-typical or even pathological anato-
mies in test subjects: in some VT configurations, the
air passage may be so narrow that a naively processed,
low-resolution MRI might lack any opening at all.
The proposed algorithm is able to extract a VT
surface taking into consideration each of these chal-
lenges. The proposed algorithm is completely au-
tomatic, and it derives its parameters from the MR
image data to be processed. The algorithm aims to be
as robust as possible, with the goal to extract a rea-
sonable candidate surface even from data having he-
avy motion artefacts or postural abnormalities. This
is preferred due to the large amount of image data,
Ojalammi A. and Malinen J.
Automated Segmentation of Upper Airways from MRI - Vocal Tract Geometry Extraction.
DOI: 10.5220/0006138300770084
In Proceedings of the 10th International Joint Conference on Biomedical Engineering Systems and Technologies (BIOSTEC 2017), pages 77-84
ISBN: 978-989-758-215-8
Copyright
c
2017 by SCITEPRESS – Science and Technology Publications, Lda. All rights reserved
77

Figure 1: An extracted isosurface from raw MRI without
any preliminary modifications. Observe that the osseous tis-
sue is merged with the air volume.
which then allows for the application of statistical
analysis on numerical results.
The robustness of VT surface extraction has been
validated by applying the algorithm to a dataset of 3D
MRI from one male and one female test subject ut-
tering vowels, comprising of 109 images.
1
This da-
taset is used as the reference of the characteristics of
the MRI data in this article. We show two examples
of challenging VT geometries for the extraction. In
Figure 8, the resolution of the MRI data is insuffi-
cient for resolving the piriform sinuses. In Figure 7
(which is not part of the validation data set), the ear-
lier version of the extraction algorithm (Aalto et al.,
2013) was unable to resolve the vicinity of the uvula
whereas the proposed algorithm is able reproduce the
opening as required.
Measurements are performed on a Siemens Mag-
netom Avanto 1.5T scanner using 3D VIBE MRI se-
quence (Rofsky et al., 1999). Further details about
the acquisition of the MRI data have been explained
in (Aalto et al., 2014, Section 3).
2 BACKGROUND
Vocal tract segmentation from MRI is a long-standing
technical challenge in speech research. Semi-
automated algorithms have been developed since the
MRI resolution and the scanning time first became
practicable for capturing articulation (Niikawa et al.,
1996; Baer et al., 1987; Baer et al., 1991; Engwall and
1
The original dataset of the two test subjects contained
114 MR images, of which five were deemed as failed scans,
and hence, excluded from the validation set of this article.
Badin, 1999; Story et al., 1996; Story et al., 1998; Ta-
kemoto et al., 2004; Aalto et al., 2014; Aalto et al.,
2011). When using 3D MRI, experiments involving
prolonged vowel utterances have been most common.
There exist more generic softwares that can be
used for extracting VT geometries, but the particu-
lar challenges related to the head and neck area ana-
tomy require a highly tailored approach. For exam-
ple, the segmentation software Vascular Modelling
Toolkit (Vascular Modeling Toolkit, 2016) for medi-
cal data on blood vessels can be used due to the tubu-
lar shape of the VT. However, generic software – or
software mainly intended for other purposes – require
user input to define initial configurations, etc., as well
as various parameters. These parameter values can-
not always be directly inferred from the data, and the
user must usually proceed based on trial and error to
produce high quality segmented data. Moreover, the
sensitivity with respect to parameter values is an is-
sue, and different parts of the anatomy may benefit
from different parameterisations. All this adds to the
amount of manual work which easily becomes prohi-
bitively high for large scale studies or in commercial
applications.
Segmentation approaches based on an estimated
VT centreline have been proposed (Poznyakovskiy
et al., 2015). This approach reduces the 3D segmenta-
tion task into two dimensions where, e.g., active con-
tour methods (i.e., snakes) can be used. With such
methods, a multitude of parameters is needed. More-
over, special care must be taken when generating the
VT centreline (lacking a unique definition due to the
complicated geometry) which is a non-trivial task in
itself. It should be pointed out that VT centrelines and
intersection surface areas are also required in some of
the speech acoustic models. It is, however, a different
matter to derive such centrelines from a triangulated
VT surface model, compared to deriving them from
raw voxel data. In two-dimensional sections, some
parts of the VT (such as piriform sinuses and the val-
leculae) may appear not connected even though they
are connected in three dimensions. This adds to the
complications when using an active contour method.
An almost automatic segmentation technique was
presented in (Aalto et al., 2013), and the current work
is based on the lessons learned since then. The earlier
approach requires artefact model geometries for the
maxilla and mandible that have to be created for each
test subject separately. The artefact models are then
automatically aligned with the surface extracted from
the target data in three dimensions in order to mask
away the osseous structures that would interfere with
the air volume in the VT as shown in Fig. 1. Both the
surface models had to be represented as point clouds
BIOIMAGING 2017 - 4th International Conference on Bioimaging
78

since the alignment process is based on point cloud
registration (Rusu and Cousins, 2011). Detecting and
correcting misalignments proved to be labourious.
3 OVERVIEW OF THE
ALGORITHM
The extraction of the air/tissue interface from MRI
data requires four major steps as follows:
1. Preprocessing: Firstly, the original voxel number
is increased 8-fold to accommodate a more pre-
cise estimate of air/tissue interface making opti-
mal use of the information contained in the grey
values of the MR image. The edge definition and
the contrast of the MR image is improved by using
standard image processing algorithms. An ini-
tial threshold for the grey value due to air volume
(showing as low intensity in MRI) is defined for
Step 3.
2. Landmarking: Anatomic features near the mouth
and the oropharynx are detected as required in
Step 3.
3. Mask creation: A binary mask containing only the
exterior and the VT air column volume is genera-
ted by an iterative intensity based region growing
algorithm and smoothing. With the aid of anato-
mic landmarks, the mask excludes osseous struc-
tures that are not discernible from air in MRI data.
The threshold value from Step 1 is increased du-
ring the iteration, leading to a larger volume inter-
preted as air by the region growing algorithm.
4. Surface extraction: A triangulated surface mesh is
extracted from the original MRI data using a do-
wnsampled version of the mask created in Step 3.
The surface mesh produced by the marching cu-
bes algorithm is consistent with a level set of grey
values, with the aid of an empirically obtained
threshold value. Volume preserving smoothing is
applied to finalise the extracted mesh.
After further processing, the resulting triangulated
surface mesh can be used in numerical simulations,
for extraction of VT centrelines and cross-section
areas, and rapid prototyping of physical models.
4 PREPROCESSING
In order to improve contrast and enhance edges, MR
images must be preprocessed. The initial resolution
of the MR image data is quite low: 1.8 mm for the
female and 1.9 mm for the male test subject.
2
As a
first step, we increase the number of voxels 8-fold
by linear interpolation in order to halve the distance
between adjacent slices. This gives us more room
for play when it comes to narrow parts of the vo-
cal tract, such as at the glottis or near the uvula.
Secondly, we run the symmetric nearest neighbour
(SNN) filter adapted from (Hong et al., 2004) with
full 3-dimensional connectivity in order to enhance
edge definition. Thirdly, the way how the MRI scan-
ner reconstructs the image may lead to wrap-around
where the back of the skull appears in front of the pa-
tient’s face. These imaging artefacts are removed by
discarding all but the largest connected component of
imaged tissue that is in contact with the air space in
front of the mouth.
After the aforementioned preliminary steps, an
initial threshold value is evaluated corresponding to
the grey level of air deduced from the histogram of
the MRI data. The initial threshold value is used for
separating the air and tissue components in the image
data as explained in Section 6.1. Histogram norma-
lisation is applied to voxels with grey values higher
than the threshold in order to distribute the tissue in-
tensities more evenly. This makes the gradient of the
grey values less steep near the air/tissue interface, al-
lowing more control and precision in mask creation
(Step 3 in Section 3) as a function of the improved,
higher threshold value.
Carrying out the steps described in Section 5, po-
sition information is obtained near the mouth and the
oropharynx. With the aid of it, the grey values at the
throat area are increased in order to remove low inten-
sity spots near the mandible due to motion artefacts.
An example of mid-sagittal head and neck MRI
slice before and after pre-processing is shown in Fi-
gure 2. It is worth noting that narrow passages around
the glottal area are not always detected as air volume
at this stage. This is acceptable since the algorithm
will later block out unwanted regions in order to be
able to iteratively raise the air/tissue threshold value
in Step 3.
5 ANATOMIC LANDMARKS
The extraction algorithm requires estimates for the lo-
cation of features near the mouth and the oropharynx.
We obtain these by using a facial profile constructed
from the preprocessed image data.
2
The number of voxels is the same in all MR images of
the validation set. The voxels are isotropic, but the voxel
size varies depending the size of the test subject.
Automated Segmentation of Upper Airways from MRI - Vocal Tract Geometry Extraction
79
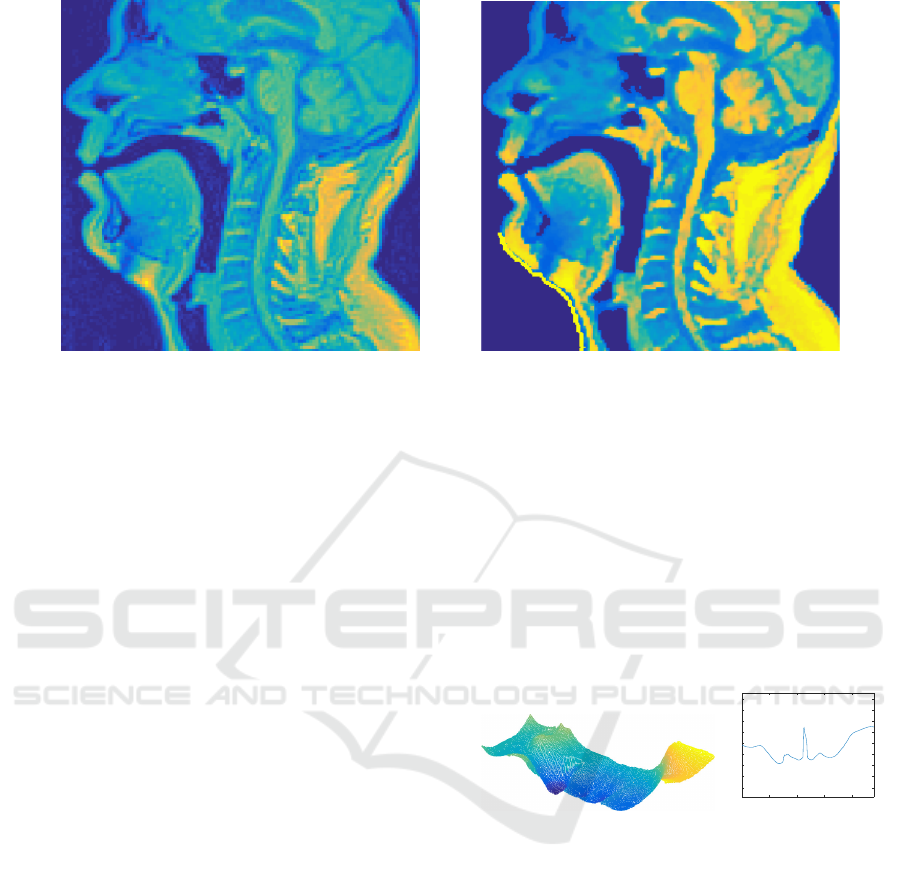
Figure 2: A mid-sagittal section of MRI data before and after the pre-processing steps described in Section 4.
We use the extreme anterior coronal section as a
seed for the region growing algorithm, allowing the
expansion along the rays pointing in the coronal di-
rection, only. Voxels with grey values below the ini-
tial threshold is marked with 1 (with the default value
being 0) until grey values corresponding to tissue are
met. This produces a binary image M of the same di-
mensions, say N
x
× N
y
× N
z
, as the preprocessed data.
Summing over the coronal direction gives a matrix P
2
whose integer elements are the distances (in voxels)
from the most anterior of the coronal sections of the
preprocessed MR image to their nearest tissue voxels.
More precisely, the coordinates of M, indexed by
(i, j, k), correspond to sagittal, transverse, and coro-
nal directions, respectively. The two-dimensional dis-
tance profile P
2
is given by
P
2
(i, j) =
N
z
∑
k=1
M(i, j, k). (1)
The coordinates of the nose can be easily found from
P
2
using peak detection, and we denote the lowest va-
lue of P
2
corresponding to this peak by the integer
k
0
≥ 0, (i.e., the distance of the nose to the most an-
terior coronal plane in the image). Unfortunately, the
peak value k
0
due to the nose may appear in many
elements of P
2
.
To obtain the profile P
1
of the face shown in Fi-
gure 3 (right panel), we average P
2
over 2n +1 sagit-
tal sections, centred at the mid-sagittal section with
coordinate m. More precisely,
P
1
( j) =
m+n
∑
i=m−n
P
2
(i, j) where
m = round
mean
i| min
j
P
2
(i, j) = k
0
.
For the data used in this article, the value n = 20 was
used corresponding to the distance of 19 mm in both
directions.
The transverse position of the chin is quite easy to
find from P
1
. The mouth position can now be found
from between the known positions of the chin and the
nose. Using the anatomic landmarks obtained above,
the anterior air/tissue interface of the oropharynx can
be located. Knowing the positions of these anatomic
details are sufficient for constructing the mask (Step 3
in Section 3).
50 100 150 200
-40
-20
0
20
40
60
80
100
120
Figure 3: Left: Example of a distance function P
2
with
n = 10. Right: A facial profile P
1
as a function of the
transverse coordinate.
6 MASK CREATION
We proceed to discuss Step 3 in Section 3. Because of
the restrictions imposed by the MRI scanner, a mask
is required for blocking out the osseous tissues that
would otherwise mix with the air column interior. The
mask is a binary array of the same 3D dimensions as
the postprocessed MR image.
We create the mask using seeded region growing
based on intensity values (Adams and Bischof, 1994).
The vocal tract has the unique advantage (over the os-
seous tissue volumes) of being connected to the air
volume outside the patient. Thus, the most anterior
coronal section of the voxel data is used as a seed.
BIOIMAGING 2017 - 4th International Conference on Bioimaging
80
Given the high contrast between air and soft tissue
voxel intensities, isolating the maxilla and the mandi-
ble (including parts of the dental structures) from the
air/tissue interface is the only remaining challenge.
6.1 Masking the Osseous Structures
In order to avoid regarding osseous structure as air
in the MR image, the passages caused by the lack of
teeth visibility must be closed. We carry out the clo-
sure by smoothing the preprocessed image data with a
Gaussian kernel (std= 0.65), thus spreading the high
intensity areas around the positions of teeth.
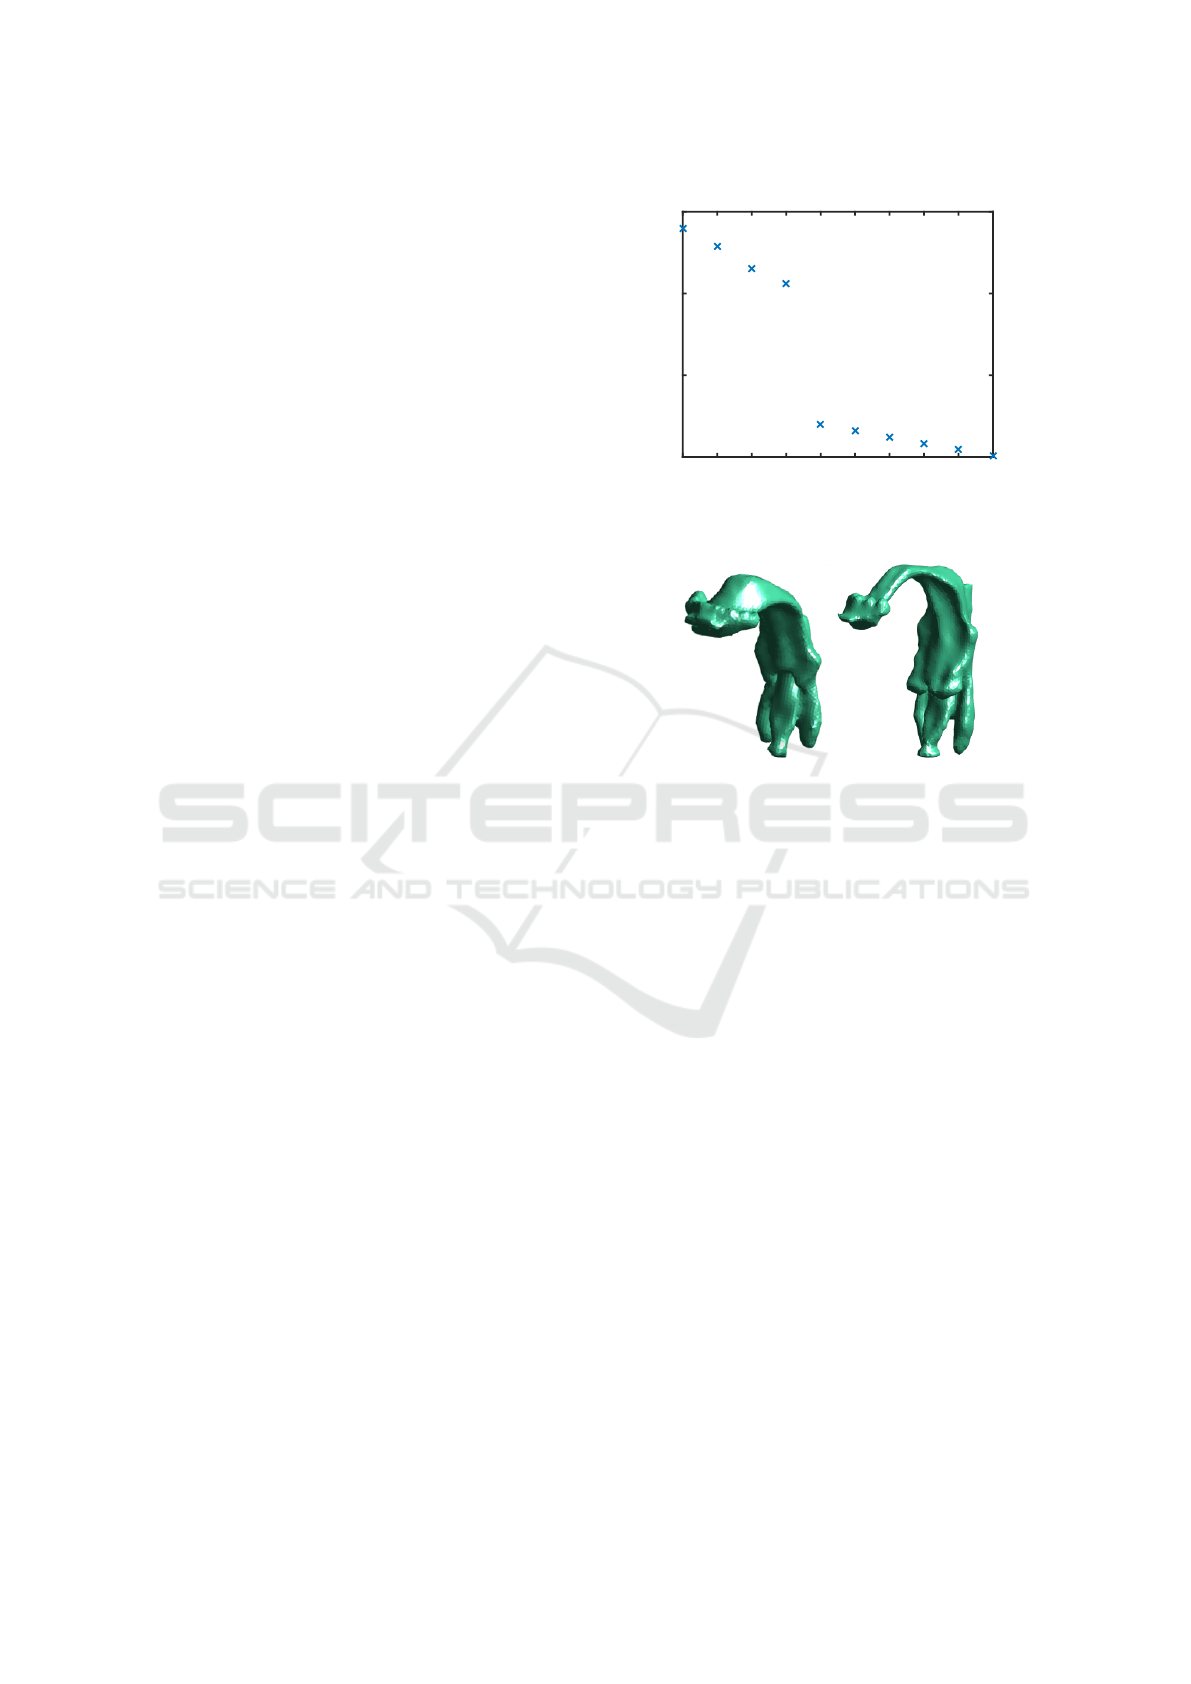
The closure is performed by iterating the follo-
wing steps, using the preprocessed MR image as
image data in the first iteration:
1. The image data is smoothed (again), and a binary
mask is extracted from it as described above.
2. The surface area of the edge (obtained by morpho-
logical operations) of this mask is computed.
3. If a drop large enough is observed in the computed
surface area (see Figure 4), then the iteration is
terminated. Otherwise, return to the first step of
this iteration.
We call the outcome of this process the initial ex-
traction which is a binary mask. The large drop in
the surface area is an indication that the passages due
to teeth have been closed. An example of such a drop
at the 5th iteration round is observed in Figure 4. We
point out that is important to use the surface area of
the mask edge rather than the volume of the mask
since the mandible and maxilla are thin structures
compared to the VT.
The iterative smoothing procedure described
above may also close off the narrow parts of the vo-
cal tract such as the passage near the uvula. Since
the initial extraction is only used for masking out the
teeth, this is acceptable. We first expand the initial
extraction in all directions by a few voxels in order to
account for the loss of edges which are actually part
of the air column in the VT; see Figure 6 (left panel).
The expanded initial extraction is used to mask away
from the preprocessed image data the unwanted de-
tails in the anterior part of the mouth cavity; Figure 6
(middle panel). From this masked image, a refined
mask is extracted without using any smoothing. The
refined mask follows the outline of the VT, but due to
a possibly too low threshold for the grey values, it is
likely not to contain every detail of it – especially the
piriform sinuses and valleculae.
The refined mask is applied to the preprocessed
image data. By increasing the threshold of the grey
values, a further refined mask is produced from it.
1 2 3 4 5 6 7 8 9 10
2.5
3
3.5
4
×10
4
Figure 4: The computed surface area of the mask edge plot-
ted as a function of the number of smoothing steps.
Figure 5: Final extractions of the air/tissue interface from
a female (left) and male (right) test subject with the faces
removed for visual clarity. The vocal tract configurations
correspond to the vowels [œ:] and [y:], respectively.
This process of refining masks and increasing the
threshold is repeated until either (i) the most inferior
transverse section of the image data intersects the air
column described by the mask, or (ii) a pre-defined
maximum threshold value is reached. In the latter
case, the full length of the VT air column fails to be
extracted. The final mask is obtained by expanding
the outcome a few voxels in all directions.
6.2 Mouth Opening
Smoothing used in Section 6.1, Step 1, has the unwan-
ted side effect of closing the mouth opening in parti-
cular for vowels where the opening is already small.
To cancel this side effect, we restore the connectivity
by creating a hole (using an auxiliary mask) to the
smoothed image at the mouth position using the pre-
processed MR image. The auxiliary mask is produced
by seeded region growing in the coronal direction, as
explained in Section 5.
Automated Segmentation of Upper Airways from MRI - Vocal Tract Geometry Extraction
81

Figure 6: From left to right: A sagittal section from (i) the expanded initial extraction, (ii) the masked image used for the
refined extraction, and (iii) the final mask.
7 SURFACE EXTRACTION
The final surface is extracted using the marching cu-
bes algorithm (Lorensen and Cline, 1987). First, the
mask described in Section 6 is applied to the origi-
nal MR image to obtain an artefact-free, intermediate
version of the same voxel data. Second, the marching
cubes algorithm is applied to the intermediate ver-
sion, producing a triangulated surface of the air/tissue
interface. Finally, surface smoothing is applied to
the triangulated surface using the lowpass filter from
iso2mesh (Fang and Boas, 2009). The final outcome
is a triangulated surface model of the air/tissue inter-
face of the VT.
8 DISCUSSION
For validation, the segmentation algorithm was app-
lied to the dataset of 3D MR images (N = 109) descri-
bed in Section 1. The algorithm was able to automa-
tically produce an anatomically and phonetically rea-
listic geometry for the air/tissue interface in all cases.
The geometries were visually inspected for anatomic
correctness, and they were compared with the original
MRI voxel data when necessary. One of the compa-
rison methods is by superimposing the air/tissue con-
tour from the masked MR image (right before surface
mesh extraction) on the original bitmap as shown in
Figure 9.
The quality of the 55 VT configurations from
the male test subject was found to be excellent, and
no segmentation errors were observed. Additionally,
physical models of the surfaces corresponding to
quantal vowels [A, i, u] were created using rapid pro-
totyping. The acoustic properties of the models were
measured using frequency sweeps, and the resulting
estimates of power spectra correspond very well with
those of the recorded speech signals measured during
the MR imaging (Kuortti et al., 2016).
So as to the 54 VT configurations from the female
test subject, the outcome is less satisfactory: anato-
mic details near piriform sinuses were lost in some
of the surface models. Inspecting the original MRI
voxel data leads to the conclusion that there is insuf-
ficient resolution in the grey values produced by the
MRI scanner as can be seen in Figure 8. The high po-
sition of the larynx and the small dimension of ana-
tomic details make the MR examination of the upper
airways challenging in this test subject.
Figure 7: Extracted VT geometry of a test subject where
the uvula is blocking a non-typically large section of the
oropharynx.
It is possible to improve the visibility of piriform
sinuses and valleculae by manually adjusting the grey
values near larynx in the preprocessing stage descri-
bed in Section 4. The advantage of manual interven-
BIOIMAGING 2017 - 4th International Conference on Bioimaging
82
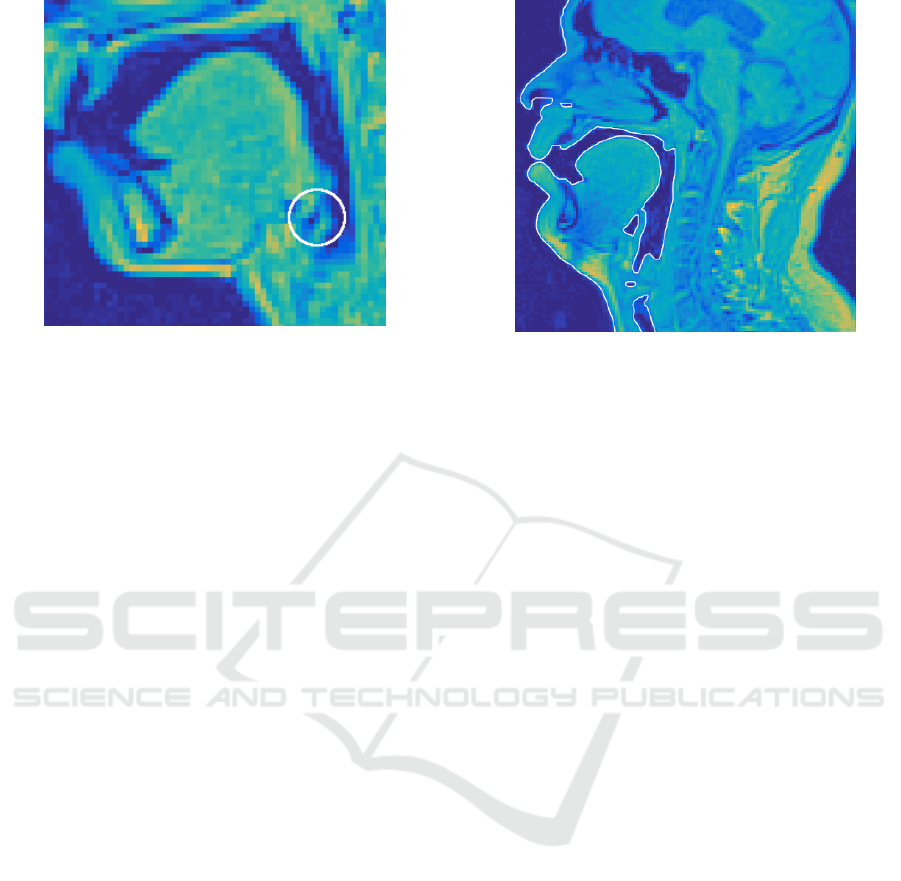
Figure 8: A sagittal section from a female test subject. The
circled area shows that the connection between the piriform
sinus and the VT cannot be resolved.
tion is that the specialist can incorporate her anatomic
expertise to the work flow, and restrict her work to
a very small part of the voxel data where automatic
segmentation proves insufficient. Here, manual cor-
rections were not carried out since the purpose is to
evaluate the quality of automatic surface extraction.
9 CONCLUSIONS
A method for automatically extracting VT surface
meshes from MR images has been proposed. Vali-
dation of the method has been carried out by subjecti-
vely evaluating results produced from two test sub-
jects. Additionally, the outlines of the extractions
were visually compared against the MR image data
in order to verify that no obvious regions have been
omitted. It is also noted that the proposed method
performs better than our previous approach, with the
added benefit of not having to manually create arte-
fact models for each test subject.
ACKNOWLEDGEMENTS
The authors have received funding from Vilho, Yrjö
and Kalle Väisälä Foundation of the Finnish Aca-
demy of Science and Letters and Magnus Ehrnrooth
Foundation for funding this research. The test subject
data collection procedure was accepted by the Ethics
Committee of the Hospital District of Southwest Fin-
land.
The authors wish to express their gratitude to
R. P. Happonen, R. Parkkola, and J. Saunavaara for
cooperation in MRI acquisition.
Figure 9: A sagittal section of the original MRI data supe-
rimposed with an outline describing the extracted air/tissue
interface.
REFERENCES
Aalto, D., Aaltonen, O., Happonen, R.-P., Jääsaari, P., Ki-
velä, A., Kuortti, J., Luukinen, J.-M., Malinen, J.,
Murtola, T., Parkkola, R., Saunavaara, J., Soukka, T.,
and Vainio, M. (2014). Large scale data acquisition of
simultaneous MRI and speech. Appl. Acoust., 83:64–
75.
Aalto, D., Aaltonen, O., Happonen, R.-P., Malinen, J.,
Palo, P., Parkkola, R., Saunavaara, J., and Vainio, M.
(2011). Recording speech sound and articulation in
MRI. In Proceedings of BIODEVICES 2011, pages
168–173.
Aalto, D., Helle, J., Huhtala, A., Kivelä, A., Malinen, J.,
Saunavaara, J., and Ronkka, T. (2013). Algorithmic
surface extraction from MRI data: modelling the hu-
man vocal tract. In Proceedings of BIODEVICES
2013, pages 257–260.
Adams, R. and Bischof, L. (1994). Seeded region growing.
IEEE Transactions on Pattern Analysis and Machine
Intelligence, 16(6):641–647.
Baer, T., Gore, J. C., Boyce, S., and Nye, P. W. (1987). Ap-
plication of MRI to the analysis of speech production.
Magn. Reson. Imaging, 5:1–7.
Baer, T., Gore, J. C., Gracco, L. W., and Nye, P. W. (1991).
Analysis of vocal tract shape and dimensions using
magnetic resonance imaging. J. Acoust. Soc. Am.,
90(2):799–828.
Engwall, O. and Badin, P. (1999). Collecting and analy-
sing two- and three-dimensional MRI data for Swe-
dish. TMH-QPSR, (3-4/1999):11–38.
Fang, Q. and Boas, D. A. (2009). Tetrahedral mesh genera-
tion from volumetric binary and grayscale images. In
2009 IEEE International Symposium on Biomedical
Imaging: From Nano to Macro, pages 1142–1145.
Gonzalez, R. C. and Woods, R. E. (2001). Digital Image
Processing. Addison-Wesley Longman Publishing
Co., Inc., Boston, MA, USA, 2nd edition.
Automated Segmentation of Upper Airways from MRI - Vocal Tract Geometry Extraction
83

Hong, V., Palus, H., and Paulus, D. (2004). Edge Preser-
ving Filters on Color Images, pages 34–40. Springer
Verlag, Berlin, Heidelberg.
Kuortti, J., Malinen, J., and Ojalammi, A. (in press). Post-
processing speech recordings during MRI. Biomed
Signal Process Control.
Lorensen, W. E. and Cline, H. E. (1987). Marching Cubes:
A High Resolution 3D Surface Construction Algo-
rithm. SIGGRAPH Comput. Graph., 21(4):163–169.
Niikawa, T., Matsumura, M., Tachimura, T., Wada, T., Shi-
mizu, K., and Hashimoto, Y. (1996). Accurate mea-
surement of three-dimensional shapes of a vocal tract
and a dental crown using magnetic resonance ima-
ging: Japanese fricative consonants. J. Acoust. Soc.
Am., 100(4):2658–2658.
Poznyakovskiy, A. A., Mainka, A., Platzek, I., and Mü-
rbe, D. (2015). A Fast Semiautomatic Algorithm for
Centerline-Based Vocal Tract Segmentation. BioMed
Research International, 2015:e906356.
Rofsky, N., Lee, V., Laub, G., Pollack, M., Krinsky, G.,
Thomasson, D., Ambrosino, M., and Weinreb, J.
(1999). Abdominal MR imaging with a volume-
tric interpolated breath-hold examination. Radiology,
212(3):876–884.
Rusu, R. B. and Cousins, S. (2011). 3D is here: Point Cloud
Library (PCL). In Robotics and Automation (ICRA),
2011 IEEE International Conference on, pages 1–4.
Sharma, N., Ray, A., Shukla, K., Sharma, S., Pradhan, S.,
Srivastva, A., and Aggarwal, L. (2010). Automa-
ted medical image segmentation techniques. J. Med.
Phys., 35(1):3.
Story, B., Titze, I., and Hoffman, E. (1996). Vocal tract
area functions from magnetic resonance imaging. J.
Acoust. Soc. Am., 100(1):537–554.
Story, B. H., Titze, I. R., and Hoffman, E. A. (1998). Vo-
cal tract area functions for an adult female speaker
based on volumetric imaging. J. Acoust. Soc. Am.,
104(1):471–487.
Takemoto, H., Kitamura, T., Nishimoto, H., and Honda, K.
(2004). A method of tooth superimposition on MRI
data for accurate measurement of vocal tract shape
and dimensions. Acoust. Sci. Technol., 25(6):468–
474.
Vascular Modeling Toolkit (2016). http://www.vmtk.org.
Accessed Sept. 28th, 2016.
BIOIMAGING 2017 - 4th International Conference on Bioimaging
84
