
Protein Disorder Prediction using Information Theory Measures on the
Distribution of the Dihedral Torsion Angles from Ramachandran Plots
Jonny A. Uribe
1
, Juli
´
an D. Arias-Londo
˜
no
1
and Alexandre Perera-Lluna
2
1
Department of Systems Engineering and Computer Science, Universidad de Antioquia,
Calle 67 No. 53 - 108, 050010, Medell
´
ın, Colombia
2
Research Center for Biomedical Engineering, ESAII, Universitat Polit
`
ecnica de Catalunya,
Pau Gargallo 5, 08028, Barcelona, Spain
Keywords:
Intrinsically Disordered Proteins, Intrinsically Disordered Regions, Entropy Measures, Kullback-Leibler
Divergence, Dihedral Torsion Angles, Ramachandran Plot, Conditional Random Fields.
Abstract:
This paper addresses the problem of order/disorder prediction in protein sequences from alignment free meth-
ods. The proposed approach is based on a set of 11 information theory measures estimated from the distribu-
tion of the dihedral torsion angles in the amino acid chain. The aim is to characterize the energetically allowed
regions for amino acids in the protein structures, as a way of measuring the rigidity/flexibility of every amino
acid in the chain, and the effect of such rigidity on the disorder propensity. The features are estimated from
empirical Ramachandran Plots obtained using the Protein Geometry Database. The proposed features are used
in conjunction with well-established features in the state of the art for disorder prediction. The classification
is performed using two different strategies: one based on conventional supervised methods and the other one
based on structural learning. The performance is evaluated in terms of AUC (Area Under the ROC Curve), and
three suitable performance metrics for unbalanced classification problems. The results show that the proposed
scheme using conventional supervised methods is able to achieve results similar than well-known alignment
free methods for disorder prediction. Moreover, the scheme based on structural learning outperforms the
results obtained for all the methods evaluated, including three alignment-based methods.
1 INTRODUCTION
Disordered proteins are proteins which do not adopt
a fixed 3D structure in their native state. There are
two possible dispositions: the complete protein re-
mains without a fixed tertiary structure or some of its
parts fail to fold and persist in a flexible configura-
tion. These two kind of arrangements are known as
Intrinsically Disordered Proteins (IDP) and Intrinsi-
cally Disordered Regions (IDR) respectively (Dunker
et al., 2008). In the last years, discovery and charac-
terization of disordered proteins has become one of
the fastest growing areas in protein science (He et al.,
2009), mainly because many IDPs were found to be
associated with human diseases including cancer, dia-
betes, cardiovascular affection, amyloidoses and neu-
rodegenerative diseases (Uversky et al., 2008). Nev-
ertheless, the experimental determination of IDP and
IDR is costly and require both, a lot of time and an
extensive expertise (He et al., 2009). Taking into ac-
count the large amount of proteins sequences avail-
able, there is a need for alternative methods able to
offer a reliable and fast way to detect disorder in
proteome-wide analysis. In this scenario, as in many
other bioinformatics subfields, computational meth-
ods have become valuable candidates to provide al-
ternative solutions (Peng et al., 2015)(Varadi et al.,
2015).
One of the main distinguishing characteristics of
the current computational methods for detecting dis-
order, lies in the use of Multiple Sequence Align-
ment (MSA) algorithms. In particular PSI-BLAST
(Altschul et al., 1997) is recurrently used for several
disorder predictors as a preliminary phase for identi-
fying proteins homologues, and tune Position Score
Matrices (PSSM). PSSM can capture the statistical
variations of every amino acid on targeted proteins.
These matrices are used later as inputs for the dis-
order predictors, improving in this way the perfor-
mance in comparison with the use of only the raw
protein sequences. The power of sequence alignment
in bioinformatics methods is undeniable but imposes
a set of issues. One of them is the computational cost
that can become relevant when the method is used
Uribe J., Arias-LondoÃ
´
so J. and Perera-Lluna A.
Protein Disorder Prediction using Information Theory Measures on the Distribution of the Dihedral Torsion Angles from Ramachandran Plots.
DOI: 10.5220/0006140500430051
In Proceedings of the 10th International Joint Conference on Biomedical Engineering Systems and Technologies (BIOSTEC 2017), pages 43-51
ISBN: 978-989-758-214-1
Copyright
c
2017 by SCITEPRESS – Science and Technology Publications, Lda. All rights reserved
43

on large scale proteome analysis (thousands to mil-
lions of proteins). A second and more relevant draw-
back is the implicit assumption that the proteins un-
der evaluation have a pool of homologous proteins
into the known databases, from which annotations
can be transferred. In the disorder identification do-
main, some of the methods that take advantage of the
MSA algorithms include PONDR (Xue et al., 2010),
DISOPRED (Jones and Cozzetto, 2014) and SPINE-
D (Zhang et al., 2012).
On the other hand, methods that avoid sequence
alignment can reach more modest classification re-
sults on known datasets, but can be applied compara-
tively faster on huge databases of unlabeled proteins
(DeForte and Uversky, 2016), and more importantly,
they do not make assumptions about the existence of
homologues proteins.
Among the most used alignment-free methods
for protein disorder prediction are IUPRED and Es-
pritz (Dosztnyi et al., 2005), (Walsh et al., 2012).
IUPRED uses the amino acid pair interaction en-
ergy estimated using only the amino acid composi-
tions, to create matrices of potentials between amino
acids. The authors concluded that when a sequence
contains few hydrophobic residues, the composition-
based mutual interaction energy will be small, indi-
cating the lack of potential for folding. In IUPRED
the scoring matrices were adjusted using a Support
Vector Machine (SVM)(Vapnik, 1998) and indepen-
dent models were created for short and long disorder
regions. IUPRED is computationally fast and have
been used in proteome-wide analyses (Oates et al.,
2013) (Potenza et al., 2015). The systems that use
predictors ensembles (metapredictors) recurrently in-
cluded IUPRED as a component (Bulashevska and
Eils, 2008) (Lieutaud et al., 2008), and in many works
where new predictors are proposed, IUPRED is used
as a baseline for comparison purposes (He et al.,
2009)(Deng et al., 2012).
On the other hand, Espritz is based on a Bidirec-
tional Recursive Neural Network whose inputs are 5
scales obtained from the clustering of AAindex prop-
erties (Kawashima and Kanehisa, 2000), and a one-
hot enconding vector of length 20, which identify the
amino acid being modeled/evaluated at a time. It
means that given an amino acid, this property vector
will have a value 1 for only one position, and 0s for
the 19 other positions. Espritz is also a fast predictor
used in similar scenarios than IUPRED and therefore
well suitable for performance comparison.
One strategy for improving the current protein dis-
order prediction levels, is to find novel characteristics
that can carry information related to the folded or un-
folded state of amino acids groups. Moreover, one of
the main challenges of the characterization methods
used by disorder predictors, is be able to codify infor-
mation about critical components responsible of pro-
teins stability and/or related to the energetics of pro-
teins folding. In this context, the dihedral torsion an-
gles of the amino acid chain can play a relevant role,
since they are commonly used to define the degrees of
freedom of the residues, i.e. these angles contain in-
formation about restrictions, allowed values and ten-
dencies associated to the secondary structure of the
proteins (Hollingsworth and Karplus, 2010). Due to
this fact, in (Baruah et al., 2015), the dihedral angles
were used with the aim of estimating the conforma-
tional entropy of IDP, IDR, and completely ordered
proteins. The proposed metric was found to be a po-
tential measure for the discrimination of complete dis-
ordered vs complete ordered proteins.
The information about the set of torsion angles
that one amino acid is able to access, can be found on
graphical representations called Ramachandran plots
(RP). RPs are empirical distributions of the torsion
angles estimated from thousands of proteins with
known structure. Therefore, RPs can be used to
quantify the statistical preference that known proteins
obey, and furthermore by using the RPs of adjacent
amino acids in a protein, estimate the conditional re-
lationships into an amino acid neighborhood.
Bearing this in mind, in this work a set of 11 infor-
mation theory metrics estimated on empirical RPs, are
used for the creation of sequence based features that
allow the quantification of disorder tendency along a
protein. The proposed features are based on entropy
measures and divergences on RPs coming from in-
dividual, duples and triads of amino acids, and link-
ing amino acid context for capturing disorder propen-
sity. The measures between amino acids, are based
on the estimation of conditional distributions between
adjacent residues, and on the quantification of diver-
gences among the marginal distributions of neighbor
amino acids. Additionally, well-known characteris-
tics for the detection of disorder are evaluated in con-
junction with the proposed features. The classifica-
tion of order/disorder is carried out using two dif-
ferent strategies: a conventional supervised learning
method based on SVM and Random Forest, and a
structural learning scheme based on Conditional Ran-
dom Fields (CRFs) (Lafferty et al., 2001). CRFs are
discriminative non-parametric models able to capture
the correlation amongst neighboring labels in a se-
quence, therefore they are suitable for the annotation
of amino acids as ordered/disordered considering the
dependence into segments of the whole protein se-
quence.
The rest of the papers is organized as follows: sec-
BIOINFORMATICS 2017 - 8th International Conference on Bioinformatics Models, Methods and Algorithms
44

tion 2 presents the set of variables proposed and the
learning strategies. It also describes the dataset and
the validation methodology. Section 3 presents the
results obtained and finally section 4 includes some
conclusions extracted from the work.
2 MATERIAL AND METHODS
2.1 Characterization
The RPs used in this work were obtained from the
Protein Geometry Database (Berkholz et al., 2009),
using a resolution of 5 degrees per bin. In this way
φ and ψ coordinates took each 72 values, giving then
5184 discrete bins per amino acid. Intensities in every
bin quantify the preference for a particular φ and ψ
configuration.
The 20 amino acids have different preference in
the φ and ψ space. This occurs because differences in
the three-dimensional structure of the residues confer
different ranges of flexibility. A plot showing some
RPs for representative amino acids is shown in Figure
1. It is easy to note that the space explored by amino
acid Proline is quite limited in comparison with other
amino acids as, for example, Glycine. The backbone
covalent link in Proline imposes strong rigidity on the
molecule, reducing the possible φ and ψ valid angles.
By contrast, the residue in Glycine is just a single
atom of hydrogen giving the molecule ample flexi-
bility and also the possibility of exploring a bigger
φ and ψ space. This kind of differences suggest that
RPs can be used to quantify the flexibility tendency of
amino acids and, consequently, create measures that
contribute to identify the disordered regions.
2.1.1 Metrics Estimated on Individual Amino
Acids
Let us consider the RP of an aminoacid as a bivari-
ate probability distribution, assuming the set of back-
bone dihedral angles Φ and Ψ as random variables.
As more “flexible” an amino acid is, more pairs of
angles would be able to visit. A way to measure the
rigidity/flexibility of one amino acid is by using the
Shannon Entropy of the torsion angle distributions.
Let P
a
(Φ = φ,Ψ = ψ) = P
a
(φ,ψ) be the probability
of taking the disposition given by the couple angles φ
and ψ, in the a-th amino acid; the Shannon entropy of
the whole map can be expressed as
Hs
a
= −
∑
∀φ
∑
∀ψ
P
a
(φ,ψ)log(P
a
(φ,ψ)) (1)
A low value of H indicates a “rigid” amino acid, i.e.
an amino acid able to visit a less number of regions
Figure 1: Ramachandran Plots of some amino acids, Pro-
line, Aspartic Acid, Tyrosine and Glycine. φ is along x-axis
and ψ is along y-axis.
in the RP. Considering that relevant information can
be diffused on map regions with low probability in-
tensity, Renyi entropies were also used. The Renyi
estimator of the individual RP entropy can be defined
as
Hr
a
=
1
1 −α
log
∑
∀φ
∑
∀ψ
P
a
(φ,ψ)
α
!
. (2)
where the order parameter α has the function of
weighting probabilities values, in order to make low
represented regions comparable to high populated
ones. Another way to characterize the energetically
allowed regions for amino acids in the protein struc-
tures, is by comparing the RP of individual amino
acids with respect to a consensus RP. The consensus
RP essentially contains all possible regions explored
for any amino acid in the dataset. Relative variations
of a given individual amino acid RPs, with respect to
the consensus RP, offer a mechanism for capturing lo-
cal preferences. Let R(φ, ψ) denote the reference RP
distribution, the difference between R and the RP dis-
tribution of the a-th amino acid can be estimated using
the Kullback-Leibler (KL) divergence given by:
D
a
(R||P
a
) =
∑
∀φ
∑
∀ψ
R(φ,ψ)log
R(φ,ψ)
P
a
(φ,ψ)
. (3)
2.1.2 Metrics Estimated on Pairs of Amino
Acids
Although considering individual amino acids is a
good method for capturing information related to dis-
order, more powerful descriptors can be obtained if
Protein Disorder Prediction using Information Theory Measures on the Distribution of the Dihedral Torsion Angles from Ramachandran
Plots
45

sets of amino acids along the chain are studied. Using
consecutive pairs of amino acids is a natural exten-
sion for investigating local interacting residues. Once
again the KL divergence can be used for measur-
ing the dissimilarities between all possible pairs of
residues’s RPs. The divergence between two amino
acids a and b can be expressed as
D
ab
(P
a
||P
b
) =
∑
∀φ
∑
∀ψ
P
a
(φ,ψ)log
P
a
(φ,ψ)
P
b
(φ,ψ)
(4)
Since KL divergence is not a symmetric measure,
a commonly used symmetric version of KL is given
by Ds
ab
=
1
2
(D
ab
+ D
ba
). This correspond to travers-
ing the protein from N-terminus to C-terminus and
vice-versa, and then averaging their contributions.
Nevertheless, in previous experiments the values of
D
ab
(·,·) between the RPs P
a
and P
b
were almost equal
to the symmetric version, so the one direction coding
was finally employed.
The comparison carried out by D
ab
(·,·) evaluates
the dissimilarity between the energetically allowed
regions for the a-th and b-th amino acids. How-
ever, by considering that consecutive amino acids in
a protein share a dipetide plane, the dissimilarity be-
tween neighbors amino acids can be estimated us-
ing the distribution of the torsion angles ψ
i
of the
i-th amino acid, and the distribution of φ
i+1
of the
next one. In order to quantify such a dissimilarity,
the comparison between adjacent amino acids can
be estimated evaluating the KL divergence between
the marginal distributions P
i
(ψ) =
∑
∀φ
P
i
(φ,ψ), and
P
i+1
(φ) =
∑
∀ψ
P
i+1
(φ,ψ). As in the former case, this
measure can also be estimated by traversing the pro-
tein from N-terminus to C-terminus.
2.1.3 Metrics Estimated on Triads of Amino
Acids
Local interaction between amino acids can be ex-
plored beyond, for example using triplets, quatruples
or quintuples. In this work a method for quantify-
ing the local interaction between consecutive amino
acids is proposed. The intuition behind the proposed
method is to use the marginal distributions of torsion
angles estimated from neighbors amino acids, to eval-
uate how one amino acid modify the regions in the RP
that the torsion angles of the next one can visit. This
analysis can be extended to chains of amino acids of
arbitrary length. In this work this idea is explored for
triads of amino acids.
Let us consider a triad of consecutive amino acids
A, B, an C, as shown in Fig. 2. By assuming that
the random variable Ψ
A
(which denote the torsion an-
gles ψ in the A-th amino acid), is independent from
the random variable Φ
B
, the joint distribution between
P
A
(ψ) and P
B
(φ), denoted by P
AB
(φ) can be estimated
as the product between the two marginal distributions,
when both random variables take the same value, i.e.
P
AB
(φ) = P
A
(Ψ = φ)P
B
(Φ = φ). Taking into account
that the set of torsion angles Ψ
B
is limited directly
by Φ
B
due to structural conformation restrictions, the
conditional distribution P
B
(ψ|φ) can be expressed as
Figure 2: Schematic of a triads of amino acids A, B, and C,
whose dependence can be represented using the conditional
marginal distribution along the triads.
P
B
(ψ|φ) =
P
B
(ψ,φ)
P
B
(φ)
(5)
Assuming that Φ
B
is in turn limited by the set Ψ
A
of the previous amino acid, the marginal distribution
P
B
(ψ) can be estimated conditioning it with respect
the aminoacid A, by replacing P
B
(φ) with the joint
distribution P
AB
(φ). The marginal distribution P
B
(ψ)
can be expressed as
P
B
(ψ) =
∑
∀φ
P
B
(ψ|φ)P
AB
(φ) (6)
The procedure can be extended to the next amino
acid in a similar way, by using the former P
B
(ψ) to
estimate the joint distribution P
BC
(φ). The entropy of
the last “conditional” marginal distribution estimated
in this way, can be considered as a metric of the vari-
ability in the energetically allowed regions of the last
amino acid conditioned on the previous ones.
The final set of the proposed metrics included
a simple dot product between marginal probabili-
ties from consecutive RPs, the Shanon entropies esti-
mated on the logarithm of the RPs, and two different
Renyi entropies using the parameter al pha equal to
0.1 and 0.3.
Additionally characteristics with known rele-
vance in the identification of disorder were used.
This included secondary structure predictions from
PSIPRED (McGuffin et al., 2000), selected physical-
chemical properties from AAIndex (Kawashima and
Kanehisa, 2000), pseudo amino acid compositions
(Chou, 2001), pattern of asymmetric charge variation
(Das et al., 2015), sequence complexity and a simple
indicator of amino acid positions in the protein chain.
Overall 85 properties are used, from these 11 are the
BIOINFORMATICS 2017 - 8th International Conference on Bioinformatics Models, Methods and Algorithms
46

ones proposed in this work and are summarized in Ta-
ble 1. Details about complementary features can be
found in the Appendix.
2.2 Classification Methods
Three different classification models were used in this
work for identifying disordered and ordered amino
acids. In first place Random Forest (RF) was used
with 500 trees grown. The number of variables ran-
domly sampled at each split was selected in cross vali-
dation on training data. The predictor based on the set
of proposed measures and a Random Forest classifier,
was named RF InfoThor.
On the other hand Support Vector Machines
(SVM) were trained using a Gaussian RBF kernel.
The regularization parameter C and the kernel band-
width σ, were found through a grid search using train-
ing data. The predictor based on the set of pro-
posed measures and a SVM classifier, was named
SVM InfoThor.
The classification using RF and SVM, assumes
that the label of each amino acid is independent from
each other into the protein sequence. On the contrary,
structural learning methods are able to model differ-
ent statistical dependences among elements on a se-
quence. This is the case of the probabilistic models
known as Conditional Random Fields (CRFs), which
are able to segment and label sequence data (Laf-
ferty et al., 2001). The CRFs have several advan-
tages in comparison to more classical models for se-
quence classification such as hidden Markov mod-
els. To name just a few, CRFs belong to the class
of discriminative models, so the try to model directly
the conditional distribution of the labels given the in-
put variables, which is more suitable for classifica-
tion purposes. Besides, CRFs are not restricted to
strong independence assumptions made in those mod-
els, and the loss function used for training is convex,
guaranteeing convergence to the global optimum. In
this work a Chain-structured CRF is used to model
correlation amongst neighboring labels. The predic-
tor based on the set of proposed measures and a CRF
classifier, was named CRF InfoThor.
2.3 Experimental Setup
The proposed characterization methods were evalu-
ated on the target data set and their result were com-
pared with sequence based predictors: IUPRED and
Espritz and also with MSA based methods, SPINE-D,
DISOPRED and PONDR.
2.3.1 Data Sets
High quality and extensive disorder proteins
databases are still a missing resource in the field.
The most referenced and commonly used database
is DisProt (Sickmeier et al., 2007) which contains
manually curated annotations supported on scientific
publications. Version 6.02 created in 2013 contains
694 proteins. Unfortunately DisProt is not free of
problems, in particular the ordered residues are not
labeled and many disordered regions have more than
one annotation.
The SL benchmark data set (Sirota et al., 2010) is
a subset of Disprot that mitigates some of these issues.
For the sake of comparison with other predictions
methods, the performance of the proposed measures
was evaluated on the SL329 Data set, which was pre-
pared in (Zhang et al., 2012). The referenced authors
created the database selecting proteins with sequence
homology less than (25%) from the SL benchmark
data set. SL329 contains 329 proteins with 51292 or-
dered residues and 39544 disordered residues.
2.3.2 Model Validation
All the experiments were carried out using a 10-
fold cross-validation strategy. In general data sets
can include some level of imbalance between ordered
and disordered proteins, then some metrics able to
quantify the performance in such scenarios were in-
cluded. The set of metrics used includes: AUC, Sen-
sitivity, Specificity, B
ACC
, MCC and P
Excess
. AUC
refers to the area under the ROC curve, being dis-
order the positive class. MCC is the Matthews cor-
relation coefficient, which according to (Baldi et al.,
2000) is an appropriate measure of performance for
unbalanced data sets. MCC can be estimated as
MCC =
T P·T N−FP·F N
√
(T P+F P)·(T P+FN)·(T N+F P)·(T N+F N)
, where
TP denotes True Positive, TN stands for True Neg-
ative, FP is False Positive and FN is False Negative.
On the other hand, B
ACC
is the balanced accuracy
which can be expressed as
B
ACC
=
Sensi + Speci
2
(7)
where Sensi = T P/(T P + FN), and Speci =
T N/(T N +FP) are the sensitivity and the specificity
respectively. Finally, P
Excess
called the probability of
excess, depends also on the sensitivity and specificity
and can be expressed as P
Excess
= Sensi + Speci −1.
Protein Disorder Prediction using Information Theory Measures on the Distribution of the Dihedral Torsion Angles from Ramachandran
Plots
47

Table 1: Summary of Ramachandran Plot Based Metrics.
Descriptor name Description
Hs a Shanon entropy on the vectorized RPs of every single amino acid
Hs density(a) Shanon entropy on the kernel density estimates of the vectorized RPs
Hs density(log(a)) Shanon entropy on the estimated densities of the logarithm of the counts from the Rps
Hr
a
(0.1)Hr
a
(0.31) Renyi Entropy using alpha parameter 0.1 and 0.31 on the RPs matrices
KL individual RP Kullback-Leibler Divergence of individual amino acid RP and reference RP
KL consecutive RPs Kullback-Leibler Divergence between every amino acid RP vs the next
amino acid RP in the protein chain
KL Marg. Angles (eps) Kullback-Leibler Divergence on the marginals angles φ and ψ of
neighborhood amino acids, adding a epsilon value on the distributions
KL Marg. Angles (freqs) Kullback-Leibler Divergence on the marginals angles φ and ψ of
neighborhood amino acids, using densities estimates on marginal distributions
Dot Product Marg. Angles Dot product between the marginals angles φ and ψ
Marginal on Triads Marginal on cumulative φ angle triads
3 RESULTS
3.1 Results on SL329 Data Set
Table 2 shows evaluation results on benchmark SL329
data set. It is possible to observe that the methods us-
ing sequence alignment (SPINE-D and DISOPRED)
obtained better performance on this data set than
IUPRED, as expected. On other hand, Espritz showed
a good performance compared with MSA-based
methods. The conventional proposed approaches,
SVM InfoThor and RF InfoThor, got competitive
results in MCC and balanced accuracy metrics
when compared with IUPRED. However, it was the
proposed structural learning scheme CRF InfoThor,
which obtained the best performance among all the
methods evaluated, and according to all the metrics.
In terms of MCC and AUC, CRF InfoThor outper-
forms IUPRED in about 13% and 6% respectively,
considering relative differences. CRF InfoThor also
outperforms the state-of-art MSA-based methods,
sometimes with a considerably margin, for example
MCC metric of CRF InfoThor is 14% higher that
the same value in PONDR-FIT. The performance of
CRF InfoThor is better, although pretty close, to the
one obtained by SPINE-D. This result could be ex-
plained due to the fact that SPINE-D corresponds
to an adaptation of a secondary structure predictor,
which was based on the prediction of torsion angles
from sequence profiles (Faraggi et al., 2009) (Faraggi
et al., 2012). CRF InfoThor can use information of
torsion angles by applying a more simple strategy
based only in the protein sequence, and without the
need of using MSA algorithms.
Figure 3 shows in a simpler way the performance
of the evaluated models. From it, is easier to observe
how CRF InforThor metrics are comparable and even
better with respect to the performance of the state-of-
Table 2: Performance comparison among Disorder Identifi-
cation Methods on SL329 data set.
Method AUC MCC B
ACC
P
Excess
CRF InfoThor 0.8876 0.6393 0.8172 0.6343
SVM InfoThor 0.8027 0.4789 0.7362 0.4724
RF InfoThor 0.8206 0.5092 0.7450 0.4899
SPINE-D 0.8860 0.6300 0.8150 0.6300
DISOPRED2 0.8580 0.5900 0.7950 0.5900
PONDR-FIT 0.8430 0.5500 0.7600 0.5200
IUPRED 0.8392 0.5536 0.7575 0.5151
Espritz 0.8632 0.6058 0.7981 0.5963
Figure 3: Performance comparison of methods evaluated on
the SL329 data set.
art methods.
In order to evaluate the importance of the vari-
ables for the order/disorder prediction, the statisti-
cally most relevant variables were found using the
SVM InfoThor model, following this scheme: The
SVM was repeatedly trained using only one variable
at a time, and AUC metric on test samples was used
for ranking the features. This process was carried out
in a 10-fold cross-validation test. The relative impor-
tance was later adjusted to a 0 to 100 scale, where
100 was indicative of the most important feature. Al-
though this analysis ignores the contribution that co-
variated features provide to the classification perfor-
mance, it is able to offer a first indication of the im-
BIOINFORMATICS 2017 - 8th International Conference on Bioinformatics Models, Methods and Algorithms
48
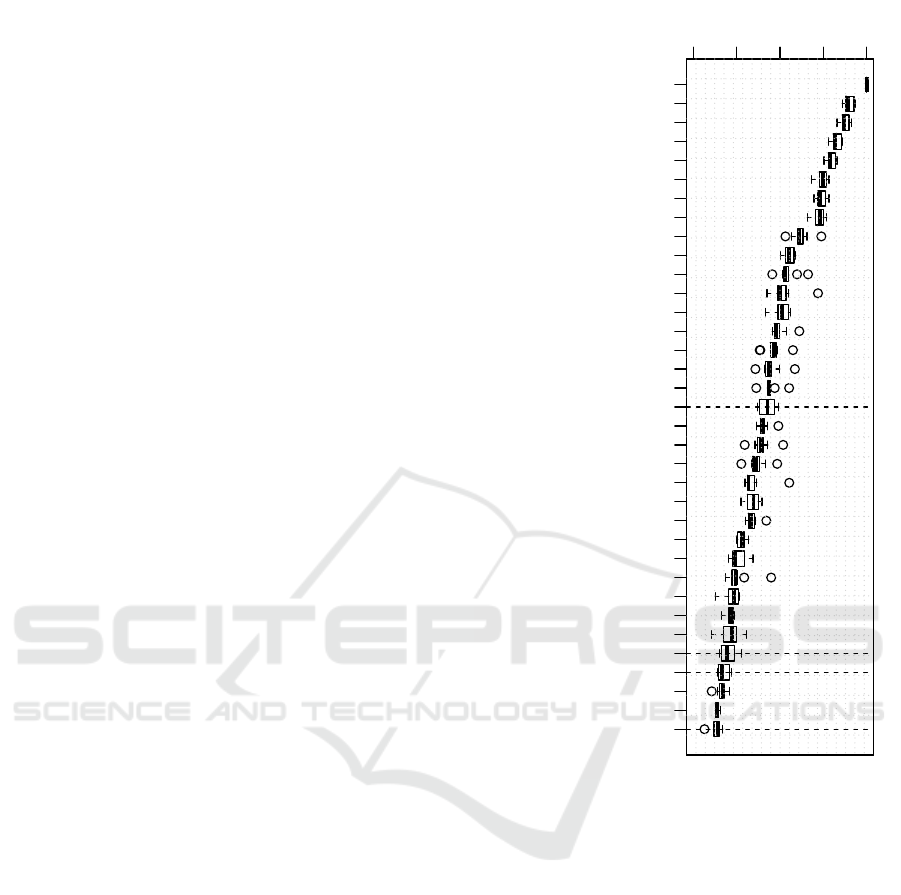
pact that proposed characteristics have in the model.
According to this analysis, the 35 most important
features are shown on Figure 4. RP based character-
istics are signaled with horizontal dotted lines.
The complexity on the raw sequence is consis-
tently the most valuable feature for discrimination. It
is followed in relevance by the tuned scale IDPHy-
dropathy and other already well known descriptors. It
is notorious that the simple dot product metric, quan-
tifying difference between marginal probabilities of
φ and ψ consecutive amino acids, scored high in rel-
evance. Some of the proposed characteristics were
ranked also in this elite set, concretely: KL Marginal
Angles (eps), KL Marginal Angles (freqs) and KL Di-
vergence on RP. From this data, can be stated that the
Kullback-Leibler divergence metrics on the marginals
of RP distributions were key to reach the discrimina-
tive power of the model.
4 DISCUSSION AND
CONCLUSIONS
Ramachandran Plot’s importance in the determination
of secondary and tertiary structure have been clearly
recognized for many decades. Torsion angles between
amino acids determine unequivocally the structural
folding of proteins and thus RPs have been used as
complementary tool for predicting and evaluating ex-
perimental found configurations of thousands of pro-
teins. In this sense, RPs can be interpreted as proba-
bility distributions that allow to quantify the statistical
preference that known proteins obey in relation with
their torsion angles and secondary structure state.
In the case of disordered proteins, the challenge is
immense because torsion angles between these amino
acids explore continually many configuration states
without converging to any particular point. The pro-
posed features in this work, which are based on in-
formation theory metrics on the RPs, explore the
discrimination capability of the information obtained
from torsion angles of the chain. According to the
results, the proposed metrics contain relevant infor-
mation that can be used in combination with conven-
tional features in the state-of-art, in order to improve
the accuracy in the identification of disorder. Taking
into account that the proposed features are estimated
from RPs, they can be considered fast and easy to
compute. Therefore, their use in proteome-wide anal-
ysis can be introduced easily.
Structural limitations permit to assume that amino
acids in disorder, are also confined to the allowed re-
gions in the RPs, but the dynamical rules governing
torsion angle variation remain unknown. For some
Complexity
IDPHydropathy
BASU050102
NISK860101
WERD780101
topIDPScale
AAIndex PCA 1
VINM940101
Pseudo Amino Acid 1
RADA880108
Pseudo Amino Acid 6
Pseudo Amino Acid 2
GUYH850101
Pseudo Amino Acid 8
Amino Acid I
Pseudo Amino Acid 5
Pseudo Amino Acid 7
Dot Product Marg. Angles
GEIM800108
Pseudo Amino Acid 10
Pseudo Amino Acid 9
Pseudo Amino Acid 4
Amino Acid F
Amino Acid L
ss_coil
Amino Acid P
Pseudo Amino Acid 3
KYTJ820101
CHAM820102
Amino Acid Y
KL Marginal Angles (eps)
KL Marg. Angles (freqs)
NAKH920105
BLAM930101
KL Divergence on RP
60 70 80 90 100
Figure 4: Boxplots of Feature Relevance for the 35 most
important features on the 10 CV SVM model, trained on
SL329 Dataset. Importance is measured in a 0-100 scale,
being 100 the value of the most important feature. Horizon-
tal lines signal the proposed RP derived features.
IDR their propensities to shape into an specific sec-
ondary structure after binding, show that assuming
completely randomness on the torsion angles of dis-
ordered amino acids is almost surely not appropriate
(Uversky, 2013). In the context of IDPs, empirical
known RPs can be considered as statistical cumula-
tive values from a related process focused in folding
the protein; process that is intentionally and subtly
avoided by the disordered amino acids. Accordingly,
the empirical RPs give indirect indications of the dis-
order in proteins and can be used as source of infor-
mation for training disorder predictors. The combina-
tion of the proposed features and CRF reached better
performance than state-of-art predictors on the evalu-
ated data set, without the need of include a previous
MSA stage. This encourages future work in the im-
Protein Disorder Prediction using Information Theory Measures on the Distribution of the Dihedral Torsion Angles from Ramachandran
Plots
49

provement of the characterization phase based on the
RPs and the evaluation of other classification strate-
gies, that can take even more advantage of the new
features. It is clear also that the proposed method-
ology must be evaluated on large data sets as those
resources become available.
REFERENCES
Altschul, S. F., Madden, T. L., Sch
¨
affer, A. A., Zhang,
J., Zhang, Z., Miller, W., and Lipman, D. J. (1997).
Gapped blast and psi-blast: a new generation of pro-
tein database search programs. Nucleic acids re-
search, 25(17):3389–3402.
Baldi, P., Brunak, S., Chauvin, Y., Andersen, C. A., and
Nielsen, H. (2000). Assessing the accuracy of predic-
tion algorithms for classification: an overview. Bioin-
formatics, 16(5):412–424.
Baruah, A., Rani, P., and Biswas, P. (2015). Conforma-
tional entropy of intrinsically disordered proteins from
amino acid triads. Scientific reports, 5.
Berkholz, D. S., Krenesky, P. B., Davidson, J. R., and
Karplus, P. A. (2009). Protein Geometry Database:
a flexible engine to explore backbone conformations
and their relationships to covalent geometry. Nucleic
acids research, page gkp1013.
Bulashevska, A. and Eils, R. (2008). Using Bayesian multi-
nomial classifier to predict whether a given protein se-
quence is intrinsically disordered. Journal of theoret-
ical biology, 254(4):799–803.
Campen, A., Williams, R. M., Brown, C. J., Meng, J.,
Uversky, V. N., and Dunker, A. K. (2008). TOP-
IDP-scale: a new amino acid scale measuring propen-
sity for intrinsic disorder. Protein and peptide letters,
15(9):956.
Chou, K.-C. (2001). Prediction of protein cellular attributes
using pseudo-amino acid composition. Proteins:
Structure, Function, and Bioinformatics, 43(3):246–
255.
Das, R. K., Ruff, K. M., and Pappu, R. V. (2015). Relating
sequence encoded information to form and function
of intrinsically disordered proteins. Current opinion
in structural biology, 32:102–112.
DeForte, S. and Uversky, V. N. (2016). Order, disorder, and
everything in between. Molecules, 21(8):1090.
Deng, X., Eickholt, J., and Cheng, J. (2012). A compre-
hensive overview of computational protein disorder
prediction methods. Molecular BioSystems, 8(1):114–
121.
Dosztnyi, Z., Csizmok, V., Tompa, P., and Simon, I. (2005).
IUPred: web server for the prediction of intrinsically
unstructured regions of proteins based on estimated
energy content. Bioinformatics, 21(16):3433–3434.
Dunker, A. K., Oldfield, C. J., Meng, J., Romero, P., Yang,
J. Y., Chen, J. W., Vacic, V., Obradovic, Z., and Uver-
sky, V. N. (2008). The unfoldomics decade: an update
on intrinsically disordered proteins. BMC genomics,
9(Suppl 2):S1.
Faraggi, E., Yang, Y., Zhang, S., and Zhou, Y. (2009). Pre-
dicting continuous local structure and the effect of its
substitution for secondary structure in fragment-free
protein structure prediction. Structure, 17(11):1515–
1527.
Faraggi, E., Zhang, T., Yang, Y., Kurgan, L., and Zhou, Y.
(2012). SPINE X: improving protein secondary struc-
ture prediction by multistep learning coupled with
prediction of solvent accessible surface area and back-
bone torsion angles. Journal of computational chem-
istry, 33(3):259–267.
He, B., Wang, K., Liu, Y., Xue, B., Uversky, V. N., and
Dunker, A. K. (2009). Predicting intrinsic disorder in
proteins: an overview. Cell research, 19(8):929–949.
Hollingsworth, S. A. and Karplus, P. A. (2010). A fresh look
at the Ramachandran plot and the occurrence of stan-
dard structures in proteins. Biomolecular concepts,
1(3-4):271–283.
Huang, F., Oldfield, C. J., Xue, B., Hsu, W.-L., Meng,
J., Liu, X., Shen, L., Romero, P., Uversky, V. N.,
and Dunker, A. K. (2014). Improving protein order-
disorder classification using charge-hydropathy plots.
BMC bioinformatics, 15(Suppl 17):S4.
Jones, D. T. and Cozzetto, D. (2014). DISOPRED3: precise
disordered region predictions with annotated protein-
binding activity. Bioinformatics, page btu744.
Kawashima, S. and Kanehisa, M. (2000). AAindex:
amino acid index database. Nucleic acids research,
28(1):374–374.
Lafferty, J., McCallum, A., and Pereira, F. (2001). Con-
ditional random fields: Probabilistic models for seg-
menting and labeling sequence data. In Proceedings of
the 18h International Conference on Machine Learn-
ing - ICML 2001, pages 282–289.
Lieutaud, P., Canard, B., and Longhi, S. (2008). MeDor: a
metaserver for predicting protein disorder. BMC ge-
nomics, 9(Suppl 2):S25.
McGuffin, L. J., Bryson, K., and Jones, D. T. (2000). The
PSIPRED protein structure prediction server. Bioin-
formatics, 16(4):404–405.
Oates, M. E., Romero, P., Ishida, T., Ghalwash, M.,
Mizianty, M. J., Xue, B., Dosztnyi, Z., Uversky, V. N.,
Obradovic, Z., Kurgan, L., and others (2013). D2p2:
database of disordered protein predictions. Nucleic
acids research, 41(D1):D508–D516.
Peng, Z., Yan, J., Fan, X., Mizianty, M. J., Xue, B., Wang,
K., Hu, G., Uversky, V. N., and Kurgan, L. (2015).
Exceptionally abundant exceptions: comprehensive
characterization of intrinsic disorder in all domains of
life. Cellular and Molecular Life Sciences, 72(1):137–
151.
Potenza, E., Di Domenico, T., Walsh, I., and Tosatto, S. C.
(2015). MobiDB 2.0: an improved database of intrin-
sically disordered and mobile proteins. Nucleic acids
research, 43(D1):D315–D320.
Sickmeier, M., Hamilton, J. A., LeGall, T., Vacic, V.,
Cortese, M. S., Tantos, A., Szabo, B., Tompa, P.,
Chen, J., Uversky, V. N., and others (2007). DisProt:
the database of disordered proteins. Nucleic acids re-
search, 35(suppl 1):D786–D793.
BIOINFORMATICS 2017 - 8th International Conference on Bioinformatics Models, Methods and Algorithms
50

Sirota, F. L., Ooi, H.-S., Gattermayer, T., Schneider, G.,
Eisenhaber, F., and Maurer-Stroh, S. (2010). Parame-
terization of disorder predictors for large-scale appli-
cations requiring high specificity by using an extended
benchmark dataset. BMC genomics, 11(Suppl 1):S15.
Uversky, V. N. (2013). Unusual biophysics of intrinsically
disordered proteins. Biochimica et Biophysica Acta
(BBA)-Proteins and Proteomics, 1834(5):932–951.
Uversky, V. N., Oldfield, C. J., and Dunker, A. K. (2008).
Intrinsically disordered proteins in human diseases:
introducing the D2 concept. Annu. Rev. Biophys.,
37:215–246.
Vapnik, V. N. (1998). Statistical Learning Theory. Wiley-
Interscience.
Varadi, M., Vranken, W., Guharoy, M., and Tompa, P.
(2015). Computational approaches for inferring the
functions of intrinsically disordered proteins. Fron-
tiers in molecular biosciences, 2.
Venkatarajan, M. S. and Braun, W. (2001). New quantitative
descriptors of amino acids based on multidimensional
scaling of a large number of physicalchemical proper-
ties. Molecular modeling annual, 7(12):445–453.
Walsh, I., Martin, A. J., Di Domenico, T., and Tosatto, S. C.
(2012). ESpritz: accurate and fast prediction of pro-
tein disorder. Bioinformatics, 28(4):503–509.
Xue, B., Dunbrack, R. L., Williams, R. W., Dunker,
A. K., and Uversky, V. N. (2010). PONDR-FIT: a
meta-predictor of intrinsically disordered amino acids.
Biochimica et Biophysica Acta (BBA)-Proteins and
Proteomics, 1804(4):996–1010.
Zhang, T., Faraggi, E., Xue, B., Dunker, A. K., Uversky,
V. N., and Zhou, Y. (2012). SPINE-D: accurate predic-
tion of short and long disordered regions by a single
neural-network based method. Journal of Biomolecu-
lar Structure and Dynamics, 29(4):799–813.
APPENDIX
Physic-chemical Properties
Several sets of physic-chemical properties were ex-
tracted from AAindex (Kawashima and Kanehisa,
2000), by applying hierarchical and k-means cluster-
ing for identifying relevant partitions. From every
subset, a representative indice was picked up. These
features are listed in Table 3. Additionally, the proper-
ties proposed in (Venkatarajan and Braun, 2001) were
also used. They were named as AAIndex PCA 1-
5. Fine tuned hydrophobicity scales from (Campen
et al., 2008) and (Huang et al., 2014) were also added.
These features are named in this work as topIDPScale
and IDPHydropathy.
Table 3: Physic-chemical properties used from AAIndex 1.
AAindex Code Description
KYTJ820101 Hydropathy index
ZIMJ680104 Isoelectric point
WERD780101 Propensity to be buried inside
VINM940101 Normalized flexibility parameters
CHAM820101 Polarizability parameter
CHAM820102 Free energy of solution in water
CHOC760101 Residue accessible surface area
COHE430101 Partial specific volume
JOND920102 Relative mutability
FAUJ880104 Length of the side chain
CRAJ730103 Normalized frequency of turn
BURA740102 Normalized frequency structure
ROSM880103 Loss of Side chain hydropathy
GEIM800108 Aperiodic indices
RICJ880109 Relative preference value at Mid
ANDN920101 alpha-CH chemical shifts
BEGF750103 Conformational parameter of beta-turn
BUNA790103 Spin-spin coupling constants
ZIMJ680102 Bulkiness
OOBM770105 Short range non-bonded energy
YUTK870103 Unfolding Activation Gibbs energy
GUYH850101 Partition energy
BLAM930101 Alpha helix propensity
RADA880108 Mean polarity
TSAJ990102 Volumes not including cryst. waters
NAKH920105 AA composition of MEM
CEDJ970104 AA composition intracellular proteins
NISK860101 14 A contact number
BASU050102 Interactivity scale
Pseudo Amino Acid Composition Set
Amino acid composition in windows of size 15 in
the protein, enriched with pseudo amino acid counts
were used (Chou, 2001). These features were named
Amino Acids A, C, D, E, F, G, H, I, K, L, M, N, P,
Q, R, S, T, V, W, Y, and Pseudo Amino Acids 1 to 10
respectively.
Secondary Structure Features
Secondary structure prediction have a strong rela-
tion with the prediction of disorder. In fact, sev-
eral methods created initially for detecting secondary
shapes were adapted for finding IDPs. In this work
the probability output of secondary structure predic-
tor PSIPRED (McGuffin et al., 2000) was used. Al-
though the predictions from PSIPRED can be im-
proved if the input includes a multiple sequence align-
ment, such procedure was not made for avoiding any
intensive computation delay. Features from PSIPRED
were called ss helix, ss beta and ss coil.
Protein Disorder Prediction using Information Theory Measures on the Distribution of the Dihedral Torsion Angles from Ramachandran
Plots
51
