
Static and Dynamic Approaches for Pain Intensity Estimation using
Facial Expressions
Niloufar Zebarjadi and Iman Alikhani
Center for Machine Vision and Signal Analysis, University of Oulu, Oulu, Finland
Keywords:
Regression, LBP-TOP, 3D-SIFT, LBP, DSIFT, Feature Extraction, Facial Expression Analysis.
Abstract:
Self-report is the most conventional means of pain intensity assessment in clinical environments. But, it is not
an accurate metric or not even possible to measure in many circumstances, e.g. intensive care units. Continu-
ous and automatic pain level evaluation is an advantageous solution to overcome this issue. In this paper, we
aim to map facial expressions to pain intensity levels. We extract well-known static (local binary pattern(LBP)
and dense scale-invariant feature transform (DSIFT)) and dynamic (local binary patterns on three orthogonal
planes (LBP-TOP) and three dimensional scale-invariant feature transform (3D-SIFT)) facial feature descrip-
tors and employ the linear regression method to label a number between zero (no pain) to five (strong pain) to
each testing sequence. We have evaluated our methods on the publicly available UNBC-McMaster shoulder
pain expression archive database and achieved average mean square error (MSE) of 1.53 and Pearson cor-
relation coefficient (PCC) of 0.79 using leave-one-subject-out cross validation. Acquired results prove the
superiority of dynamic facial features compared to the static ones in pain intensity determination applications.
1 INTRODUCTION
Automatic recognition of a patient’s pain level is a
notable study and could have a large impact within
health care centers and clinics. For instance, consis-
tent monitoring of pain in severely ill or immature
patients reduces the workload of medical staff and
boosts the reliability of assessment. In addition, self-
reporting of pain intensity is not an objective means
of evaluation and is influenced by each patient’s per-
ception of pain (Khan et al., 2013).
A patient’s facial expressions contain information
about a subject’s well-being (e.g. sickness, stress,
fatigue), as well as pain intensity (Kaltwang et al.,
2012), and have received increasing attention during
last years. Four core facial actions representing lots
of information about pain are brow lowering, eye clo-
sure, orbital tightening and upper lip levator contrac-
tion (Lucey et al., 2012).
Machine vision and facial expression analysis
have been employed in recent years to 1) detect sub-
jects suffering from pain (Ashraf et al., 2009; Lucey
et al., 2011a; Lucey et al., 2011b; Khan et al., 2013;
Roy et al., 2016; Neshov and Manolova, 2015) and
2) assess pain intensity level (Kaltwang et al., 2012;
Rathee and Ganotra, 2015). One principal concern
in facial expression assisted pain level estimation has
been that whether a sample video should be analyzed
frame-by-frame or sequence-based. Ashraf et al. pro-
posed a pain detection technique in (Ashraf et al.,
2009) based on active appearance model (AAM). A
set of features are extracted from this model, includ-
ing similarity normalized shape representation (S-
PTS), similarity normalized appearance representa-
tion (S-APP) and canonical appearance representa-
tion (C-APP). They were mainly exploring to fig-
ure out whether the database should be labeled in a
frame-level or in a sequence-level respect. In (Lucey
et al., 2011a), S-APP, S-PTS and C-APP were utilized
in order to build an automatic pain detection system
using facial expressions. They studied the database
proposed in (Lucey et al., 2011b), in a frame-by-
frame level by analysis of action units (AUs) based on
the facial action coding system (FACS) which prop-
erly detects movements of facial muscles. In (Lucey
et al., 2012), the authors published their study on the
same database using AAM/SVM pain detection sys-
tem. The contribution of (Lucey et al., 2011b) was
the 3D head pose motion data experimentation as a
cue of pain. Later, Khan et al. in (Khan et al., 2013)
suggested a new framework for pain detection on the
same shoulder pain database. In that framework, fol-
lowing the face detection from each frame of input
sequence, face was divided into two equal parts of
Zebarjadi N. and Alikhani I.
Static and Dynamic Approaches for Pain Intensity Estimation using Facial Expressions.
DOI: 10.5220/0006141502910296
In Proceedings of the 10th International Joint Conference on Biomedical Engineering Systems and Technologies (BIOSTEC 2017), pages 291-296
ISBN: 978-989-758-213-4
Copyright
c
2017 by SCITEPRESS – Science and Technology Publications, Lda. All rights reserved
291
upper and lower regions in order to assign equal sig-
nificance to them. Then, Pyramid histogram of ori-
entation (PHOG) and pyramid local binary pattern
(PLBP) features were extracted from both regions and
concatenated to reach a final descriptor. In (Khan
et al., 2013), four different classifiers (SVM, deci-
sion tree, random forest and 2-nearest-neighbor) were
employed to detect pain from facial expressions. Re-
cently, several studies have attempted to enhance the
performance of pain detection with different classi-
fiers and descriptors (Neshov and Manolova, 2015;
Roy et al., 2016).
There are also a few studies focusing on level-
based pain intensity estimation which can propose
more information to the medical staff (e.g. for pre-
scribing appropriate drug dose). In (Kaltwang et al.,
2012), they utilized facial landmarks, discrete co-
sine transform(DCT) and LBP method to extract fea-
tures and relevance vector regression to determine
pain intensity level. Recently, in (Rathee and Gan-
otra, 2015), a new method is proposed based on the
modeling of facial feature deformations during pain
using thin plate spline. They mapped the deforma-
tion parameters to higher discriminative space by the
distance metric learning technique.
In this study, we aim to estimate the level of pain
using four widely-used static and dynamic facial ex-
pression descriptors. To have a comprehensive com-
parison within two dimensional (2D) and three di-
mensional (3D) models, local binary pattern (LBP)
and dense scale-invariant feature transform (DSIFT)
are used as two frequently-used static features, as well
as two corresponding dynamic features, including lo-
cal binary patterns on three orthogonal planes (LBP-
TOP) and three dimensional scale-invariant feature
transform (3D-SIFT). Afterwards, support vector re-
gression (SVR) is used to map the extracted features
to the pain intensity level of subjects ranging from
zero (no pain) to five (extreme pain) using leave-one-
subject-out-cross validation.
2 UNBC-McMasterSHOULDER
PAIN EXPRESSION ARCHIVE
DATABASE
UNBC-McMaster shoulder pain expression archive
database contains 200 video sequences of sponta-
neous facial expressions (48,398 frames) of 25 pa-
tients suffering from shoulder pain. In this database,
participants performed a variety of motion tests, in-
cluding abduction, flexion, internal and external rota-
tion of arms (Lucey et al., 2011b).
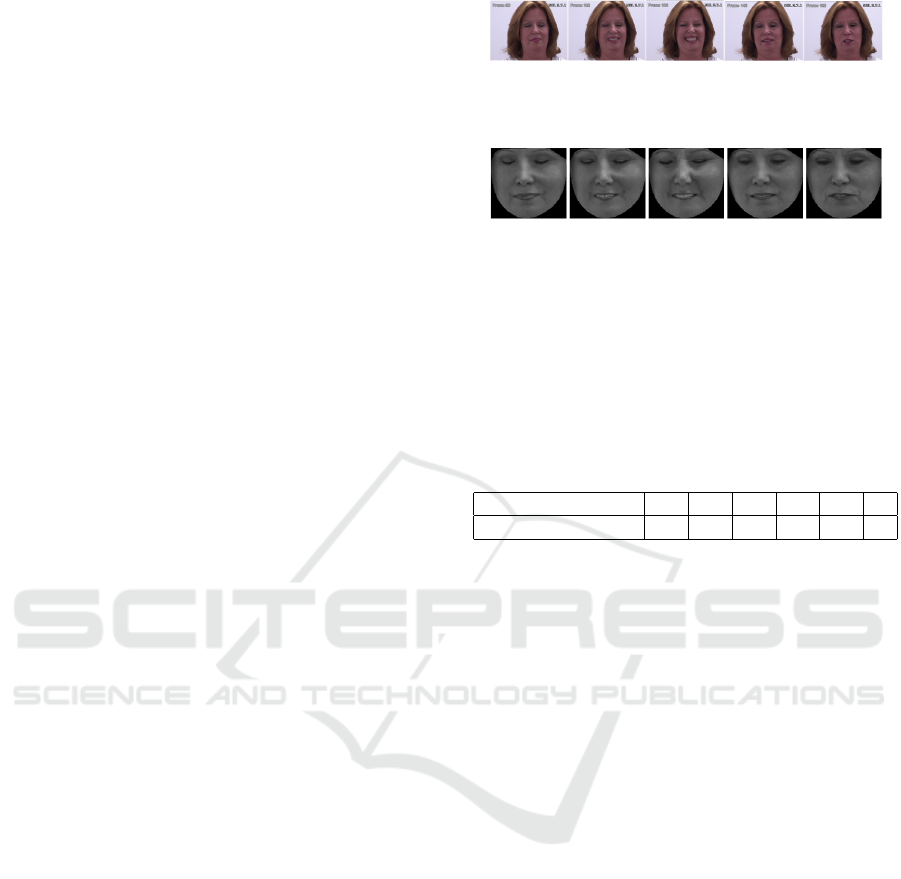
Figure 1: Example frames of a sequence from the UNBC-
McMaster shoulder pain archive database.
Figure 2: Example cropped frames of a sequence from the
UNBC-McMaster shoulder pain archive database.
Besides, there are observed pain intensity (OPI)
sequence-level rating from 0 (no pain) to 5 (extreme
pain) provided in this database which is used as the
reference value for the system. The distribution of the
sequences over OPI is provided in Table 1.
Table 1: The inventory on observed pain intensity (OPI)
measures at the sequence level.
OPI 0 1 2 3 4 5
Sequence Number 92 25 26 34 16 7
3 METHODOLOGY
In this section, we mainly explain the static and dy-
namic feature descriptors that we have extracted from
cropped faces, the regression machine and perfor-
mance measurement metrics.
3.1 Static Features
3.1.1 LBP
LBP (Ojala et al., 2002) is a robust appearance feature
descriptor. This descriptor was initially proposed for
texture analysis (Ojala et al., 1996), while recently it
has been utilized in the analysis of facial expressions
as well (Ahonen et al., 2006). To acquire LBP his-
togram of an image, the examined frame is divided
into several cells and LBP histograms are obtained for
each cell. The histograms of all cells are concatenated
as a feature vector for the entire frame (Ahonen et al.,
2004). In each cell of the image there are two vari-
ables, P and R which stands for the number of neigh-
boring points around each central pixel and the ra-
dius, respectively. To calculate the LBP of each pixel,
the central pixel value is compared to the neighbor-
ing pixels and the greater neighboring values than the
central one are assigned as ”1”, otherwise ”0”. This
leads to an 8-digit binary number which is converted
HEALTHINF 2017 - 10th International Conference on Health Informatics
292
to decimal (Ahonen et al., 2004). We consider P as
eight neighboring pixels and R as two and three pixels
through our analysis. Additionally, each sequence is
divided into a different number of cells along x- and
y-axis, ranging from six to ten and along time-axis,
ranging from four to six parts.
3.1.2 DSIFT
DSIFT is a robust and popular feature in image pro-
cessing. SIFT describes local features in a frame by
extracting discriminative key-points and computing
a histogram of orientation for every single of them.
SIFT key points are invariant to viewpoint changes
that induce translation, rotation, and re-scaling of the
image (Lowe, 2004). DSIFT extracts a densely sam-
pled SIFT feature from image which can be adjusted
by sampling step, sampling bounds, size and descrip-
tor geometry. Key-points are sampled in the sense
that the center of spatial bins is at integer coordinates
within the image boundaries (Vedaldi and Fulkerson,
2010). The main advantage of DSIFT compared to
SIFT is its computational efficiency. In order to em-
ploy DSIFT in a video sequence, we divide the video
sequence into a few number of segments and calcu-
late the DSIFT for each frame in each segment. In
the following step, the feature values of all frames
are averaged within each segment and then concate-
nated together. By this approach, the dimension of fi-
nal feature vector is reduced significantly. So, in this
descriptor also x-, y- and time axis grid-size should
be tuned.
3.2 Dynamic Features
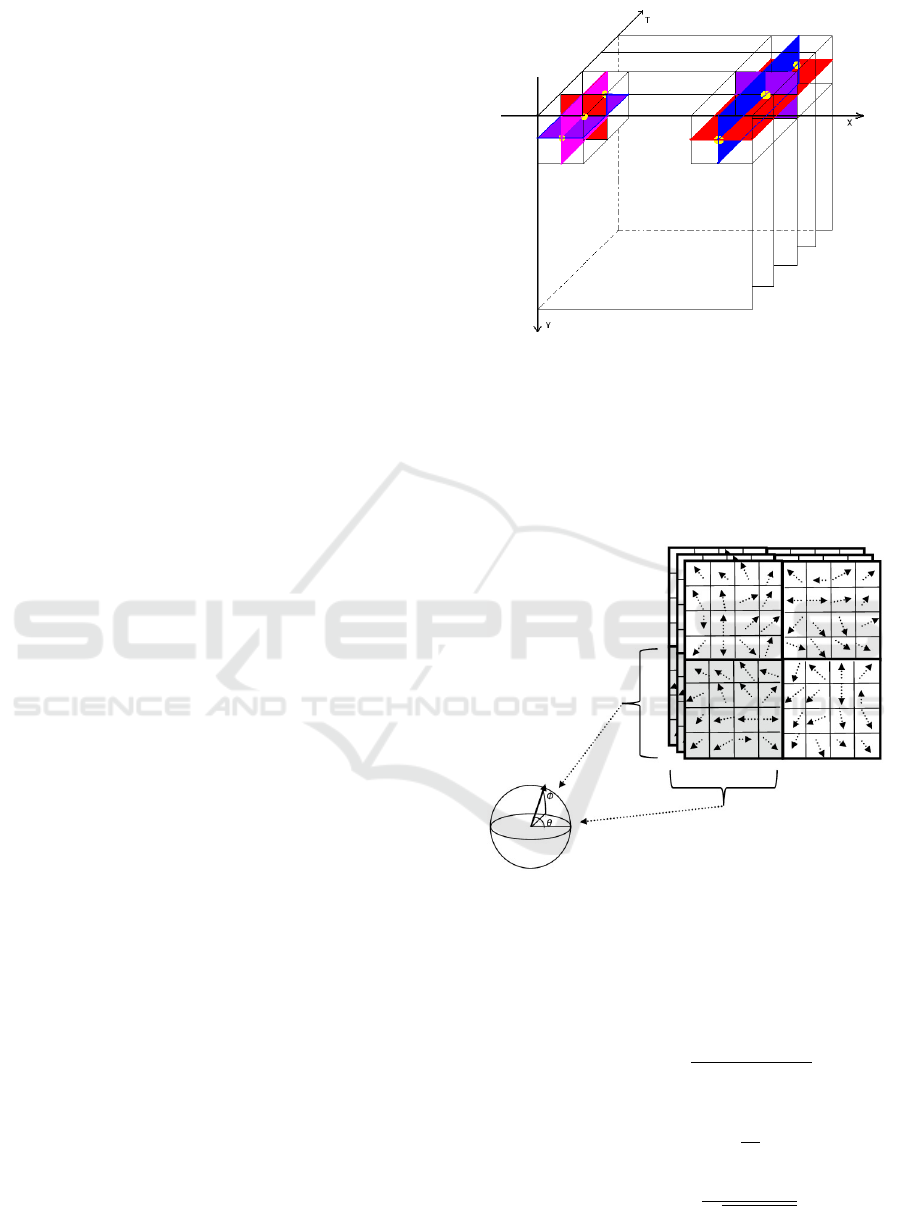
3.2.1 LBP-TOP
LBP-TOP is basically local binary patterns on three
XY, XT and YT orthogonal planes (Zhao and
Pietikainen, 2007). It is a dynamic texture descrip-
tor using LBP in order to extract spatio-temporal fea-
tures. To obtain LBP-TOP histogram of a video, a
sequence is divided into non-overlapping block vol-
umes separately and the LBP-TOP histograms in each
block volume are computed and then concatenated
into a single histogram (Zhao and Pietikainen, 2007).
The number of divisions in row and column of XY
plane and in time as well as radius around each cen-
tral pixel are considered as important parameters of
this method.
3.2.2 3D-SIFT
3D-SIFT (Scovanner et al., 2007) technique expands
DSIFT descriptor from 2D to 3D by encoding the in-
Figure 3: Computation of the LBP-TOP using non-
overlapping block volumes (Zhao and Pietikainen, 2007).
formation in both space and time. In this method, a
video sequence is divided into rectangular cubes and
direction of gradient in each 3D sub-volume is indi-
cated by two angular values (θ, φ).
Figure 4: Computation of the 3D SIFT using two angular
values (θ, φ) (Krig, 2014).
Therefore, a single gradient magnitude and two
orientation vectors provided in equations 1, 2 and 3
describe each point’s characteristics.
m3D(x, y, t) =
q
L
x
2
+ L
y
2
+ L
t
2
, (1)
θ(x, y, t) = tan
−1
L
x
L
y
, (2)
φ(x, y, t) = tan
−1
(
L
t
q
L
x
2
+ L
y
2
), (3)
Static and Dynamic Approaches for Pain Intensity Estimation using Facial Expressions
293

3.3 Performance Measurement
The construction of feature vectors is followed by lin-
ear regression using SVR machine (Chang and Lin,
2011). The systems are trained using predefined
OPI labels corresponding to each sequence pain level,
ranging from zero (no pain) to five (extreme pain).
We have considered leave-one-subject-out cross val-
idation technique and thus, the system is iteratively
trained using all except one subject’s data and is
tested on the excluded sample subject’s data. The
performance is then computed by mean squared er-
ror (MSE) and Pearson correlation coefficient(PCC),
which are given in the following equations:
MSE(X, Y) =
1
n
n
∑
i=1
(Y − X)
2
, (4)
PCC(X, Y) =
1
n − 1
n
∑
i=1
(
X
i
− µ
X
σ
X
)(
Y
i
− µ
Y
σ
Y
), (5)
where X and Y are the true OPI labels and estimated
pain intensity level, respectively. n is the number of
sequences, µ and σ correspond to the mean and stan-
dard deviation of their subscript vectors.
4 EXPERIMENTAL RESULTS
In this section, the results of proposed approaches are
provided. Parameter adjustment should be conducted
for all feature descriptors. Reasonably wide range of
parameters are experimented to find efficient values
for feature block sizes and SVR parameters. MSE
and PCC of some tested parameters for all descrip-
tors are depicted in Figures 5 and 6, respectively. The
minimum MSE and maximum PCC are marked by
triangles in each sub-figure.
Table 2 represents the best MSE and PCC re-
sults of all static and dynamic descriptors on UNBC-
McMaster shoulder pain expression archive database.
Best parameters of the features are provided as sub-
scripts in this table. Parameters for both LBP and
LBP-TOP are number of neighboring points around
each central pixel (P), radius around each central
pixel (R), number of divisions in row, in column and
in time, respectively. In 2D and 3D-SIFT, parameters
are the size of the extracted descriptor, number of bins
along x axis, y axis and time divisions.
According to Figure 5 and the first four rows
of Table 2, with respect to obtained MSE values,
LBP − TOP
8,2,8,6,6
outperforms other models by 0.21
unit compared to the second best model. This result
is in agreement with the acquired performance in the
Table 2: The best performance of all methods on UNBC-
McMaster shoulder pain expression archive database. Sub-
scripts are the parameters of each descriptor explained in
section 4.
Feature descriptors MSE PCC
LBP
8,2,8,7,5
1.81 0.76
DSIFT
8,4,4,6
2.33 0.45
LBP − T OP
8,2,8,6,6
1.53 0.74
3DSIFT
8,3,3,10
1.74 0.61
LBP
8,2,10,7,5
2.12 0.77
DSIFT
8,4,4,10
2.40 0.48
LBP − T OP
8,2,10,7,5
1.70 0.79
3D − SIFT
8,4,4,10
1.80 0.64
case of PCC measure for LBP-TOP model. How-
ever, optimal parameters of LBP-TOP model based
on these two metrics are not the same.
From the least MSE point of view, dynamic fea-
tures, including LBP-TOP and 3D-SIFT surpass the
static feature descriptors, including LBP and DSIFT.
Nevertheless, considering acquired PCC values, LBP
family leads to superior outcome compared to the
SIFT family.
Interestingly, with respect to either of the met-
rics, temporal feature descriptors in either of the fea-
ture families outperform the static feature descrip-
tors of the same family. The reason is that, there is
useful temporal information present in the sequences
which boosts the performance of regression machine
and this information might not be used by employing
static feature descriptors. Although our obtained re-
sults are limited to UNBC-McMaster shoulder pain
expression archive database, they are in agreement
with (Zhao and Pietikainen, 2007; Scovanner et al.,
2007) in this context.
Comparing 3D descriptor performances attained
in our experiments, by either of the metrics, LBP-
TOP gives superior results than 3D-SIFT. The same
statement can be proposed for the corresponding 2D
descriptors. This outcome shows the advantage of
LBP family on the facial expression assisted pain in-
tensity estimation applications and is correlated with
the results obtained in many papers contributed in fa-
cial expression applications such as (Kaltwang et al.,
2012).
5 CONCLUSION
Self-reported pain intensity level is not a reliable and
always possible means of pain evaluation. Estima-
tion of a patient’s pain intensity using alternative so-
lutions such as facial expression analysis is a func-
tional and reliable indicator and this information can
HEALTHINF 2017 - 10th International Conference on Health Informatics
294
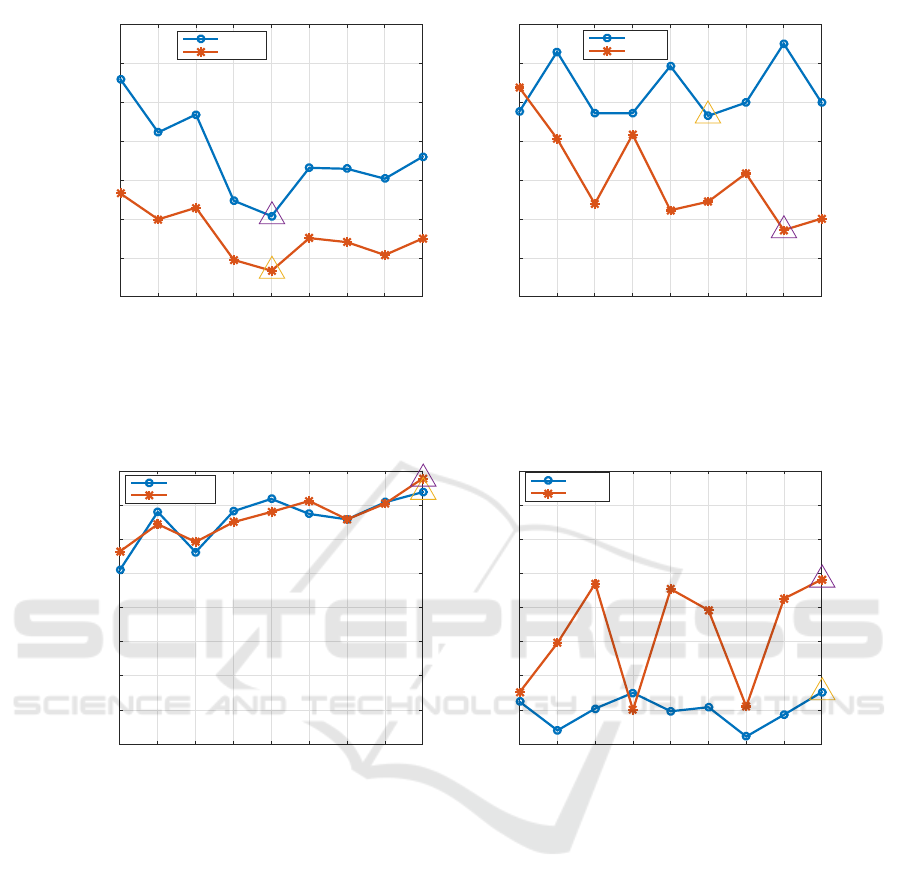
6x6x5 7x7x4 7x9x6 8x6x4 8x7x5* 8x10x6 9x6x4 9x9x6 10x7x5
MSE
1.4
1.6
1.8
2
2.2
2.4
2.6
2.8
LBP Family Descriptors
LBP
LBP-TOP
2x2x4 3x3x4 4x4x4 2x2x6 3x3x6 4x4x6 2x2x10 3x3x10 4x4x10
MSE
1.4
1.6
1.8
2
2.2
2.4
2.6
2.8
SIFT Family Descriptors
DSIFT
3D-SIFT
Figure 5: Acquired MSE over a different number of blocks. For each feature extraction technique(LBP, SIFT, LBP-TOP,
3D-SIFT), the minimum MSE is highlighted by a triangle. The x-axis tick labels are corresponding to row divisions (number
of bins in x-axis) × column divisions (number of bins in y-axis)× time divisions regarding to LBP (DSIFT) and LBP-TOP
(3D-SIFT). In the x-axis of left sub-figure, * corresponded to 8x6x6 for LBP-TOP and 8x7x5 for LBP.
6x6x5 7x7x4 7x9x6 8x6x4 8x7x5 8x10x6 9x6x4 9x9x6 10x7x5
PCC
0.4
0.45
0.5
0.55
0.6
0.65
0.7
0.75
0.8
LBP Family Descriptors
LBP
LBP-TOP
2x2x4 3x3x4 4x4x4 2x2x6 3x3x6 4x4x6 2x2x10 3x3x10 4x4x10
PCC
0.4
0.45
0.5
0.55
0.6
0.65
0.7
0.75
0.8
SIFT Family Descriptors
DSIFT
3D-SIFT
Figure 6: PCC over a different number of blocks. For each feature extraction technique(LBP, DSIFT, LBP-TOP, 3D-SIFT),
the maximum PCC is accentuated by triangle. The x-axis labels are corresponding to row division (number of bins in x-axis)
× column division (number of bins in y-axis)× time division with respect to LBP (DSIFT) and LBP-TOP (3D-SIFT).
be used for many clinical applications, e.g. drug dose
management and monitoring. This solution is par-
ticularly advantageous for those patients who are not
able to communicate reliably, including severely ill
elder patients or immature patients. In this study, we
employed four different feature sets, containing two
static (LBP and DSIFT) and two dynamic descriptors
(LBP-TOP and 3D-SIFT) in the application of pain
intensity estimation from facial expressions. We have
evaluated our models on the UNBC-McMaster shoul-
der pain expression archive database using SVR ma-
chine. Our experimental results underline the supe-
rior performance of dynamic models compared to the
static ones. In addition, LBP family offers more de-
scriptive information of facial expressions than SIFT
family descriptors. LBP-TOP provides the most ac-
curate results of regression by 1.53 and 0.79 as MSE
and PCC values, respectively.
REFERENCES
Ahonen, T., Hadid, A., and Pietik
¨
ainen, M. (2004). Face
recognition with local binary patterns. In Computer
vision-eccv 2004, pages 469–481. Springer.
Ahonen, T., Hadid, A., and Pietikainen, M. (2006). Face
description with local binary patterns: Application to
face recognition. Pattern Analysis and Machine Intel-
ligence, IEEE Transactions on, 28(12):2037–2041.
Ashraf, A. B., Lucey, S., Cohn, J. F., Chen, T., Ambadar,
Z., Prkachin, K. M., and Solomon, P. E. (2009). The
painful face–pain expression recognition using active
appearance models. Image and vision computing,
27(12):1788–1796.
Chang, C.-C. and Lin, C.-J. (2011). Libsvm: a library for
Static and Dynamic Approaches for Pain Intensity Estimation using Facial Expressions
295

support vector machines. ACM Transactions on Intel-
ligent Systems and Technology (TIST), 2(3):27.
Kaltwang, S., Rudovic, O., and Pantic, M. (2012). Con-
tinuous pain intensity estimation from facial expres-
sions. In Advances in Visual Computing, pages 368–
377. Springer.
Khan, R. A., Meyer, A., Konik, H., and Bouakaz, S. (2013).
Pain detection through shape and appearance features.
In Multimedia and Expo (ICME), 2013 IEEE Interna-
tional Conference on, pages 1–6. IEEE.
Krig, S. (2014). Computer Vision Metrics: Survey, Taxon-
omy, and Analysis. Apress.
Lowe, D. G. (2004). Distinctive image features from scale-
invariant keypoints. International journal of computer
vision, 60(2):91–110.
Lucey, P., Cohn, J. F., Matthews, I., Lucey, S., Sridharan,
S., Howlett, J., and Prkachin, K. M. (2011a). Auto-
matically detecting pain in video through facial action
units. IEEE Transactions on Systems, Man, and Cy-
bernetics, Part B (Cybernetics), 41(3):664–674.
Lucey, P., Cohn, J. F., Prkachin, K. M., Solomon, P. E.,
Chew, S., and Matthews, I. (2012). Painful moni-
toring: Automatic pain monitoring using the unbc-
mcmaster shoulder pain expression archive database.
Image and Vision Computing, 30(3):197–205.
Lucey, P., Cohn, J. F., Prkachin, K. M., Solomon, P. E.,
and Matthews, I. (2011b). Painful data: The unbc-
mcmaster shoulder pain expression archive database.
In Automatic Face & Gesture Recognition and Work-
shops (FG 2011), 2011 IEEE International Confer-
ence on, pages 57–64. IEEE.
Neshov, N. and Manolova, A. (2015). Pain detection
from facial characteristics using supervised descent
method. In Intelligent Data Acquisition and Ad-
vanced Computing Systems: Technology and Appli-
cations (IDAACS), 2015 IEEE 8th International Con-
ference on, volume 1, pages 251–256. IEEE.
Ojala, T., Pietik
¨
ainen, M., and Harwood, D. (1996). A com-
parative study of texture measures with classification
based on featured distributions. Pattern recognition,
29(1):51–59.
Ojala, T., Pietik
¨
ainen, M., and M
¨
aenp
¨
a
¨
a, T. (2002). Mul-
tiresolution gray-scale and rotation invariant texture
classification with local binary patterns. Pattern Anal-
ysis and Machine Intelligence, IEEE Transactions on,
24(7):971–987.
Rathee, N. and Ganotra, D. (2015). A novel approach for
pain intensity detection based on facial feature defor-
mations. Journal of Visual Communication and Image
Representation, 33:247–254.
Roy, S. D., Bhowmik, M. K., Saha, P., and Ghosh, A. K.
(2016). An approach for automatic pain detection
through facial expression. Procedia Computer Sci-
ence, 84:99–106.
Scovanner, P., Ali, S., and Shah, M. (2007). A 3-
dimensional sift descriptor and its application to ac-
tion recognition. In Proceedings of the 15th inter-
national conference on Multimedia, pages 357–360.
ACM.
Vedaldi, A. and Fulkerson, B. (2010). Vlfeat: An open
and portable library of computer vision algorithms.
In Proceedings of the 18th ACM international confer-
ence on Multimedia, pages 1469–1472. ACM.
Zhao, G. and Pietikainen, M. (2007). Dynamic texture
recognition using local binary patterns with an appli-
cation to facial expressions. Pattern Analysis and Ma-
chine Intelligence, IEEE Transactions on, 29(6):915–
928.
HEALTHINF 2017 - 10th International Conference on Health Informatics
296
