
Comparison of Network Topologies by Simulation of Advertising
Imre Varga
Department of Informatics Systems and Networks, University of Debrecen,
Kassai str. 26, H-4028 Debrecen, Hungary
Keywords:
Network Topology, Information Spreading, Clustered Systems, Effectiveness of Advertising.
Abstract:
Information spreading processes and advertising strategies are often studied by different epidemic models on a
given topology. The goal ofthis paper isto discover and summarize the effect of underlying network topologies
on a general spreading process. A complex set of different networks is studied by computer simulations from
regular networks through random networks to different scale-free network topologies. The speed of spreading
and the micro-scale features of these systems highlight the differences caused by different network topologies.
This may help to plan for example advertising strategies on different social networks.
1 INTRODUCTION
In the last years, the intensively growing network
science showed that our natural, technical and so-
cial environment is full of different kind of networks
(Newman, 2010). One can observe and study a
large amount of spreading processes over these net-
works such as disease spreading (Shirley and Rush-
ton, 2005; Eames, 2007), rumor and gossip spreading
(Domenico et al., 2013; Lind et al., 2013), diffusion
of innovations (Rogers, 2003; Kun et al., 2007) or
spreading on technological networks (Pastor-Satorras
and Vespignani, 2001; Karsai et al., 2011; Buzna
et al., 2006). All of them are important from eco-
nomic, social and scientific point of view. However,
this field is intensively studied nowadays new scien-
tific results unfold new questions.
The goal of this paper is to perform an overall
study of the effect of the network topology on a gen-
eral information spreading process. In the literature,
one can find studies of topology comparison related
to technological or biological processes. They mainly
based on either SIS or SIR or SIRS spreading mod-
els (Wang et al., 2003; Ganesh et al., 2005; Pastor-
Satorras et al., 2015) and various sets of network
structures from regular to complex ones. However,
the clustered scale-free networks, which are very re-
alistic from the social point of view, are still undis-
covered. Moreover, the most of the published works
can handle only one information channel. Our ap-
plied model can describe state change either purely
driven by an outer field (as in the case of percolation)
or spreading based on only personal contacts (such
as disease spreading) or spreading where the previous
two channels compete (advertising and human com-
munication) similar to (Kocsis and Kun, 2011). In the
latter case, new nuclei of spreading appear continu-
ously in time and then start to growmaking the system
more complex. The analyzed networks are selected
from different network classes. The far aim is to be
able to predict somehow effectiveness of advertising
based on the information spreading results. Whether
it is worth to spend more money on advertising or the
interpersonal communication is enough to speed up
the awareness about a product? If the advertising ef-
fort is constant, can a service be well known soon by
a clustered society? Does the degree distribution of
the society have an effect to the number of informed
people during a time-limited campaign? If the contact
pattern in the public is given, what can we expectfrom
our advertising strategy? When the news reached the
half of the society, are the informed and uninformed
individuals forming large segregated clusters or the
society becomes a steady mixture of them? It is very
difficult to answer these questions. Thus first we have
to know the details of simple spreading processes.
In Sec. 2 a detailed description of the different
studied static network topologies is presented. It is
followed by the introduction of the applied spreading
model and the simulation technique in Sec. 3. The
particular results can be found in Sec. 4. Based on
these ones can understand how the topology changes
the features of the spreading process. Then the work
is closed by conclusions and consequences in Sec. 5.
Varga, I.
Comparison of Network Topologies by Simulation of Advertising.
DOI: 10.5220/0006142100170022
In Proceedings of the 2nd International Conference on Complexity, Future Information Systems and Risk (COMPLEXIS 2017), pages 17-22
ISBN: 978-989-758-244-8
Copyright © 2017 by SCITEPRESS – Science and Technology Publications, Lda. All rights reserved
17

2 UNDERLYING NETWORK
TOPOLOGIES
During the information spreading simulations, several
different undirected network topologies were studied
from different classes of networks from regular lat-
tices to scale-free networks. All the networks contain
N = 10
6
nodes, the average number of neighbors is
hki = 6, so the densities of the networks are the same
keeping them comparable. Nevertheless, the micro-
scale topologies differ completely. The following net-
works are studied.
• Network A: regular 2D triangular network.
Nodes are on a plain according to the vertices
of a triangular/hexagonal lattice periodically, so
there are no borders of the lattice. In this way
all vertices are connected by the same amount of
edges. The degree distribution can be described
by a Kronecker-delta (P(k) = δ
6k
). The average
shortest path length hLi covers hundreds of con-
nections (large network diameter) and the average
clustering coefficient hCi is high in this regular
structure. (Exact values for this and for the up-
coming networks can be found in Table 1.)
• Network B: regular spatial (3D) primitive cubic
network. The unit cell of the structure is a cube.
In order to ensure the equality of all nodes, the
system is periodic avoiding the side effects of the
finite size. The degree distribution can be given
in the same way as in the previous case, but due
to the 3D structure the characteristic path length
is smaller than in network A. In this lattice none
of the neighbors of any node are connected to
other neighbors, so the clustering coefficients of
all nodes are exactly 0.
• Network C: random network. N nodes are
connected by 3N links choosing the connected
nodes randomly, avoiding self-loops and dupli-
cated links. If the final system contains discon-
nected nodes or small separate clusters only the
giant component is studied ensuring contiguous
system. These networks have small-world prop-
erty so their characteristic path length is tiny com-
pared to the system size. The connection trian-
gles are very rare in these random graphs so the
clustering coefficient is almost zero. (Erd˝os and
R´enyi, 1959; Watts and Strogatz, 1998)
• Network D: rewired ’small-world’ network.
Starting from a regular ring lattice, where each
node is connected to its 6 nearest neighbors. We
apply a rewiring process. Links are chosen by
β probability to be rewired, so a chosen link is
removed and two new nodes are connected by a
new link chosen by equal probability (avoiding
self-loops and duplicated links). In the studied
rewired network β = 0.1 is used to ensure small-
world property with high clustering. (Watts and
Strogatz, 1998)
• Network E: scale-free network of the Barab´asi-
Albert model. Using preferential attachment in
the linking method the result is a network with de-
gree distribution obeying power-law function with
exponent γ = 3. In the case of our system size, the
distances between nodes and the clustering coef-
ficient are both quite small. (Barab´asi and Albert,
1999; Albert and Barab´asi, 2002)
• Network F: Clustered scale-free network. While
scale-free networks are so frequent in our envi-
ronment simple BA networks cannot capture the
clustered structure of for example the human in-
teractions. The ‘friend of my friend is my friend’
effect can be captured by the method published
in (Varga, 2015). Here the linking method of a
growing network consists not just the preferential
attachment but triplet formation steps as well. The
result is a scale-free network (with the same de-
gree distribution exponent as BA networks) with
high clustering in the case of large systems.
Table 1: Summery of the average shortest path length hLi
and the average clustering coefficient hCi of the studied net-
work topologies in case of N = 10
6
and hki = 6.
hLi hCi
network A 397.0 0.400000
network B 74.4 0.000000
network C 7.9 0.000007
network D 13.1 0.448380
network E 5.9 0.000011
network F 7.9 0.617884
The chosen networks belong to different network
classes summarizing as follows. Network A and net-
work B are regular networks, while others have small-
world property. Only network E and network F are
scale-free networks. Network A, network D and net-
work F are clustered systems, only they have high
clustering coefficient. (See Table 1.)
3 INFORMATION SPREADING
SIMULATIONS
Discrete-time agent-based simulations are carried out
on the underlying networks described in Sec. 2. Here
nodes represent the agents, while links mean personal
connections between them. Each agent has 2 distinct
states denoted by A
i
(t):
COMPLEXIS 2017 - 2nd International Conference on Complexity, Future Information Systems and Risk
18

• A
i
= 0: uninformed state, no awareness, no opin-
ion
• A
i
= 1: informed state, agent has awareness of
something or has (positive or negative) opinion
During the simulated time evolution of the system
two information channels have influenceon the agents
(Kocsis and Kun, 2011):
• Vertical channel: mass media, advertisement
• Horizontal channel: word-of-mouth, interper-
sonal communication
The dynamics of the system are described by an SI
(Susceptible-Infected)epidemic model, where in each
time step each agent can remain in its previousstate or
an uninformed agent can became informed. There is
no way of an informed agent to forgetinformation and
get back to the uninformed state. The state-change
probability of uninformed agent i to become informed
state can be given as
P
i
(p, q) = 1−exp
−q
p
∑
j
A
j
N
n
i
+ (1− p)(1− A
i
)
,
(1)
where p and q are the parameters of the model, j
runs over the neighbors of agent i and N
n
i
is the num-
ber of neighboring agents of agent i. The value of
p gives the probability of spreading P
s
(interpersonal
communication), while the probability of nucleation
is P
n
= 1− p (the effect of the advertisement, the birth
of pioneers). This parameter has two special values.
If p = 0, we can get pure percolation without spread-
ing. By p = 1 we can exclude the influence of mass
media. Parameter q is just a strength factor, so larger q
leads to faster time evolution (less time to reach satu-
ration). The term p
∑
j
A
j
/N
n
i
describes the spreading.
It expresses that one can have higher chance to hear a
given information about an advertised product or ser-
vice from his/her friends if most of them are already
informed. In this way not the number of informed
friends are important, but the ratio of them in con-
trast to the model of (Kocsis and Kun, 2011). This is
a very important difference, but not the only one. In
our model only one parameter (p) is enough to handle
both channels, because it was found that the ratio of
the sensitivity of the two channels is relevant.
Our system can be also applied to model spreading
of innovations, where the benefit of changing a device
to a higher level one is significant, if it is compatible
with most of the friends’ devices. This term can de-
scribe a kind of opinion formation method as well.
One can judge something or form an opinion about
something if he/she knows more points of view (in-
dependently of the nature of friends’ opinions). Our
opinion, which can be imagined as a special kind of
information, can also be based on outer information
sources (advertising, mass-media). Its probability is
described by the term (1− p)(1− A
i
) in Eq. 1. In in-
novation spreading context this is the motivation of
individuals to be a pioneer user or an early buyer.
The exponential function is necessary just to get a
monotonicfunction between 0 and 1 (Kocsis and Kun,
2011). At the initial state all agents are in the un-
informed state, then we can follow the time evolution
of the system {A
i
(t)}
i=1,...,N
by computer simulations.
Spreading is in the focus of the recent research, so
p > 0.1 cases are analyzed. The runs were stopped
when saturation was reached. In the following anal-
ysis, tens of independent runs were averaged. Due to
this and the large size of the networks (N = 10
6
) ran-
dom effects and statistical noise are eliminated. The
simulation software is developed by the author.
4 SIMULATION RESULTS
4.1 Macro-scale Behavior
After the initial state due to the nucleation a few
agents become informed continuously. Then commu-
nication become more and more dominant as infor-
mation spreads from neighbor to neighbor. While the
state change is irreversible sooner or later every agent
will be informed. This process can be characterized
by the average number of informed agents
hAi(t) =
∑
N
i=1
A
i
(t)
N
. (2)
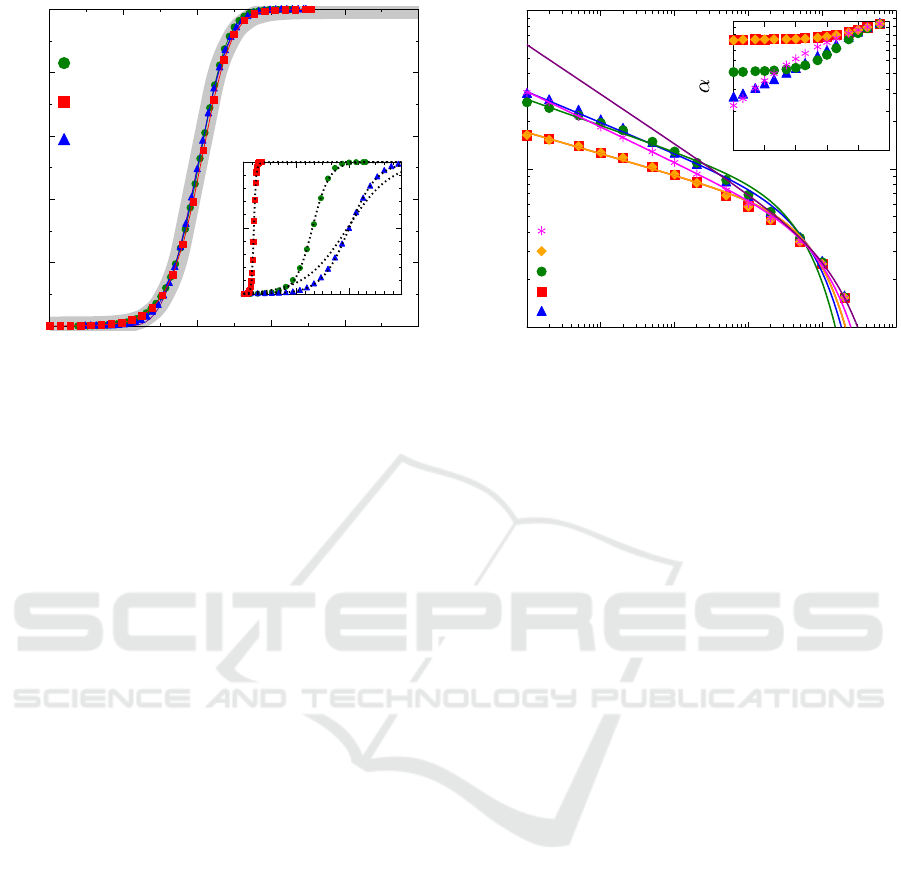
The time evolution of the system can be described
by hAi(t) which shows saturation following the func-
tional form
hAi(t) = (1− e
−qt
)
1
1+ e
−α(t−t
i
)
, (3)
where the first factor illustrates percolation due to nu-
cleation, while the second factor is a logistic function
representing spreading. In Eq. 3 t
i
indicates the loca-
tion of the inflection point of logistic function and α
is the slope of tangential of the curve at the inflection
point. These values characterize the spreading pro-
cess. The shape of hAi(t) curve is always the same.
When spreading is dominant the first factor is negli-
gible in Eq. 3, so independently of the network topol-
ogy and the given values of the parameters p and q
one can get logistic function form. Rescaling time
axis by t
′
= α(t − t
i
) all the curves fall to the same
curve getting data collapse. It is illustrated in Fig. 1.
The speed of the spreading is measured by
the change of average number of informed agents
Comparison of Network Topologies by Simulation of Advertising
19
0.0
0.2
0.4
0.6
0.8
1.0
-10 -5 0 5 10 15
♣
♣
♣
♣
♣
♣
♣
♣
♣
♣
♣
♣
♣
♣
♣
♣
♣
♣
♣
♣
♣
♣
♣
♣
♣
♣
♣
♣
♣
♣
♣
♣
♣
♣
♣
♣
♣
♣
♣
network A
1-p=10
-4
, q=0.1
network D
1-p=10
-4
, q=0.1
network E
1-p=10
-4
, q=0.3
network F
1-p=10
-5
, q=0.1
0.0
0.5
1.0
0 150 300 450
♣
♣
♣
♣
♣
♣
♣
♣
♣
♣
♣
♣
♣
♣
♣
♣
♣
♣
♣
hAi
t
′
= α(t − t
i
)
hAi
t
Figure 1: (Color online.) The time evolution of four sys-
tems with different underlying network topology and dif-
ferent values of parameters p and q. The average level of
informed agent as a function of time hAi(t) is shown in the
inset (dashed curves are fitted by logistic form). Rescaled
time leads to data collapse as demonstrated on the main
panel. The gray track indicate the general logistic function.
∆hAi (t) = α/4, which is the derivative of hAi(t) with
a maximum at the inflection point t
i
. In this way, α
and t
i
determine the spreading process. It is impor-
tant to know how these values depend on the network
topology and on the parameters p and q. Large num-
ber of simulations have been carried out in a board pa-
rameter range to discover the parameter space. While
q is just a kind of strength factor, its role proved to
be simple. The location of the inflection point is in-
versely proportional to q, while the top speed of the
spreading is directly proportional to this parameter, so
t
i
∝ q
−1
and α ∝ q independently of the topology.
The effect of parameter p is not so simple. Sim-
ulation results show that the place of the inflection
point as a function of parameter p can be fitted by a
power-law function with exponential cut-off follow-
ing the form
t
i
= ax
−b
exp(−x/c), (4)
where coefficients a, b and c depend on the network
topology, but the function form is independent. (See
the main panel of Fig. 2.) The top speed of spreading
characterized by α behaves in different way tuning
the dominance of vertical information channel so the
advertising effort. In case of differentnetwork topolo-
gies the shape of α(p) is completely different. If the
topology of human interaction is similar to a simple
random network (topology C) or rewired WS topol-
ogy (network D) or scale-free BA network (topology
E) then there is a range where advertising does not
increase the slope of hAi(t) resulting in constant α.
Meanwhile in the case of regular (network topology A
10
10
2
10
3
t
i
110
-1
10
-2
10
-3
10
-4
10
-5
1-p
♣
♣
♣
♣
♣
♣
♣
♣
♣
♣
♣
♣
♣
♣
♣
network A
network B
network C
network D
network E
network F
10
-2
10
-1
110
-1
10
-2
10
-3
10
-4
10
-5
1-p
♣
♣
♣
♣
♣
♣
♣
♣
♣
♣
♣
♣
♣
Figure 2: The maximum of spreading speed appears ear-
lier (smaller t
i
), if mass-media is definitely present (large
p) not just the personal interactions. The simulation results
are fitted by Eq. 4. Inset: The maximal slope of the logistic
function of average number of informed agent hAi in the in-
fection point is monotonically increasing by increasing the
weight of advertising, but the underlying network topology
has a very strong influence to the shape of the curves as one
can see.
and B) and clustered scale-free networks (topology F)
stronger mass-media results in more informed agents
within a given time interval. (See the inset of Fig. 2.)
4.2 Micro-scale Behavior
The average number of informed agents is a macro-
scopic feature of the system, but does not tell any-
thing about the spreading process in a micro-scale. In
this model the vertical information channel creates in-
formed agent as a kind of nucleus, while the horizon-
tal channel leads to the growing of this small clus-
ter of informed agent(s). So at the beginning of the
time evolution more and more small clusters appear
step-by-step, then the neighboring uninformed agents
get a chance to become informed due to the spreading
process, so the separate clusters start to grow. In this
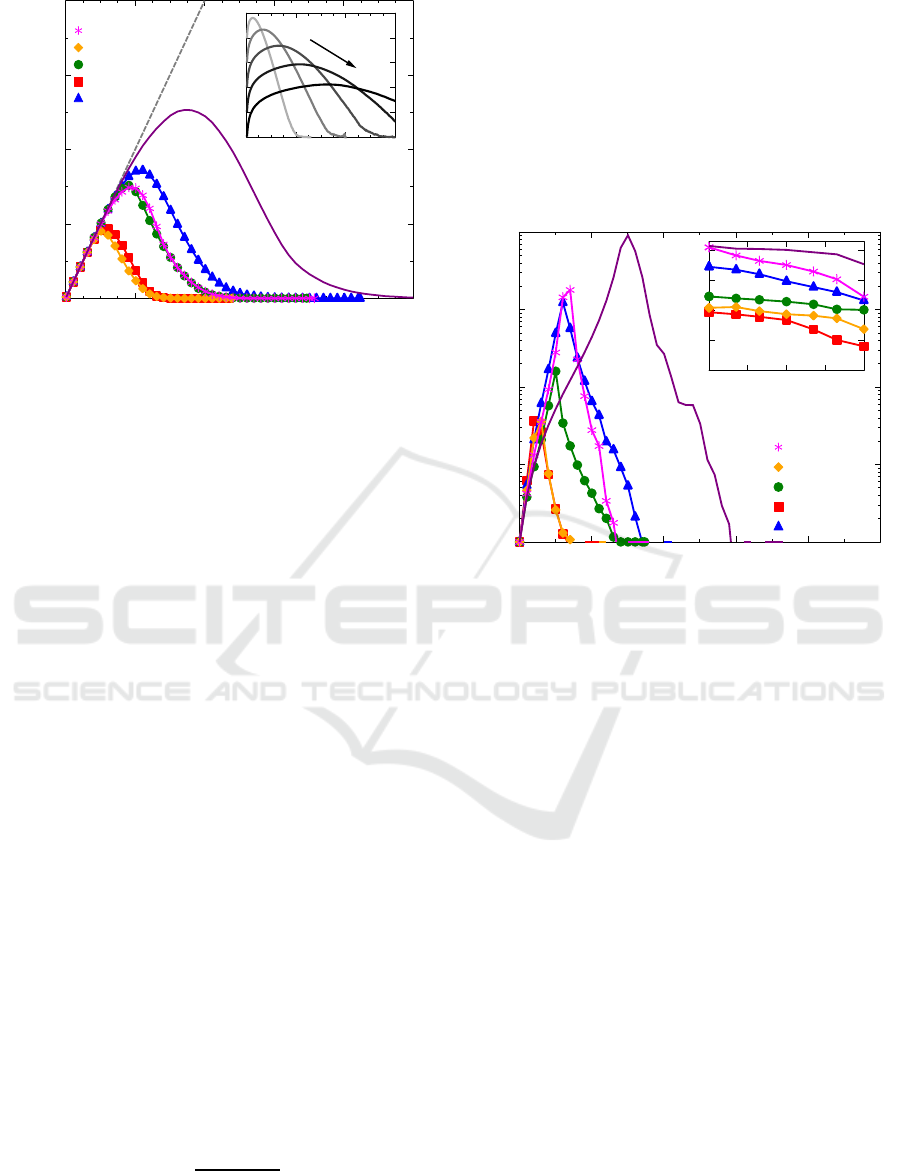
phase the number of clusters N
c
is equal to the number
of nuclei which is determined by parameters p and q,
but does not influenced by the network topology be-
cause initial time evolution is similar to percolation.
Thus the number of informed clusters N
c
as a func-
tion of time increases linearly with a slope depending
only on the parameters p and q. It is shown in the
main panel of Fig. 3, where the N
c
(t) curves start with
the same linear section indicated by the gray dashed
line.
Meanwhile newer nuclei appear again and the
small clusters grow continuously the distance of clus-
COMPLEXIS 2017 - 2nd International Conference on Complexity, Future Information Systems and Risk
20
0
500
1000
1500
2000
N
c
0 100 200 300 400 500
t
♣
♣
♣
♣
♣
♣
♣
♣
♣
♣
♣
♣
♣
♣
♣
♣
♣
♣
♣
♣
♣
♣
♣
♣
♣
♣
♣
♣
♣
♣
♣
♣
♣
♣
♣
♣
♣
♣
♣
♣
♣
♣
♣
♣
♣
♣
♣
♣
♣
♣
♣
network A
network B
network C
network D
network E
network F
1
10
10
2
10
3
10
4
10
5
N
c
0 100 200 300
t
p
Figure 3: The number of clusters N
c
built from informed
agents as a function of time. First all networks behave in the
same way illustrated by the gray dashed line (its slope de-
pends on parameter q), then the system reaches a topology
dependent maximum of the number of clusters. Here the
decreasing curves show merging of growing clusters. Inset:
N
c
(t) curves at different value of parameter p. Increasing
the dominance of horizontal information channel (increas-
ing p is marked by arrow) the maximum number of clusters
is decreasing and the clusters start to merge later.
ters starts to decrease. Sooner or later (depending on
the topology) clusters merge together forming larger
clusters. Due to this merging, the number of clus-
ters N
c
(t) reaches its maximum and then starts to de-
crease. Finally all the informed agents belong to the
same cluster called giant component. The time t
max
needed to reach the maximum of N
c
(t) and the max-
imum number of clusters N
c
(t
max
) at given values of
p and q depends on the topology as one can see in
Fig. 3. Not just the average shortest path length hLi,
but the average clustering coefficient hCi as well is
important from this point of view. For example, the
characteristic path length of network B is almost 10
times larger than in case of network F, so one can
think that the average distance between clusters are
larger so clusters in network B can merge together
later than in network F. The results disprove this as-
sumption, N
c
(t) reaches maximum earlier in the case
of network B, than in network F due to high hCi.
The size of the clusters of informed agents is con-
tinuously increasing due to the spreading of informa-
tion and the merging of clusters. Average cluster size
hSi(t) is usually defined by the second moment of the
cluster size distribution excluding the giant compo-
nent. It is given in form
hSi =
∑
S
S
2
n
S
(t)
∑
S
Sn
S
(t)
, (5)
where n
S
(t) is the dynamic cluster size distribution or
the number of clusters involving S informed agents.
First hSi(t) is increasing exponentially then it reaches
a sharp peak and then decreases exponentially. The
reason of the presence of this peak is the fact that the
giant component is excluded. Thus in the growing
phase, the sizes of clusters are increasing rapidly, then
one of the clusters become dominant and it annexes
other clusters. In this way as time passes just smaller
and smaller clusters remain unconnected/isolated re-
sulting in decreasing average cluster size. See Fig. 4.
1
10
10
2
10
3
10
4
0 200 400 600 800 1000
♣
♣
♣
♣
♣
♣
♣
♣
♣
♣
♣
♣
♣
♣
♣
♣
♣
♣
♣
♣
♣
♣
♣
♣
♣
♣
♣
♣
♣
♣
♣
network A
network B
network C
network D
network E
network F
1
10
10
2
10
3
10
4
10
-1
10
-2
10
-3
10
-4
10
-5
♣
♣
♣
♣
♣
♣
♣♣
hSi
t
hSi
max
1 − p
Figure 4: Average cluster size hSi (defined by Eq. 5) as a
function of time has sharp peak which strongly depends on
the topology. Inset: The maximum of the average cluster
size weakly depends on parameter p. As one can see net-
work topology results in larger differences than any change
in the spreading model parameter.
The time where the peak appears means when the
society continuously tends to be informed not just a
set of informed groups. If the peak is low it means
that giant component is very dominant, while high
peaks indicate clustered society with quasi-equivalent
domains of informed agents. Real social networks are
often modeled by scale-free networks, but by compar-
ing network E and F one can see large differences. In
BA networks small number of clusters are present and
their average size is also small due to the huge giant
component. In contrary in clustered scale-free topol-
ogy (network F) there can be double amount of clus-
ters with more than 10 times larger size so not just the
underlying network is clustered but also the informed
agent system over the topology. It can influence the
effectiveness of advertising as well. The large differ-
ences of the average cluster size peak hSi
max
in case of
different topologies are present independently of the
strength of vertical information channel (advertising)
determined by 1− p. See the inset of Fig. 4. To get an
appropriate advertising strategy not only the spread-
ing model but also the underlying network topology
is important.
Comparison of Network Topologies by Simulation of Advertising
21

5 CONCLUSIONS
Recent simulation results have shown out that al-
though the underlying networks have the same size
and density the topologies of networks have a huge
influence on spreading processes. In this work the ap-
plied networks were chosen from different classes of
topologies to figure out that the characteristic proper-
ties of the spreading process depend on both the aver-
age path length and the average clustering coefficient.
Although Barab´asi-Albert network and its clustered
variant are quite similar scale-free networks in the for-
mer one the speed of information spreading is much
faster. Naturally, the long distances of the planar tri-
angular lattice are the reason of the slow spreading
compared to the also regular spatial cubic network.
Usually longer paths and clustered communities lead
to slower spreading. It was also found that the de-
gree distribution of the network has only a small ef-
fect on the spreading. The random network and the
BA network behave in a similar way qualitatively and
quantitatively from several points of view, however
their degree distributions are completely different. As
it was mentioned both scale-free networks have the
same degree distribution exponent, but spreading on
them vary a lot.
Sometimes the network topology is much more
important than the parameters of the given spreading
model of competing channels, as it was demonstrated
by the analysis of size distribution of islands of in-
formed agents. It must be taken into account, when
we study real complex systems, where spreading is
important. From the application point of view micro-
scopic and macroscopic topological network proper-
ties must be considered in the planning stage. For ex-
ample to create an effective advertising strategy first
the topological features of the underlying (online) so-
cial network must be studied. As several kinds of so-
cial research have highlighted the interaction network
of individuals can be described by clustered scale-free
network. Thus the application of regular structures
or simple preferential attachment without clustering
can result in a false prediction about the success of
the advertising campaign. Results of the recent study
point out some advantages and disadvantages of the
structural properties of several network topologies in
spreading processes.
REFERENCES
Albert, R. and Barab´asi, A.-L. (2002). Statistical mechanics
of complex networks. Reviews of Modern Physics,
74:47–97.
Barab´asi, A.-L. and Albert, R. (1999). Emergence of scal-
ing in random networks. Science, 286(5439):509–
512.
Buzna, L., Peters, K., and Helbing, D. (2006). Modelling
the dynamics of disaster spreading in networks. Phys-
ica A, 363(1):132–140.
Domenico, M. D., Lima, A., Mougel, P., and Musolesi, M.
(2013). The anatomy of a scientific rumor. Scientific
Reports, 3:2980.
Eames, K. T. (2007). Modelling disease spread through
random and regular contacts in clustered populations.
Theoretical Population Biology, 73:104–111.
Erd˝os, P. and R´enyi, A. (1959). On random graphs. i. Pub-
licationes Mathematicae, 6:290–297.
Ganesh, A., Massouli, L., and Towsley, D. (2005). The
effect of network topology on the spread of epidemics.
In Proceedings of IEEE INFOCOM, volume 2, pages
1455–1466.
Karsai, M., Kivel¨a, M., Pan, R. K., Kaski, K., Kert´esz, J.,
Barab´asi, A.-L., and Saram¨aki, J. (2011). Small but
slow world: How network topology and burstiness
slow down spreading. Physical Review E, 83:025102.
Kocsis, G. and Kun, F. (2011). Competition of information
channels in the spreading of innovations. Physical Re-
view E, 84:026111.
Kun, F., Kocsis, G., and Farkas, J. (2007). Cellular automata
for the spreading of technologies in socio-economic
systems. Physica A, 383(2):660–670.
Lind, P. G., da Silva, L. R., Andrade, J. S., and Herrmann,
H. J. (2013). Spreading gossip in social networks.
Physical Review E, 76:036117.
Newman, M. E. J. (2010). Networks - An Introduction. Ox-
ford University Press. 17-99.
Pastor-Satorras, R., Castellano, C., Mieghem, P. V., and
Vespignani, A. (2015). Epidemic processes in com-
plex networks. Reviews of Modern Physics, 87:925.
Pastor-Satorras, R. and Vespignani, A. (2001). Epidemic
spreading in scale-free networks. Physical Review
Letters, 86:3200.
Rogers, E. M. (2003). Diffusion of innovations. Free Press,
5th edition.
Shirley, M. D. F. and Rushton, S. P. (2005). The impact
of network topology on disease spread. Ecological
complexity, 2(3):287–299.
Varga, I. (2015). Scale-free network topologies with cluster-
ing similar to online social. In Proceedings of the In-
ternational Conference on Social Modeling and Sim-
ulation & Econophysics Colloquium, Proceedings in
Complexity, pages 323–333, Kobe, Japan. Springer.
Wang, Y., Chakrabarti, D., Wang, C., and Faloutsos, C.
(2003). Epidemic spreading in real networks: an
eigenvalue viewpoint. In IEEE Proceedings of 22nd
International Symposium on Reliable Distributed Sys-
tems, pages 25–34.
Watts, D. J. and Strogatz, S. H. (1998). Collective dynamics
of ’small-world’ networks. Nature, 393(6684):440–
442.
COMPLEXIS 2017 - 2nd International Conference on Complexity, Future Information Systems and Risk
22
