Modeling of Blood Perfusion in Dependence of Scanning Angle from
LDPI Data
Jan Kubicek, Iveta Bryjova, Marek Penhaker, Vladimir Kasik, Zbynek Labza, Martin Cerny and
Martin Augustynek
VSB–Technical University of Ostrava, FEECS, K450, 17. Listopadu 15, 708 33, Ostrava-Poruba, Czech Republic
Keywords: Laser, Doppler Effect, Laser Doppler, LDI, LDPI, Microcirculation, Blood Perfusion, Modeling.
Abstract: The paper deals with issue of the modelling and analysis of a scanning angle influence on the blood
perfusion, and consequent proposal for their elimination. The first essential step of analysis is angle
stabilization. In this step, we utilize special artificial arm allowing for a measuring angle adjustment in the
scale of two axes. The modelling allows for simulation of perfusion units (PU) in the form of the quadratic
model, which is consequently recalculated in the form of the linear expression. The second part of the
analysis deals with the PU modelling in the dependence of the distance. In our analysis, we particularly use
a segment of middle finger and forearm. In the last part, we propose theoretical conception of the curvature
correction influence. This theoretical proposal leads to the relationship between measured and real PU
parameter.
1 INTRODUCTION
For tissue activity in a cutaneous plexus, the laser
method is used. The laser beam is absorbed during
tissue passage, changing direction, or wavelength
carrying information to the detector about
erythrocytes velocity in the particular tissue. A
product of the blood elements concentration with the
Doppler shift of a frequency and movement velocity
expresses so called number PD (Perfusion Units).
Interacttion of the laser radiation with the
particular tissue is influenced by the several factors:
type of a tissue, optical tissue properties,
wavelength, performance, power density, exposure
time and in the case of a pulsed laser it is length and
frequency of a pulse. Different refractive indexes in
individual tissue layers and absorption level
(absorption of radiation) cause different
transmittance (passage of radiation), dispersion and
reflection depending on the laser wavelength.
(Augustynek et al., 2010), (Blazek et al., 2015), (Ida
et al., 2016).
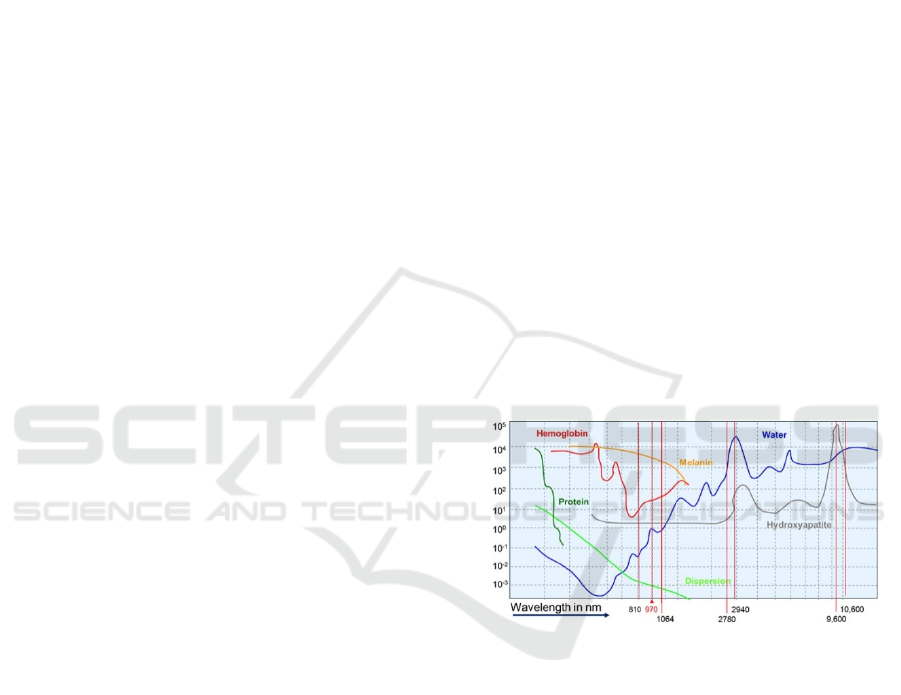
The main parameter determining penetration
depth into tissue is tissue absorption calculated for
given wavelength. In the case of interest of surfacing
tissues, we select laser with shorter wavelength
causing higher absorption with high energy
Figure 1: Laser Absorption in the dependence of
wavelength. (Thieme et al., 2016)
concentration. If we do not focuse on deeper
structures, we select laser with wavelength bellow
infrared area (630-750 nm). A level of laser
absorption in UV area and blue spectrum induces a
excitation in biomolecule where in extreme cases
goes to ionization, and contrarily light with greater
wavelengths causes atom oscillation, or molecule
rotation around their axes manifesting in the case of
thermal effects. (Brezinova et al., 2016), (Cerny et
al., 2008), (Thieme et al., 2016).
110
Kubicek J., Bryjova I., Penhaker M., Kasik V., Labza Z., Cerny M. and Augustynek M.
Modeling of Blood Perfusion in Dependence of Scanning Angle from LDPI Data.
DOI: 10.5220/0006142801100117
In Proceedings of the 10th International Joint Conference on Biomedical Engineering Systems and Technologies (BIOSTEC 2017), pages 110-117
ISBN: 978-989-758-216-5
Copyright
c
2017 by SCITEPRESS – Science and Technology Publications, Lda. All rights reserved
2 MEASUREMENT OF BLOOD
PERFUSION
The blood perfusion imaging by Laser Doppler
Perfusion Imaging (LDPI) is a medical diagnostic
imaging method which is based on the evaluation of
the Doppler shift laser radiation which reflects itself
from a moving blood elements typically erythrocytes
by skin capillaries. This phenomenon creates the
quantitative maps of the blood perfusion. This
diagnostic method is frequently used in the burn
medicine for the objective and non-invasive
assessing of the burn trauma range and depth. By the
clinical evaluation, there is up to 35% errors
especially on the early stages after undergoing
trauma. The correct adjusting of the thermic injuries
depth is key fact for the optimization of the future
diagnosis. The LDPI specificity and the sensitivity
for the burn depth is determined approximately 95
%. (Bevilacqua et al., 2016), (Cerny and Penhaker.,
2009), (Shin et al., 2016).
2.1 Scanning
Although the laser beam movement appears itself as
continuous during the scanning, each measurement
is in the fact created from a set of discrete points.
The maximum number of measuring points can
represent matrix with dimension 256 x 256, it means
that in the one image is more than 65 000 tissue
points. Generally, it is appropriate to get average
perfusion value along to many points because the
perfusion value is suffered from noise and the spatial
tissue variation in the every individual point. The
spatial resolution is defined as the smallest object
distance which is possible to recognize. The
resolution is determined by the laser diameter
(PeriScan PIM 3 allows 1 mm) and used scanning
step. The highest scanning effectivity is reached in
the case when the scanning step is equalled to the
laser beam average. The smaller scanning step
improves the visual representation of the scan but
does not contribute any physiological relevant
information.
Besides the perfusion scanning, PeriScan PIM 3
allows for the intensive scanning as well. This mode
is constructed on the base the intensity of the laser
beam back diffused to the photodetector regardless
on the Doppler shift. The pixel dimensions of the
intensive scan are equal as the perfusion scan. The
intensive scan is useful for differentiation of the
scanned object from background. (Kubicek et al.,
2016), (Stetinsky et al., 2015).
The PeriScan PIM 3 also contains the built-in
compensation of the signal noise from lights
supplied from the standard electrical site with the
frequency 50/60 Hz. The other ambient light
fluctuations can also influence the measurement so
that it is appropriate to ensure the stable light
conditions. The light conditions influence on
imaging process is the subject of this analysis.
(PERIMED, 2008).
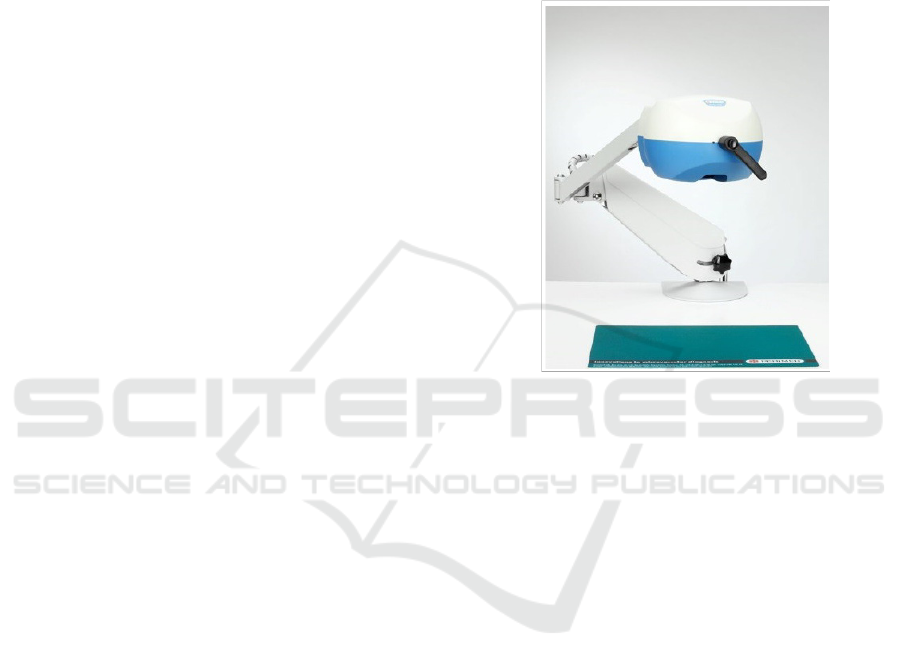
Figure 2: The arm with the head of PeriScan PIM 3.
(PERIMED, 2008).
2.2 LDPI Software
LDPI software is the analytic tool especially
intended for PeriScan systems. The software allows
for to user the exact numerical overviews of the
measured parameters and the color perfusion maps
as well. Physician can select and highlight the region
of interest (RoI) for detailed the blood perfusion
assessing in the highlighted spot. (Kukucka, 2009)
The LDPI software allows for the following
scanning modes:
• Single mode
• Repeated mode
• Sequential mode
• Duplex mode
The duplex mode allows the fluent measuring of
the blood perfusion only in one discrete point. The
measurement output is the curve of the blood
perfusion dependence within the time. The sample
frequency is adjusted on the 10 kHz and the
sampling period is 10 ms. In the ideal case, the
blood flowing plethysmography curve in the arteries
is clearly observable. This phenomenon is caused by
Modeling of Blood Perfusion in Dependence of Scanning Angle from LDPI Data
111

the change flowing in the arteries which is with the
scattering centers concentration the blood perfusion
expressing. (Elamin et al., 2015), (Klosová et al.,
2013), (Kukucka, 2009), (Machaj et al., 2016).
Figure 3: The measurement output in the duplex mode.
The graph shows the blood perfusion dependence within
the time. The RoI is indicated by blue color. The
quantified blood perfusion and other records are extracted
from RoI. (Elamin et al., 2015)
3 LDPI USING FOR
DIAGNOSTIC PURPOSES
The method LDPI contributes to monitoring of the
dermal plait blood perfusion. A depth of burn
influences a blood perfusion, thus time needed for
burn healing. On the Burn center in the university
hospital in Ostrava, the system PeriScan PIM3 is
used. The output represents 2D color map allowing
for imaging of 256 color scale covering range of
1000 arbitrary perfusion units (PU). If perfusion
rises, the color scale goes from blue to red color.
Increasing blood perfusion reflects increasing skin
metabolism. Patients who have undergone laser-
Doppler measurement, they are classified according
to tissue recovery time which is closely connected
with burn level. (Basak et al., 2016), (Goei et al.,
2016)
• Healing until 14 days (IIa. stage)
• Healing until 21 days (IIb. stage)
• Healing over 21 days (III. stage)
For the reason of edema in an affected area
oppressing of capillaries for 48 hours after injury,
instantaneous values of perfusion are distorting.
(Majernik et al., 2012)
Figure 4: Perfusion change in the dependence of particular
day (selected cases), (A) treatment time < 1 week, (B)
treatment time < 2 weeks, (C) treatment time < 3 weeks,
(D) treatment time > 3 weeks. (Schindler, 2016).
Nevertheless, it is important to start with the
measurement as soon as possible. In the clinical
practice, the measurement is started following day
after injury. Cases when measurement exhibits in 3.-
5. posttraumatic day (PTD) values greater than 147
PU, 6.-7. PTD 191 PU, 8.-9. PTD 273 PU are
classified into second group. Patients with perfusion
value less than 150 PU neither after 9. observed day
are subjected of surgery. (Majernik et al., 2014),
(Simonsen et al., 2016).
4 EXPERIMENTAL PART
There are two factors going to the process of
measurement. The factors are divided into affected
and unaffected. Each of these factors can be
differentiated as examples:
• Large burn areas
• Local burn areas
In the case of large burn areas (back or stomach)
– in this case of middle distance there is only
affected factor of measurement. By retaining of
imaginary parallelism plane of measuring head with,
we bring the least possible error of the method to the
measurement procedure, and measured values are
slightly different from real (values are depended on
distance and selected mode Low, Medium, High and
Very High). It is not needed to perform a scan
correction. If we change a measuring head position
where laser beam is not perpendicular on surface, we
bring a measurement error causing in the result
unreliable perfusion values. (Penhaker et al., 2013)
Case of curved surface large burns of long bones
(limbs) belongs to partially influenced case, only
when burn is led in longitudinal direction with bone,
and we are not focused on real values in the
neighbourhood of curved surfaces. All burn areas
which we cannot achieve the situation that all
measured points of burned area are perpendicular to
measured head are classified into unaffected cases.
Our analysis is primarily aimed to purposes of
unaffected measurements, but also deals with
infraction of main condition of measure head
parallelism in the case of affected measurement.
(Marek and Krejcar, 2015), (Penhaker et al., 2011).
4.1 Angle Stabilization
Before approaching to the measurement, it is needed
to perform of measured place angle stabilization. For
this purpose, we use artificial arm (fig. 5.) allowing
for an angle adjustment in two directions where it is
necessary to adjust the angle scale. In the one case, it
BIODEVICES 2017 - 10th International Conference on Biomedical Electronics and Devices
112
is angle led along of edge joint (fig. 6.A), with
radius 20mm (distance 90°-90° is 62.8 mm). In two
cases, they are angles in the circle (fig. 6.B), with
inner radius 15.5 mm and external radius 34.5 mm.
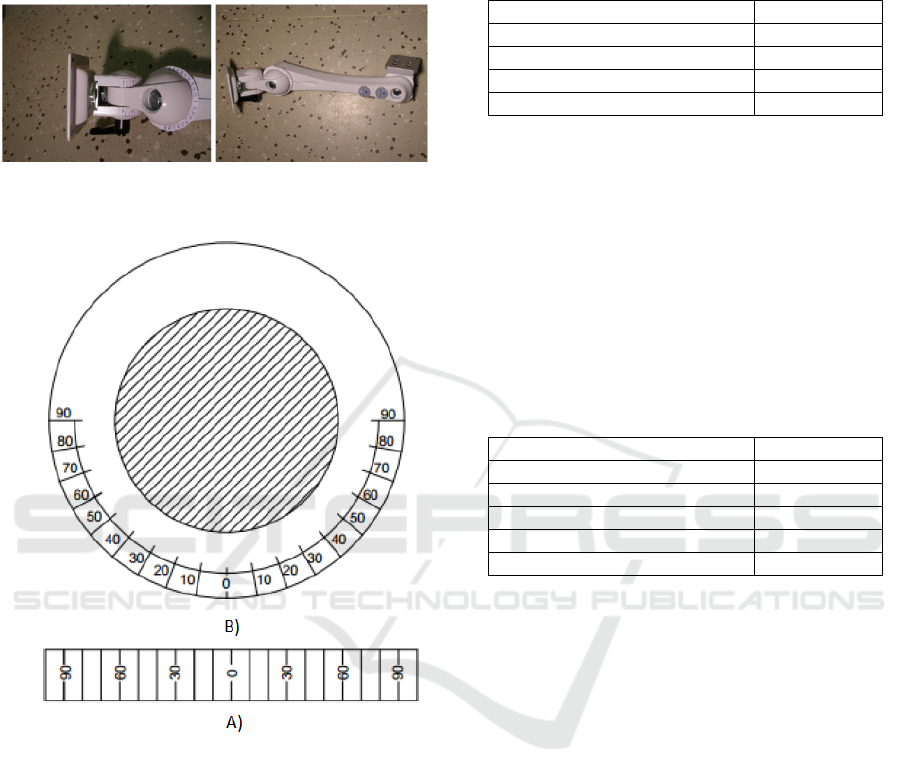
Figure 5: Detail view on the stabilizing arm with
measurement angles (left), whole stabilizing arm (right).
Figure 6: Used angle configuration for given radius, (B)
circle configuration with inner radius 15.5 mm and
external radius 34.5 mm, (A) angle led along of edge joint.
Since some of human parts do not have
completely flat surface for measurement, it is needed
to establish approach for placing of measured area
into plane. For this purpose, we use protractor for tilt
measurement. In this phase, we can approach to
device calibration. Calibration is done by using of
reference etalon using Brownian move.
4.2 Procedure of Measurement
Measurement in the single mode is carried out by the
conditions summarized in (Table.1.). Single mode
generates static image record, user sets scan
resolution and intensity threshold. After process of
measurement, software allows for intensive and
perfusion scan together with color image.
Table 1: Controlled conditions in single mode.
Atmospheric pressure 101.2 kPa
Light conditions 57 lx
Surrounding temperature 24.5 °C
Tissue temperature 36.2 °C
Humidity 32.2 °C
The output values from single mode will be used
for area comparison measured under angle 50°C,
and in the second case under 60°C.
Measurement in the duplex mode is carried out
by the conditions summarized in (Table.2.). Duplex
mode is different in the sense of scanning way. This
mode performs continual measurement of blood
perfusion in one point with sample frequency 100
Hz (step 10 ms). After selecting this mode, it is
possible to control of head distance to tissue, sample
frequency and change of intensity threshold.
Table 2: Controlled conditions in duplex mode.
Atmospheric pressure 101.4 kPa
Light conditions 95.5 lx
Surrounding temperature 28.5 °C
Tissue temperature 36.4 °C
Humidity 22.6 °C
Record length 9 s
For processing of results we use perfusion values
and intensity from duplex mode. The measured
values are related on one skin point (back of the
hand), they have inclination angle 0° to 70° from
parallel surface of measuring head (Fig. 7.). The fig.
8. shows graphical representation of the correction
curve of perfusion change in the dependence of
incidence angle. Perfusion units (PU) are
approximated by quadratic model:
=
(1)
Parameter
is approximated by the confidence
interval: {-0.0136312; 0.036515} containing zero
point, and p-value: 0.293605 which is greater than
0.05. On the base of the results, for this case the
parameter
is negligible against rest of the values.
After recalculation of values for the linear equation:
= (2)
We obtain the linear dependence (fig. 9.). The
resulting linear equation is expressed by the
following way:
Modeling of Blood Perfusion in Dependence of Scanning Angle from LDPI Data
113
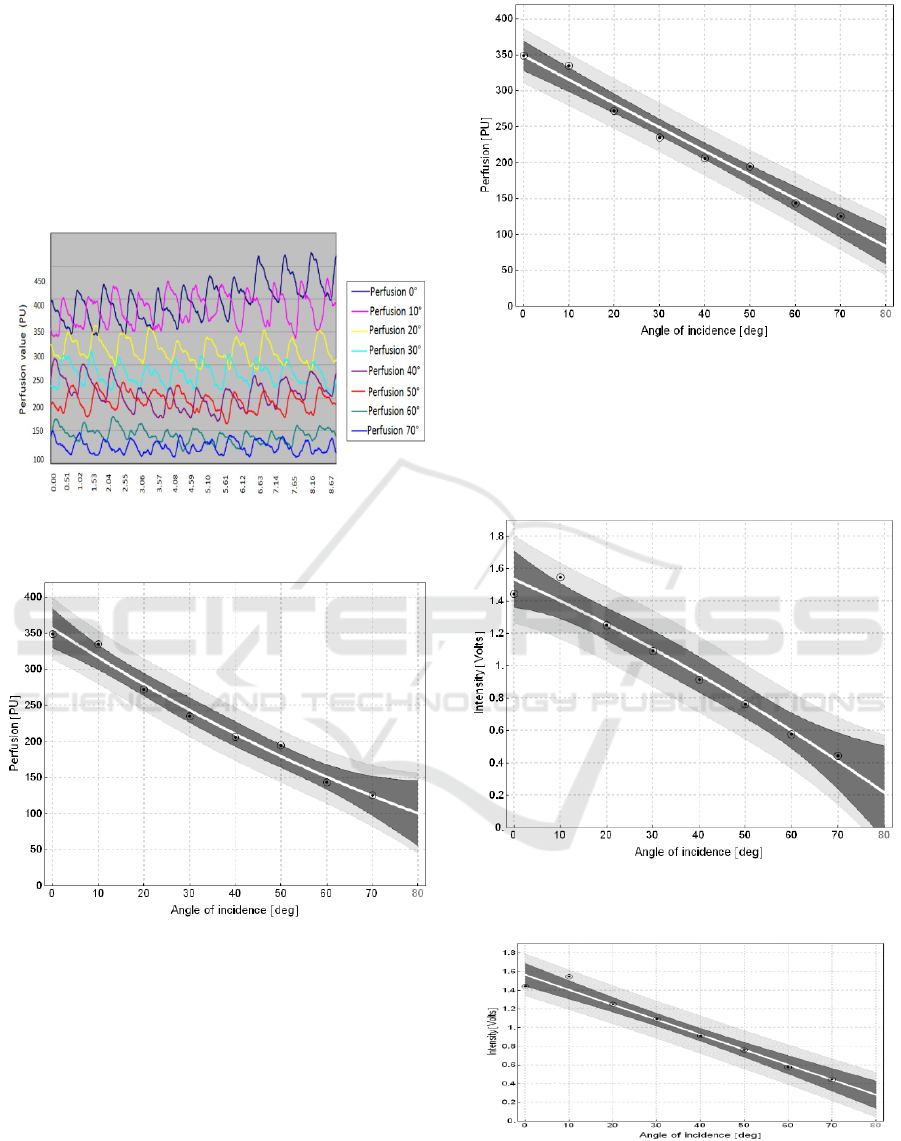
= 348.74 − 3.31619 (3)
This formulation consist the main part of the
final perfusion recalculation
to
.
The white line led by the center of the correction
graph determines the linear correction curve. The
dark gray band around the correction curve consists
of 95% probability of value occurrence in the
measured point.
Figure 7: 9 second perfusion records in the dependence of
angle.
Figure 8: Perfusion change within angle change for
quadratic model.
Figure 9: Perfusion change within angle change for linear
model.
Equally as for imaging of the quadratic and
linear model, it is approached to building of
quadratic (Fig. 10.) and linear (Fig. 11.) intensity
model.
Figure 10: Intensity change within angle change for
quadratic model.
Figure 11: Intensity change within angle change for linear
model.
BIODEVICES 2017 - 10th International Conference on Biomedical Electronics and Devices
114
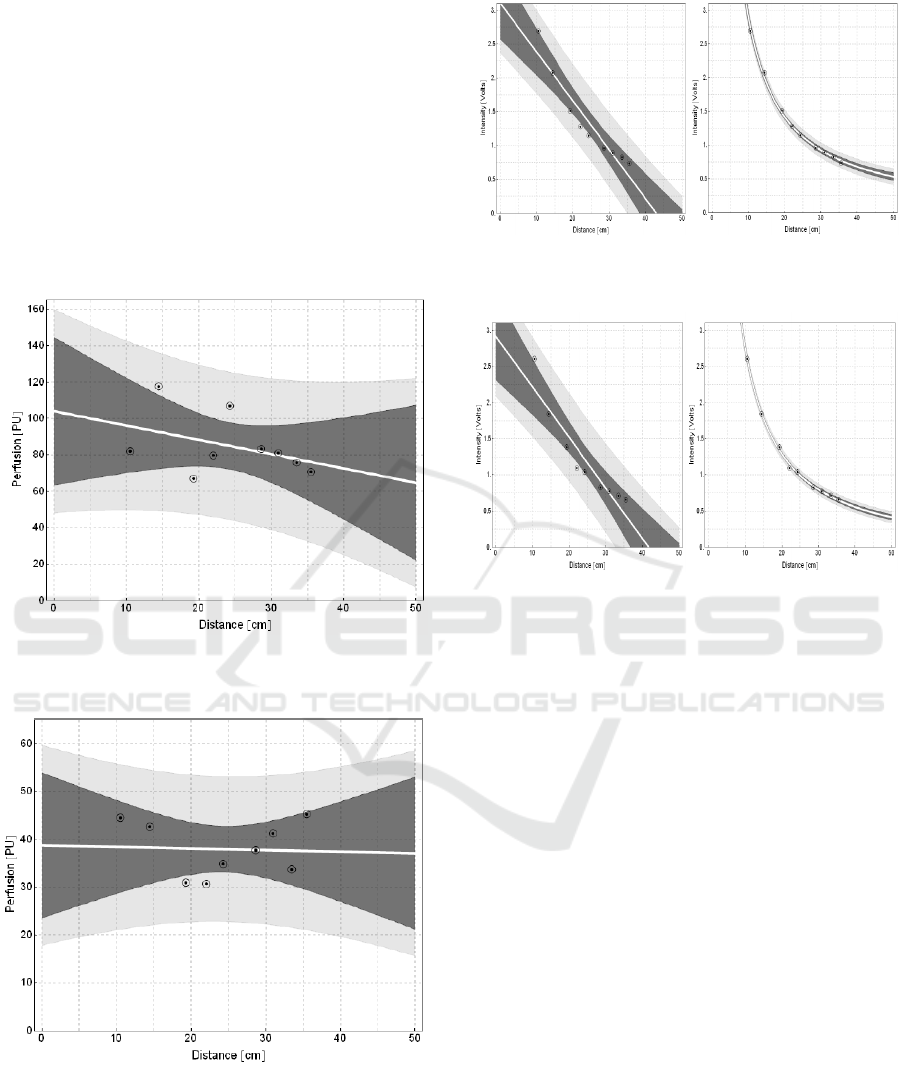
The last effect of measured parameters is
dependence of PU in the dependence of the distance.
A selected location of measurement is focused on 1.
A Segment of middle finger (digitus medius)
measured from side of back of the hand (Fig. 12.).
Consequently, we are focused on forearm (Fig. 13.).
On the base of statistical values of the linear models,
it is obvious that in the distance from 10.5 to 35.5
cm effect of distance change is statistically
negligible. We must state that the values of this
graph are obtained from person suffering from
Reynolds syndrome.
Figure 12: Intensity change within angle change for linear
model.
Figure 13: Perfusion change within distance change for
linear model „Forearm“.
Figure 14: Intensity change within distance change for
linear model „ middle finger “and their inverse quadrat.
Figure 15: Intensity change within distance change for
linear model „ forearm “and their inverse quadrat.
4.3 Theoretical Proposal of Curvature
Correction Influence
The reference plane is placed perpendicularly to
axes of measuring head in distance
from the
reference point of head H. Particularly for PeriScan
PIM3 it is
=25. A laser beam comes from
deeper place of head – point S, whose distance from
reference plane is
>
. It comes from the
calibration curve (rather from calibration line).
The Cartesian coordinates system is fitted by z
axis to axis of head, where orientation of z axis is
equal with outgoing laser beam direction. The x and
y axes are oriented in parallel with lines connecting
of laser beam intersection with reference plane (in
the scanning positions). The beginning of the
coordinate system is denoted by 0, intersection of
head axis with measured area is denoted by Q. A
laser beam outgoing from (virtual) point S is swept
by the way that in the moment of measurement in
reference plane it pass through points with
coordinates (u,v,0), one such point is denoted as R
(Fig. 16.). These points consist the regular grid with
sides
and
.
Modeling of Blood Perfusion in Dependence of Scanning Angle from LDPI Data
115

If we have perfusion calibration curve for incidence angle
correction, we have:
=
.
() (4)
, respectively directly for cos function we have:
=
.() (5)
Figure 16: Proposed situation of measurement correction.
On the base of the perfusion map
[, ] and the incidence angle map [, ]
(respectively [, ]) we can determine perfusion
map corrected on incidence angle
[, ] on the
base of the equation 5.
5 CONCLUSIONS
Before performing practical measurement, it was
necessary to add markers of tentative angles to
stabilizing arm. The arm performs stabilization only
of arm area of interest. Before performing of each
measurement, the surrounding conditions of
experiment were recorded in which experiment can
be repeated.
The results from single mode exhibit differences
in imagined areas. In the fact the imagined tissue in
dermis layer has same microcirculation of blood
elements, but measurement under different angle
showed that the device is affected by personally
unaffected influences distorting measurement
results. Consequences of this angle change were
observable on Duplex mode. Under perpendicular
angle of laser beam to tissue, laser beam goes
through the thinnest thickness of epidermis layer,
and direction of major number of blood elements is
predominantly forward and reverse. Any scanning of
skin under different angle than perpendicular cause
greater absorption of laser beam, because trajectory
of laser beam intersection is extended. Furthermore,
blood element movement is detected under certain
angle α. The correction curve created in the Duplex
mode shows the particular dependence of PU change
on angle change. For using of correction curve
(linear characteristic) to any measured area, it was
necessary to put measured curve values to ratio with
stable part of linear characteristic.
Within making of the theoretical procedure, it
was found out that PeriScan PIM3 together with
software do not have sufficient equipment which
would be able to measure of each perfusion matrix
discrete point. There are three reasons why it was
not possible to make experiments with the device. It
is only one device utilized for acute burn states, for
determining of proper diagnosis uses non-invasive
diagnostic method, and it does not belongs to
commonly used devices and the device must have
been acquired from own budget of University
hospital in Ostrava. Nevertheless, the theoretical
model conception is relatively strongly depended on
this feature. All other acquired records are sufficient
to correction of discretely values
transformation on real values
.
ACKNOWLEDGEMENTS
This article has been supported by financial support of TA
ČR ,PRE SEED Fund of VSB-Technical univerzity of
Ostrava/TG01010137. The work and the contributions
were supported by the project SV4506631/2101
'Biomedicínské inženýrské systémy XII'.
REFERENCES
Augustynek, M., Labza, Z., Penhaker, M., Korpas, D., &
Society, I. C. (2010). Verification of set up dual-
chamber pacemaker electrical parameters. 2010
Second International Conference on Computer
Engineering and Applications: Iccea 2010,
Proceedings, Vol 2, 168-172.
doi:10.1109/iccea.2010.187
Basak, K., Dey, G., Mahadevappa, M., Mandal, M., Sheet,
D., Dutta, P.K. 2016. Learning of speckle statistics for
in vivo and noninvasive characterization of cutaneous
wound regions using laser speckle contrast imaging.
Microvascular Research, 107, pp. 6-16.
BIODEVICES 2017 - 10th International Conference on Biomedical Electronics and Devices
116

Bevilacqua, A., Barone, D., Baiocco, S., Gavelli, G. A
2016. Novel approach for semi-quantitative
assessment of reliability of blood flow values in DCE-
CT perfusion. Biomedical Signal Processing and
Control, 31, pp. 257-264.
Blazek, P., Krenek, J., Kuca, K., Krejcar, O., Jun, D., &
Ieee. (2015). The biomedical data collecting system.
2015 25th International Conference Radioelektronika
(Radioelektronika), 419-422.
Brezinova, J., Hudak, R., Guzanova, A., Draganovska, D.,
Izarikova, G., & Koncz, J. (2016). Direct metal laser
sintering of ti6al4v for biomedical applications:
Microstructure, corrosion properties, and mechanical
treatment of implants. Metals, 6(7).
doi:10.3390/met6070171.
Cerny, M., Martinak, L., Penhaker, M., & Rosulek, M.
(2008). Design and implementation of textile sensors
for biotelemetry applications. In A. Katashev, Y.
Dekhtyar, & J. Spigulis (Eds.), 14th nordic-baltic
conference on biomedical engineering and medical
physics (Vol. 20, pp. 194-197).
Cerny, M., & Penhaker, M. (2009). Circadian rhythm
monitoring in homecare systems. In C. T. Lim & J. C.
H. Goh (Eds.), 13th international conference on
biomedical engineering, vols 1-3 (Vol. 23, pp. 950-
953).
Goei, H., van der Vlies, C.H., Ho, M.J., Tuinebreijer,
W.E., Nieuwenhuis, M.K., Middelkoop, E., van Baar,
M.E. 2016. Long-term scar quality in burns with three
distinct healing potentials. A multicenter prospective
cohort study Wound Repair and Regeneration, 24 (4),
pp. 721-730.
Ida, T., Iwazaki, H., Kawaguchi, Y., Kawauchi, S.,
Ohkura, T., Iwaya, K., Tsuda, H., Saitoh, D., Sato, S.,
Iwai, T. 2016. Burn depth assessments by
photoacoustic imaging and laser Doppler imaging
Wound Repair and Regeneration, 24 (2), pp. 349-355.
Elamin, S.E., Dickson, J.K., Mackie, I.P. 2015. Is Laser
Doppler imaging (LDI) a measure of burn depth?
Burns, 41 (2), p. 413.
Klosová, H., Štětinský, J., Bryjová, I., Hledík, S. and
Klein, L. 2013. Objective evaluation of the effect of
autologous platelet concentrate on post-operative
scarring in deep burns. Burns., DOI: 10.1016/j.burns.
2013.01.020.
Kubicek, J., Penhaker, M., Bryjova, I., & Augustynek, M.
(2016). Classification method for macular lesions
using fuzzy thresholding method. In E. Kyriacou, S.
Christofides, & C. S. Pattichis (Eds.), Xiv
mediterranean conference on medical and biological
engineering and computing 2016 (Vol. 57, pp. 239-
244).
Kukucka, M. (2009). Modeling of logic diagnostic system
knowledge base evaluation. Machaj, J., Brida, P., &
Benikovsky, J. (2016). Scalability optimization of
seamless positioning service. Mobile Information
Systems. doi:10.1155/2016/9714080
Majernik, J., & Jarcuska, P. (2012). Education of clinical
disciplines in pre and post-graduate study oriented on
increasing of newest infectious diseases knowledge. In
A. Isman (Ed.), 3rd international conference on new
horizons in education - inte 2012 (Vol. 55, pp. 604-
611).
Majernik, J., Jarcuska, P., & Ieee. (2014). Web-based
delivery of medical education contents used to
facilitate learning of infectology subjects
. 2014 10th
International Conference on Digital Technologies (Dt),
225-229.
Marek, T., & Krejcar, O. (2015). Optimization of 3d
rendering in mobile devices. In M. Younas, I. Awan, &
M. Mecella (Eds.), Mobile web and intelligent
information systems (Vol. 9228, pp. 37-48).
Penhaker, M., Darebnikova, M., & Cerny, M. (2011).
Sensor network for measurement and analysis on
medical devices quality control. In J. J. Yonazi, E.
Sedoyeka, E. Ariwa, & E. ElQawasmeh (Eds.), E-
technologies and networks for development (Vol. 171,
pp. 182-196).
Penhaker, M., Kasik, V., & Snasel, V. (2013). Biomedical
distributed signal processing and analysis. In K.
Saeed, R. Chaki, A. Cortesi, & S. Wierzchon (Eds.),
Computer information systems and industrial
management, cisim 2013 (Vol. 8104, pp. 88-95).
Simonsen, C.Z., Schmitz, M.L., Madsen, M.H.,
Mikkelsen, I.K., Chandra, R.V., Leslie-Mazwi, T.,
Andersen, G. 2016. Early neurological deterioration
after thrombolysis. Clinical and imaging predictors ()
International Journal of Stroke, 11 (7), pp. 776-782.
Schindler, T.H. 2016. Myocardial blood flow. Putting it
into clinical perspective (Journal of Nuclear
Cardiology, 23 (5), pp. 1056-1071.
PERIMED AB, 2008. PeriScan PIM3 System – Extended
User Manual, July retrieved 2012, URL
http://www.perimed-instruments.com/.
Shin, Y., Yi. H.S. 2016. Diagnostic accuracy of laser
Doppler imaging in burn depth assessment.
Systematic review and meta-analysis Burns.
Stetinsky, J., Klosova, H., Kolarova, H., Salounova, D.,
Bryjova, I., & Hledik, S. (2015). The time factor in the
ldi (laser doppler imaging) diagnosis of burns. Lasers
in Surgery and Medicine, 47(2), 196-202.
doi:10.1002/lsm.22291
Thieme, D., Spilker, G., Lefering, R., Weinand, C. 2016.
O2C Laser Doppler and Digital Photo Analysis for
Treatment Evaluation of Beta-Glucan versus
Provitamin Pantothenic Acid of Facial Burns Facial
Plastic Surgery, 32 (2), pp. 225-231.
Modeling of Blood Perfusion in Dependence of Scanning Angle from LDPI Data
117
