
Evaluating Deep Convolutional Neural Networks for Material
Classification
Grigorios Kalliatakis
1
, Georgios Stamatiadis
1
, Shoaib Ehsan
1
, Ales Leonardis
2
, Juergen Gall
3
,
Anca Sticlaru
1
and Klaus D. McDonald-Maier
1
1
School of Computer Science and Electronic Engineering, University of Essex, Colchester, U.K.
2
School of Computer Science, University of Birmingham, Birmingham, U.K.
3
Institute of Computer Science, University of Bonn, Bonn, Germany
{gkallia, gstama, sehsan, asticl, kdm}@essex.ac.uk, a.leonardis@cs.bham.ac.uk, gall@iai.uni-bonn.de
Keywords:
Convolutional Neural Networks, Material Classification, Material Recognition.
Abstract:
Determining the material category of a surface from an image is a demanding task in perception that is draw-
ing increasing attention. Following the recent remarkable results achieved for image classification and object
detection utilising Convolutional Neural Networks (CNNs), we empirically study material classification of
everyday objects employing these techniques. More specifically, we conduct a rigorous evaluation of how
state-of-the art CNN architectures compare on a common ground over widely used material databases. Exper-
imental results on three challenging material databases show that the best performing CNN architectures can
achieve up to 94.99% mean average precision when classifying materials.
1 INTRODUCTION
Image classification and object detection have been
active areas of research during the last few years (Gir-
shick et al., 2013; Huang et al., 2011; Wang et al.,
2010). Initially, handcrafted approaches, such as Bag-
of-Visual-Words (BoVW) (Csurka et al., 2004), were
employed that yielded reasonably good results for
these two tasks. However, the emergence of Convolu-
tional Neural Networks (CNNs) (LeCun et al., 1989)
for solving these vision based problems has changed
the scenario altogether by comprehensively outper-
forming the handcrafted approaches (Donahue et al.,
2014; Razavian et al., 2014; Sermanet et al., 2013).
While the morphology of these networks remains
handcrafted, the accommodation of a large number of
parameters trained from data and numerous layers of
non-linear feature extractors have lead the researchers
to term them as deep representations. After setting the
performance benchmark for image classification and
object detection tasks (Krizhevsky et al., 2012; Zeiler
and Fergus, 2014), these deep architectures are now
finding their way into a number of vision based appli-
cations (Donahue et al., 2014; Girshick et al., 2014;
Oquab et al., 2014; Razavian et al., 2014; Sermanet
et al., 2013; Simonyan and Zisserman, 2014).
One such application is classification of materials
from their appearance utilising a single image. In-
deed, perception of recognized surface material plays
a major role in scene understanding and has a wide
range of applications, including robotics. Material
classification in the wild is considered a challenging
problem due to the fact that materials regularly exhibit
large intra-class and inter-class variability. This par-
ticular topic has received attention fairly recently and
a handful of computer vision systems have been ex-
plicitly constructed to recognize materials in the wild
so far. In the early work on image texture analysis
by (Dana et al., 1999), the CUReT dataset was in-
troduced which was generated in a restricted envi-
ronment and only encompassed flat texture patches.
Over 95% classification accuracy was reported on the
CUReT dataset by (Varma and Zisserman, 2009). On
the contrary, only 23% accuracy was accomplished on
the more challenging Flickr material dataset (FMD)
(Sharan et al., 2010). The work of (Liu et al., 2010),
in which they presented a number of new features
for classifying materials, achieved 45% accuracy on
FMD. This was improved by (Hu et al., 2011) that
achieved 54% classification accuracy by expanding
more on features. Finally, (Cimpoi et al., 2014) devel-
oped a CNN and improved Fisher vector (IFV) classi-
fier that achieved state-of-the-art results on FMD and
KTH-TIPS2 (Fritz et al., 2004).
It is, however, still unclear how different CNN
346
Kalliatakis G., Stamatiadis G., Ehsan S., Leonardis A., Gall J., Sticlaru A. and McDonald-Maier K.
Evaluating Deep Convolutional Neural Networks for Material Classification.
DOI: 10.5220/0006166603460352
In Proceedings of the 12th International Joint Conference on Computer Vision, Imaging and Computer Graphics Theory and Applications (VISIGRAPP 2017), pages 346-352
ISBN: 978-989-758-226-4
Copyright
c
2017 by SCITEPRESS – Science and Technology Publications, Lda. All rights reserved
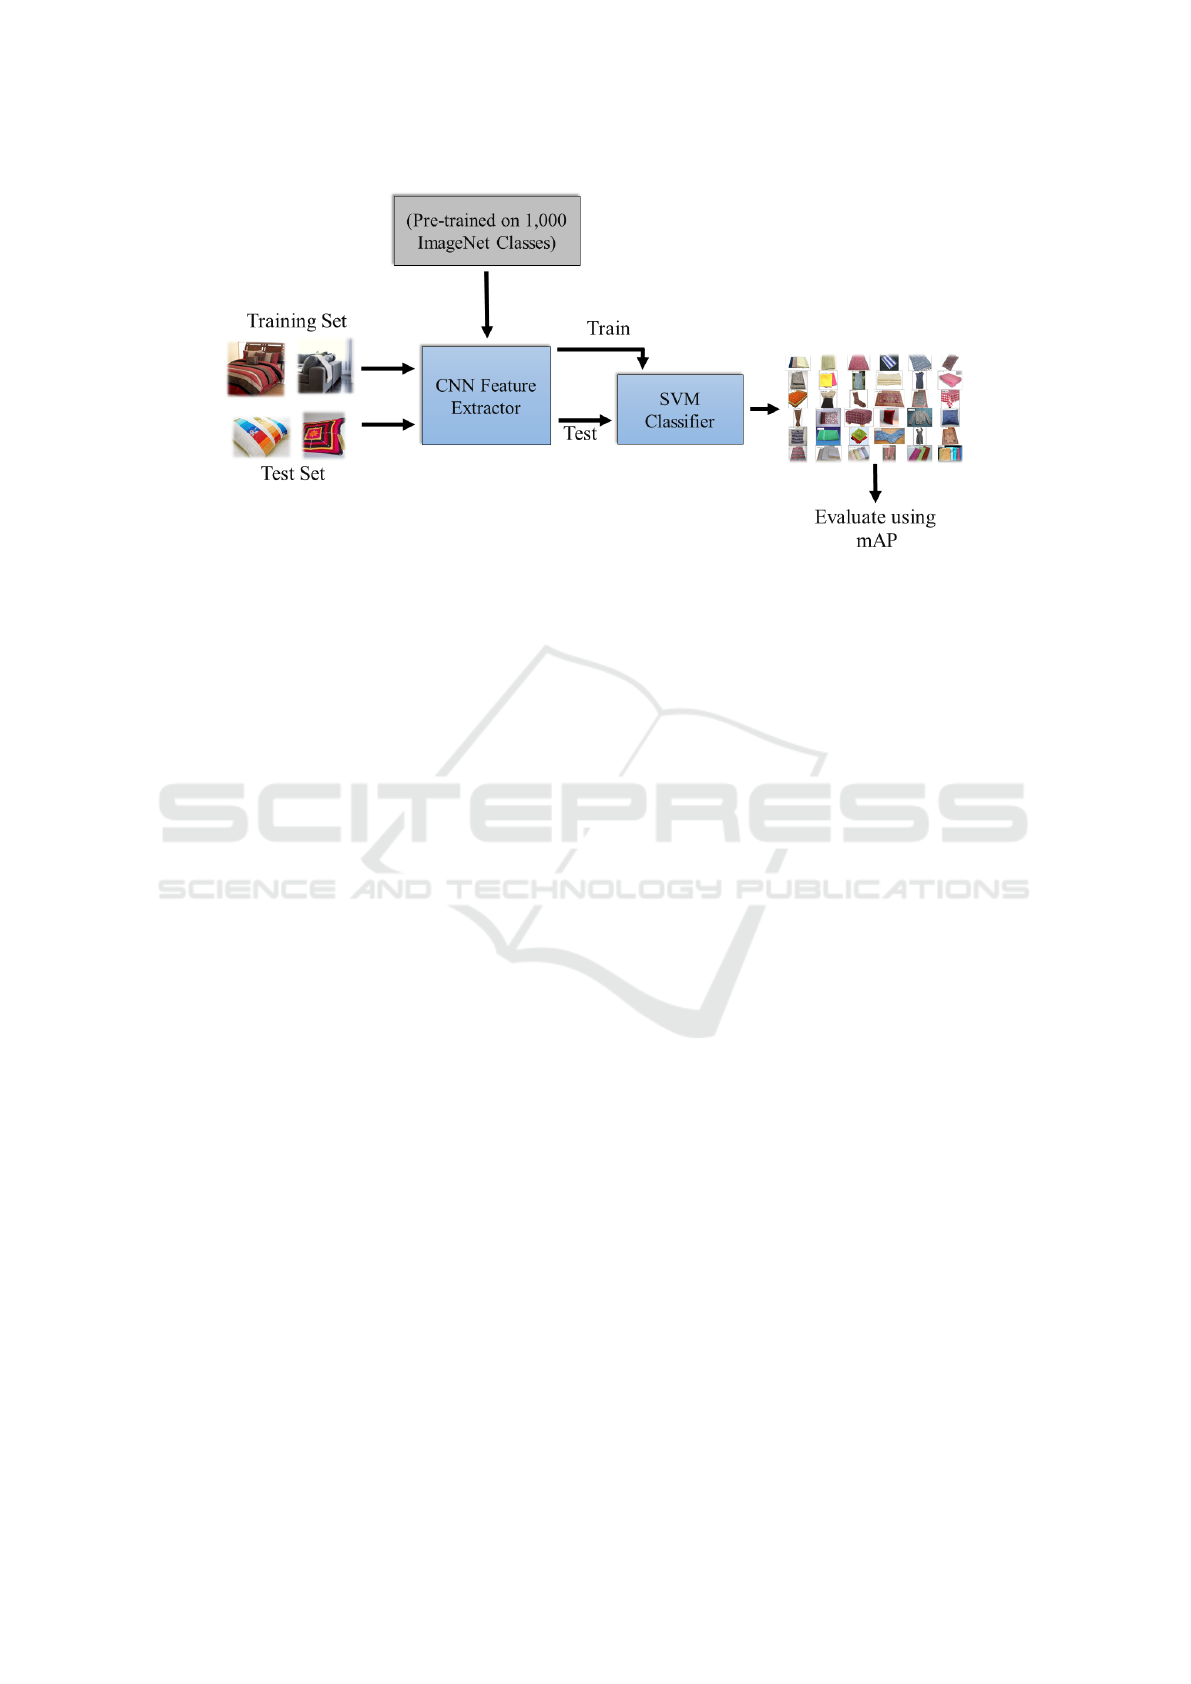
Figure 1: An overview of the material classification pipeline used for our experiments. The training and test datasets, along
with the learning procedure, are fixed as different CNN architectures (pre-trained on 1000 ImageNet classes) are plugged into
the pipeline, one at a time, to test their performance using mean average precision (mAP).
methods compare with each other for the mate-
rial classification task as previous studies did not
test these deep architectures extensively on common
ground (Bell et al., 2015). Since the performance of
computer vision systems depends significantly on im-
plementation details (Chatfield et al., 2014), it is im-
portant to take into account factors, such as the use
of very large scale datasets, GPU computation and
data augmentation, when comparing CNN methods
for material classification. To our knowledge, this
particular work is the first attempt to do a systematic
and rigorous evaluation of the state-of-the-art CNN
architectures for material classification in the wild.
Considering the effect of different design and imple-
mentation choices allowed a fair, unbiased compar-
ison on a common ground-something that has been
largely missing so far in the literature.
More specifically, we perform thorough assess-
ment of the state-of-the-art CNN architectures utilis-
ing three widely used materials databases (FMD (Sha-
ran et al., 2010), MINC-2500 (Bell et al., 2015) and
ImageNet materials (Hu et al., 2011)) while identi-
fying and disclosing important implementation de-
tails. For performing the large set of experiments,
we partly followed the approach of (Chatfield et al.,
2014) which was used for comparing CNN architec-
tures for recognition of object categories. We, on
the other hand, tackle material classification in this
particular work, an entirely different problem from
(Chatfield et al., 2014). Our experimental results on
three challenging materials databases show that the
best performing CNN architectures can achieve up to
94.99% mean average precision when classifying ma-
terials.
The rest of the paper is organised as follows.
Section 2 gives details of the material classification
pipeline used for our experiments. The evaluation re-
sults for state-of-the-art CNN architectures employ-
ing three widely used materials databases of real-
world images are presented in Section 3. Section 4
performs a cross-dataset analysis for real-world im-
ages. Finally, conclusions are given in Section 5.
2 MATERIAL CLASSIFICATION
PIPELINE
An illustration of the material classification pipeline
used for our experiments is given in Figure 1. In
this pipeline, every block is fixed except the feature
extractor as different CNN architectures (pre-trained
on 1000 ImageNet classes) are plugged in, one at a
time, to compare their performance utilising mean av-
erage precision (mAP). Given a training dataset Tr
consisting of m material categories, a test dataset Ts
comprising unseen images of the material categories
given in Tr, and a set of n pre-trained CNN architec-
tures (C1,...Cn), the pipeline operates as follows: The
training dataset Tr is used as input to the first CNN
architecture C1. The output of C1 is then utilised
to train m SVM classifiers. Once trained, the test
dataset Ts is employed to assess the performance of
the material classification pipeline using mAP. The
training and testing procedures are then repeated af-
ter replacing C1 with the second CNN architecture C2
to evaluate the performance of the material classifica-
tion pipeline. For a set of n pre-trained CNN architec-
Evaluating Deep Convolutional Neural Networks for Material Classification
347
Table 1: An overview of the three material databases used for experiments.
FMD ImageNet7 MINC-2500
Categories 10 7 23
Samples per category 100 100 2500
Material Samples 1000 1000 2500
Total image number 1000 7000 57500
tures, the training and testing processes are repeated
n times. Since the whole pipeline is fixed (including
the training and test datasets, learning procedure and
evaluation protocol) for all n CNN architectures, the
differences in the performance of the material classi-
fication pipeline can be attributed to the specific CNN
architectures used.
The CNN-F architecture is similar to the one used
by (Krizhevsky et al., 2012). On the other hand, the
CNN-M architecture is similar to the one employed
by (Zeiler and Fergus, 2014), whereas the CNN-S ar-
chitecture is related to the ’accurate’ network from the
OverFeat package (Sermanet et al., 2013). All these
baseline CNN architectures are built on the Caffe
framework (Jia et al., 2014) and are pre-trained on Im-
ageNet (Deng et al., 2009). Each network comprises 5
convolutional and 3 fully connected layers for a total
of 8 learnable layers. For further design and imple-
mentation details for these architectures, please see
Table 1 in (Chatfield et al., 2014). Please note that the
results of the penultimate layer (layer 7) are used for
the SVM classifier in this particular work. Each test
yields a feature vector of 4096 dimensions per im-
age. The CNN-M is also tested in situations when the
feature dimensionality is reduced to 2048, 1024, and
128, and in cases where the images are turned into
grey scales.
Three different types of data augmentation are
used: 1) No augmentation, where a 224 x 224 crop
is taken from the image (image is downsized to224
pixels in the smallest dimension); 2) Flip augmenta-
tion, where the image is mirrored along the y-axis;
and 3) Crop and Flip augmentation, where the four
corners of the image and the center and their flips are
taken and rescaled down to 256 pixels on the smallest
side. In terms of collation, there are four types used:
1) No collation, where the additional crops generated
by the various augmentation methods are returned as
extra features; 2) Sum pooling is used over the gener-
ated crops for each image; 3) Max, where max pool-
ing is used; and 4) Stack, where the crops generated
are stacked and thus yield feature vectors of more di-
mensions per image.
3 PERFORMANCE
COMPARISON OF CNN
ARCHITECTURES
This section presents the results for the three baseline
CNN architectures, with different data augmentation
strategies, for the material classification task when
trained and tested on real- world images. The eval-
uation procedure is divided into three different sets of
experiments, each one employing a different, widely
used materials database consisting of real-world im-
ages related to specific material categories. In each
case, the employed materials database is used for gen-
erating the training and testing datasets which implies
no cross-dataset analysis for these particular sets of
experiments. This approach is used to obtain compar-
ison results across all available material categories for
each benchmark database, thus complementing the
previous studies in the literature on these databases.
3.1 Material Databases
Three different databases are used in our experi-
ments: 1) Flickr Material Database (FMD) (Sharan
et al., 2010), 2) ImageNet7 dataset (Hu et al., 2011)
which was derived from ImageNet (Deng et al., 2009)
by collecting 7 common material categories, and 3)
MINC-2500 which is a patch classification dataset
with 2500 samples per category (Bell et al., 2015).
Table 1 gives an overview of the three different ma-
terial databases used for these experiments. As evi-
dent, all three databases consist of neither the same
number of images nor categories between them. For
this specific reason and in order to keep the tests on a
common base, we consider the first half of the images
enclosed in each database category as positive train-
ing samples and the other half for testing. Regarding
negative training samples, the first 10% of the total
images per category are aggregated in order to gen-
erate the negative training subset. Finally, a dataset
(Vedaldi and Zisserman, ) containing 1414 random
images is utilised and kept constant as the negative
test data of our system for all the experiments that
follow. In total, 14 different variants of the base-
line CNN architectures with different data augmen-
VISAPP 2017 - International Conference on Computer Vision Theory and Applications
348

Table 2: Material classification results with real-world images. Both training and testing are performed using the same
database. Bold font highlights the leading mean result for every database. Three data augmentation strategies are used
for both training and testing: 1) no augmentation (denoted Image Aug=-), 2) flip augmentation (denoted Image Aug=(F)),
3) crop and flip (denoted Image Aug=(C)). Augmented images are used as stand-alone samples (f), or by combining the
corresponding descriptors using sum (s) or max (m) pooling or stacking (t). Here, GS denotes gray scale. The same symbols
for data augmentation options and gray scale are used in the rest of the paper.
MINC-2500 ImageNet7 FMD
Method Image Aug.
mAP mAP mAP
(a) CNN F (C) f s 91.68 67.68 59.39
(b) CNN S (C) f s 92.98 70.47 64.44
(c) CNN M - 92.14 70.67 60.72
(d) CNN M (C) f s 92.64 72.50 62.72
(e) CNN M (C) f m 92.85 73.28 62.97
(f) CNN M (C) s s 93.17 71.86 62.57
(g) CNN M (C) t t 94.99 73.73 64.40
(h) CNN M (C) f - 91.23 69.87 58.88
(i) CNN M (F) f - 91.94 71.08 60.37
(j) CNN M GS - 90.54 67.31 52.38
(k) CNN M GS (C) f s 90.87 67.48 59.23
(l) CNN M 2048 (C) f s 93.34 72.55 62.45
(m) CNN M 1024 (C) f s 93.61 73.09 61.92
(n) CNN M 128 (C) f s 92.74 74.97 48.18
tation strategies are compared on FMD, ImageNet7
and MINC-2500.
3.2 Results and Discussion
Table 2 shows the results for the three databases for
state-of-the-art CNN architectures with different data
augmentation strategies. It is evident that the Medium
CNN architecture with crop and flip augmentation
enabled, whereas the corresponding descriptors us-
ing stacking both in training and testing, used for
the samples of augmented images, performs the best
for both MINC-2500 and FMD. On the other hand,
the Medium CNN architecture, including lower di-
mensional full 7 layers of 128 dimensions, with crop
and flip augmentation enabled, when the correspond-
ing descriptors using sum-pooling are utilised for the
samples of augmented images in testing only, per-
forms the best in the case of ImageNet7. Compared
to (Oquab et al., 2014), where 85.0% mean accu-
racy was achieved on MINC (considering only the
common categories with FMD) using the AlexNet
(Krizhevsky et al., 2012), here an average of 92.48%
on MINC-2500 is achieved across all considered
CNN architectures. Regarding the FMD database,
(Liu et al., 2010) with their optimal feature set man-
aged 44.6% recognition rate, while in (Girshick et al.,
2014) 54% accuracy is achieved with their extended
kernel descriptors. In our case, an improved mAP
of 60% (on average) is achieved for the 14 different
CNN configurations that we tested. Finally, the cre-
ators of the ImageNet7 (Hu et al., 2011) reported 60%
recognition accuracy on their database by combining
all 5 available kernel descriptors. On the contrary,
mAP of 71.18% (on average) is achieved here as it
is clear from Table 2 across all considered CNN con-
figurations.
A comparative plot for mean average precision
achieved by the state-of-the-art CNN architectures
for the three databases (MINC-2500, FMD and Im-
ageNet7) is shown in Figure 2. This plot encom-
passes only the six common/overlapping categories
for the three databases to demonstrate the variations
in performance of different CNN architectures across
these categories. The Medium CNN architecture
gives the best mAP (91.10%) with stack augmentation
both for training and for testing purposes. With the
same configuration, the best performance of 77.46%
is achieved on ImageNet7, while a considerably lower
mAP of 51.40% is obtained for FMD. Such decline
occurs primarily because of the limited dataset size,
whereby learning the millions of parameters of a
CNN is usually impractical and may lead to over-
fitting.
4 CROSS-DATASET ANALYSIS
WITH REAL-WORLD IMAGES
Results for three different cross-dataset experiments
are given in Table 3: 1) Training on FMD and test-
ing on ImageNet7 2) Training on FMD and testing
Evaluating Deep Convolutional Neural Networks for Material Classification
349
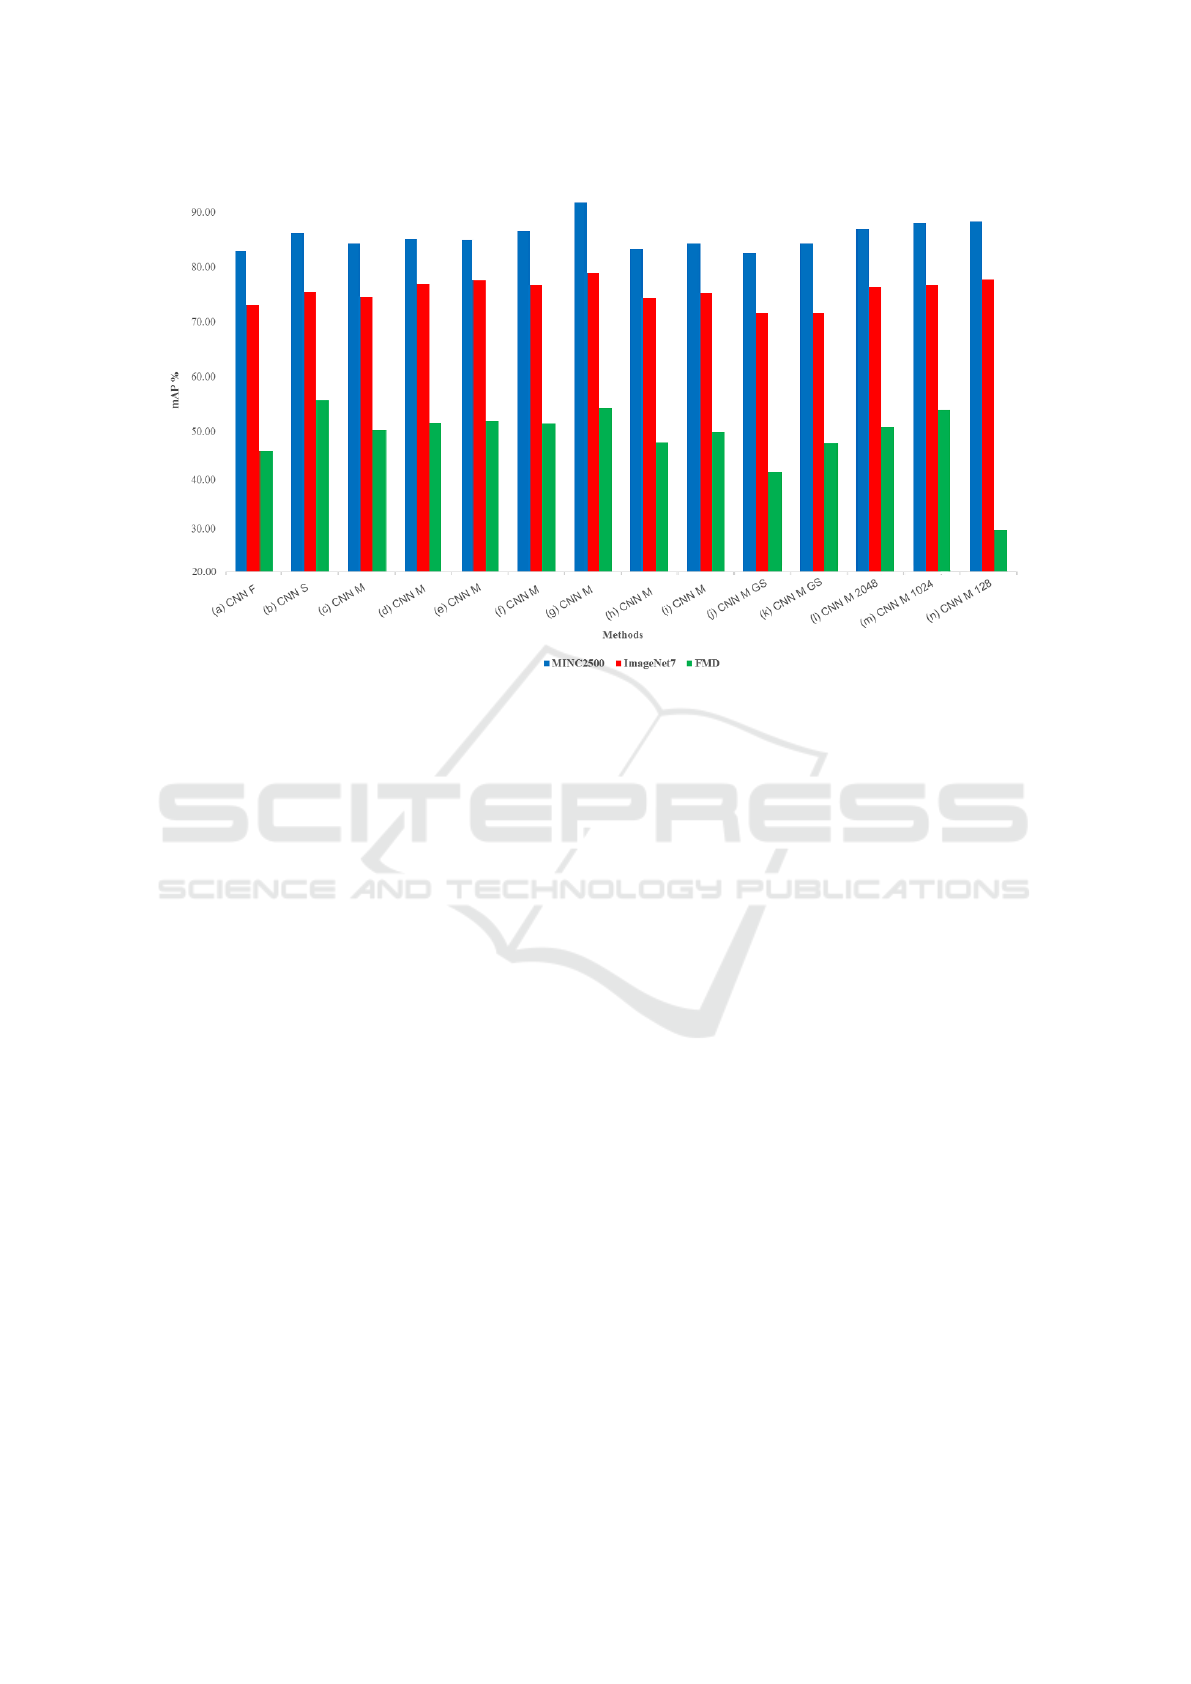
Figure 2: Comparison of CNN architectures in terms of mAP for six overlapping categories (fabric, glass, metal, paper, plastic
and wood) of FMD, MINC-2500, ImageNet7 databases.
on MINC-2500 3) Training on MINC-2500 and test-
ing on ImageNet7. Considering the fact that the FMD
dataset is quite small, with only 100 images per ma-
terial class, it performs better when used for train-
ing with reduced feature dimensionality per image,
also observed in (Zheng et al., 2014). In Table 3,
with FMD as training database, the material classi-
fication pipeline performs best in testing the overlap-
ping categories with ImageNet7 when Medium CNN
architecture is used with 128 feature points per im-
age extracted. The crop and flip augmentation and
sum pooling collation is also used in this configura-
tion and a mAP of 82% is achieved. For FMD as
training and MINC-2500 as testing database, the ma-
terial classification pipeline achieves the best accu-
racy in testing the overlapping categories when CNN-
M architecture is utilised with 2048 feature points per
image extracted. Crop and flip augmentation and sum
pooling are also used and the resulting mAP is 76%.
It is evident from Table 3 that the performance of
the system increases when MINC- 2500 is used as
training database and overlapping categories of Im-
ageNet7 are tested. This is due to the fact that MINC-
2500 database enables the use of more images for pos-
itive training when testing the overlapping categories
with ImageNet7. In this case, the highest accuracy
is again achieved when CNN-M is used. However,
only flip is used as augmentation and no collation is
utilised with this CNN architecture as opposed to the
above two cases. The resulting accuracy of the system
is 91%. This is the case of finding the best balance
before over-fitting occurs. Finally, the resulting aver-
age across all three experiments is 82%.
5 CONCLUSIONS
We have performed a rigorous empirical evaluation
of state-of-the-art CNN-based approaches for the ma-
terial classification task. Out of the three baseline
CNN architectures considered, it is evident that the
Medium CNN architecture in general performs the
best in combination with different data augmentation
strategies for the three widely used material databases
(FMD, MINC-2500 and ImageNet7). It will be an
interesting future direction to investigate if synthetic
data can be combined with real images to improve ac-
curacy and generalisation abilities of CNNs (Wein-
mann et al., 2014).
ACKNOWLEDGEMENTS
We acknowledge MoD/Dstl and EPSRC for provid-
ing the grant to support the UK academics (Ales
Leonardis) involvement in a Department of Defense
funded MURI project. This work was also supported
in part by EU H2020 RoMaNS 645582, EPSRC EPC
EP/M026477/1 and ES/M010236/1.
VISAPP 2017 - International Conference on Computer Vision Theory and Applications
350

Table 3: Cross-dataset material classification results. Training and testing are performed using 3 different databases of real-
world images. The name on the top denotes the training database, while the name on the bottom implies the testing database.
Bold font highlights the leading mean result for every experiment.
FMD
ImageNet7
FMD
MINC-2500
MINC-2500
ImageNet7
Method Image Aug.
mAP mAP mAP
(a) CNN F (C) f s 78.23 71.87 85.11
(b) CNN S (C) f s 83.50 72.95 86.18
(c) CNN M - 82.40 73.06 87.64
(d) CNN M (C) f s 81.68 74.82 85.79
(e) CNN M (C) f m 81.69 75.46 86.55
(f) CNN M (C) s s 79.52 73.56 89.88
(g) CNN M (C) t t 80.22 74.19 89.53
(h) CNN M (C) f - 80.31 73.83 82.71
(i) CNN M (F) f - 81.91 73.01 91.03
(j) CNN M GS - 71.82 66.78 89.37
(k) CNN M GS (C) f s 75.95 69.05 87.87
(l) CNN M 2048 (C) f s 80.27 76.35 86.82
(m) CNN M 1024 (C) f s 82.55 74.85 87.89
(n) CNN M 128 (C) f s 82.90 73.99 88.13
REFERENCES
Bell, S., Upchurch, P., Snavely, N., and Bala, K. (2015).
Material recognition in the wild with the materials in
context database. In IEEE Conference on Computer
Vision and Pattern Recognition, CVPR, 2015, Boston,
MA, USA, June 7-12, 2015, pages 3479–3487.
Chatfield, K., Simonyan, K., Vedaldi, A., and Zisserman,
A. (2014). Return of the devil in the details: Delv-
ing deep into convolutional nets. In British Machine
Vision Conference, BMVC 2014, Nottingham, UK,
September 1-5, 2014.
Cimpoi, M., Maji, S., Kokkinos, I., Mohamed, S., and
Vedaldi, A. (2014). Describing textures in the wild. In
2014 IEEE Conference on Computer Vision and Pat-
tern Recognition, CVPR 2014, Columbus, OH, USA,
June 23-28, 2014, pages 3606–3613.
Csurka, G., Bray, C., Dance, C., and Fan, L. (2004). Visual
categorization with bags of keypoints. Workshop on
Statistical Learning in Computer Vision, ECCV, pages
1–22.
Dana, K. J., van Ginneken, B., Nayar, S. K., and Koen-
derink, J. J. (1999). Reflectance and texture of real-
world surfaces. ACM Trans. Graph., 18(1):1–34.
Deng, J., Dong, W., Socher, R., Li, L., Li, K., and Li, F.
(2009). Imagenet: A large-scale hierarchical image
database. In 2009 IEEE Computer Society Conference
on Computer Vision and Pattern Recognition (CVPR
2009), 20-25 June 2009, Miami, Florida, USA, pages
248–255.
Donahue, J., Jia, Y., Vinyals, O., Hoffman, J., Zhang, N.,
Tzeng, E., and Darrell, T. (2014). Decaf: A deep con-
volutional activation feature for generic visual recog-
nition. In Proceedings of the 31th International Con-
ference on Machine Learning, ICML 2014, Beijing,
China, 21-26 June 2014, pages 647–655.
Fritz, M., Hayman, E., Caputo, B., and olof Eklundh, J.
(2004). THE KTH-TIPS database.
Girshick, R., Donahue, J., Darrell, T., and Malik, J. (2014).
Rich feature hierarchies for accurate object detection
and semantic segmentation. In The IEEE Conference
on Computer Vision and Pattern Recognition (CVPR).
Girshick, R. B., Donahue, J., Darrell, T., and Malik, J.
(2013). Rich feature hierarchies for accurate ob-
ject detection and semantic segmentation. CoRR,
abs/1311.2524.
Hu, D., Bo, L., and Ren, X. (2011). Toward robust material
recognition for everyday objects. In British Machine
Vision Conference, BMVC 2011, Dundee, UK, August
29 - September 2, 2011. Proceedings, pages 1–11.
Huang, Y., Huang, K., Yu, Y., and Tan, T. (2011). Salient
coding for image classification. In Computer Vision
and Pattern Recognition (CVPR), 2011 IEEE Confer-
ence on, pages 1753–1760. IEEE.
Jia, Y., Shelhamer, E., Donahue, J., Karayev, S., Long, J.,
Girshick, R., Guadarrama, S., and Darrell, T. (2014).
Caffe: Convolutional architecture for fast feature em-
bedding. In Proceedings of the 22Nd ACM Inter-
national Conference on Multimedia, MM ’14, pages
675–678, New York, NY, USA. ACM.
Krizhevsky, A., Sutskever, I., and Hinton, G. E. (2012). Im-
agenet classification with deep convolutional neural
networks. In Advances in Neural Information Pro-
cessing Systems 25: 26th Annual Conference on Neu-
ral Information Processing Systems 2012. Proceed-
ings of a meeting held December 3-6, 2012, Lake
Tahoe, Nevada, United States., pages 1106–1114.
LeCun, Y., Boser, B., Denker, J. S., Henderson, D., Howard,
R. E., Hubbard, W., and Jackel, L. D. (1989). Back-
propagation applied to handwritten zip code recogni-
tion. Neural Computation, 1(4):541–551.
Evaluating Deep Convolutional Neural Networks for Material Classification
351

Liu, C., Sharan, L., Adelson, E. H., and Rosenholtz, R.
(2010). Exploring features in a bayesian framework
for material recognition. In The Twenty-Third IEEE
Conference on Computer Vision and Pattern Recog-
nition, CVPR 2010, San Francisco, CA, USA, 13-18
June 2010, pages 239–246.
Oquab, M., Bottou, L., Laptev, I., and Sivic, J. (2014).
Learning and transferring mid-level image represen-
tations using convolutional neural networks. In Pro-
ceedings of the 2014 IEEE Conference on Computer
Vision and Pattern Recognition, CVPR ’14, pages
1717–1724, Washington, DC, USA. IEEE Computer
Society.
Razavian, A. S., Azizpour, H., Sullivan, J., and Carls-
son, S. (2014). CNN features off-the-shelf: An as-
tounding baseline for recognition. In Proceedings of
the 2014 IEEE Conference on Computer Vision and
Pattern Recognition Workshops, CVPRW ’14, pages
512–519, Washington, DC, USA. IEEE Computer So-
ciety.
Sermanet, P., Eigen, D., Zhang, X., Mathieu, M., Fergus,
R., and LeCun, Y. (2013). Overfeat: Integrated recog-
nition, localization and detection using convolutional
networks. CoRR, abs/1312.6229.
Sharan, L., Rosenholtz, R., and Adelson, E. (2010). Mate-
rial perception: What can you see in a brief glance?
Journal of Vision, 9(8):784–784a.
Simonyan, K. and Zisserman, A. (2014). Two-stream con-
volutional networks for action recognition in videos.
In Advances in Neural Information Processing Sys-
tems 27: Annual Conference on Neural Information
Processing Systems 2014, December 8-13 2014, Mon-
treal, Quebec, Canada, pages 568–576.
Varma, M. and Zisserman, A. (2009). A statistical ap-
proach to material classification using image patch ex-
emplars. IEEE Transactions on Pattern Analysis and
Machine Intelligence, 31(11):2032–2047.
Vedaldi, A. and Zisserman, A. Recognition of object cate-
gories practical.
Wang, J., Yang, J., Yu, K., Lv, F., Huang, T., and Gong,
Y. (2010). Locality-constrained linear coding for
image classification. In Computer Vision and Pat-
tern Recognition (CVPR), 2010 IEEE Conference on,
pages 3360–3367.
Weinmann, M., Gall, J., and Klein, R. (2014). Material
classification based on training data synthesized us-
ing a BTF database. In Computer Vision - ECCV
2014 - 13th European Conference, Zurich, Switzer-
land, September 6-12, 2014, Proceedings, Part III,
pages 156–171.
Zeiler, M. D. and Fergus, R. (2014). Visualizing and under-
standing convolutional networks. In Computer Vision
- ECCV 2014 - 13th European Conference, Zurich,
Switzerland, September 6-12, 2014, Proceedings, Part
I, pages 818–833.
Zheng, S., Cheng, M., Warrell, J., Sturgess, P., Vineet, V.,
Rother, C., and Torr, P. H. S. (2014). Dense seman-
tic image segmentation with objects and attributes. In
2014 IEEE Conference on Computer Vision and Pat-
tern Recognition, CVPR 2014, Columbus, OH, USA,
June 23-28, 2014, pages 3214–3221.
VISAPP 2017 - International Conference on Computer Vision Theory and Applications
352
