
Deep Part Features Learning by a Normalised Double-Margin-Based
Contrastive Loss Function for Person Re-Identification
María José Gómez-Silva, José María Armingol and Arturo de la Escalera
Intelligent Systems Lab (LSI) Research Group, Universidad Carlos III de Madrid, Leganés, Madrid, Spain
{magomezs, armingol, escalera}@ing.uc3m.es
Keywords: Re-identification, Deep Learning, Siamese Network, Contrastive Loss Function.
Abstract: The selection of discriminative features that properly define a person appearance is one of the current
challenges for person re-identification. This paper presents a three-dimensional representation to compare
person images, which is based on the similarity, independently measured for the head, upper body, and legs
from two images. Three deep Siamese neural networks have been implemented to automatically find salient
features for each body part. One of the main problems in the learning of features for re-identification is the
presence of intra-class variations and inter-class ambiguities. This paper proposes a novel normalized double-
margin-based contrastive loss function for the training of Siamese networks, which not only improves the
robustness of the learned features against the mentioned problems but also reduce the training time. A
comparative evaluation over the challenging PRID 2011 dataset has been conducted, resulting in a remarkable
enhancement of the single-shot re-identification performance thanks to the use of our descriptor based on
deeply learned features in comparison with the employment of low-level features. The obtained results also
show the improvements generated by our normalized double-margin-based function with respect to the
traditional contrastive loss function.
1 INTRODUCTION
The person re-identification problem consists of
visually associating people across camera views at
different locations and time, this means recognizing
an individual through different images. Automating
the re-identification problem is an essential task for
large scale distributed multi-camera surveillance
systems, whose rapid expansion deals a vast quantity
of visual data to manage.
As most of the object recognition mechanisms, the
re-identification process presents two main steps.
First, the selection and computation of features to get
a person representation, and second, the matching of
two samples of the same person by means of
measuring the similarity between them. However,
visual appearance based matching becomes a
remarkable challenge in unconstrained scenarios,
where large changes occur in view angle,
illumination, background, occlusion, and resolution,
producing huge differences in a person’s appearance
among different camera views.
In order to face this problem, a large amount of
research has been focused on the design of novel
visual features able to represent the most discriminant
aspects of an individual’s appearance, which are
invariant to pose, scale and illumination. Some of the
most commonly used representations, like RGB or
HSV histograms (Bazzani, 2013), Gabor filters
(Zhang, 2011) and HOG-based signatures (Oreifej,
2010), are based on low-level local features, such as
color, texture, and shape respectively. With the aim
of integrating several types of features with
complementary nature, like the used ones in
(Farenzena, 2010), into a global signature, bag-of-
words (BoW) model has been widely employed. In
(Ma, 2014), BoW model is improved by means of
using the Fisher Vector, (Sánchez, 2013), which
encodes higher order statics of local features. Other
relevant methods to fuse different modalities of
features are the ones based on covariance descriptors,
extensively used in feature-oriented approaches, such
the method proposed in (Corvee, 2010).
To improve the robustness to partial occlusions,
region-based approaches decompose a human body
image in different articulated parts and extract
features for each one. In that way, spatial information
is also integrated into the feature representation. In
(Bazzani, 2014), a symmetry-based silhouette
partition is used to detect salient body regions.
Gøsmez-Silva M., Armingol J. and de la Escalera A.
Deep Part Features Learning by a Normalised Double-Margin-Based Contrastive Loss Function for Person Re-Identification.
DOI: 10.5220/0006167002770285
In Proceedings of the 12th International Joint Conference on Computer Vision, Imaging and Computer Graphics Theory and Applications (VISIGRAPP 2017), pages 277-285
ISBN: 978-989-758-227-1
Copyright
c
2017 by SCITEPRESS – Science and Technology Publications, Lda. All rights reserved
277

Recently, research has been focused on the reduction
of the number of high-level representations used to
describe a person. Instead of using traditional
dimensionality reduction methods, such as Principal
Component Analysis (PCA), many re-identification
algorithms choose an attributes-based approach,
allowing a description, which is semantically
meaningful to humans. In (Layne, 2014) attributes as
hair or clothing style are combined with low-level
features.
An alternative solution to the feature selection
problem is the use of deep learning algorithms, which
provides a useful tool to automatically find salient
high-level representations from an image. These
algorithms usually train a neural network model with
a high number of layers by means of a supervised
learning process. Deep Convolutional Neural
Networks have commonly been trained to perform
object recognition or classification tasks, such as in
the work presented in (Krizhevsky, 2012).
The deep Siamese networks, recently employed in
re-identification field, allow the learning of high-level
features by means of modelling the similarity
between a pair of images. The approach presented in
(Yi, 2014) not only uses Siamese networks to learn
deep features but also to address a distance metric
learning jointly. A Siamese network consists of two
convolutional neural networks sharing parameters
and joined in the last layer. In this last layer, the loss
function leads the whole network to discriminate
between pairs of similar or dissimilar images.
Therefore, the re-identification task is treated as a
pairwise classification problem. In order to reduce
the intra-class variation and highlight the inter-class
variation, the contrastive loss function, described in
(Hadsell, 2006), has been widely employed as loss
function in the last layer of deep Siamese networks.
The matching process in re-identification consists
of recognising the person shown by an image that has
been selected in one view (probe image) in all the
images from another view (gallery images). This is
achieved by calculating the distances between the
probe image and all gallery images using the
extracted features, and returning those gallery images
with the smallest distances as potential matches.
In this paper, a novel three-dimensional
representation to describe the similarity between two
images is proposed. The human shape has been
divided into three parts: head, body, and legs. For
each part, a deep Siamese Network has been
implemented to model the appearance similarity
between this body part from different images. The
result is the learning of three similarity distances
(head, body, legs) whose computation gives the value
of each one of the components of our three-
dimensional descriptor.
With the aim of obtaining a single value metric to
perform the re-identification matching, the
comparison between two images has been calculated
as the module of our three-dimensional descriptor.
The main contributions presented in this paper are
the improvements performed over the contrastive loss
function originally employed in Siamese networks. In
the first place, a new formulation based on two
margins instead of only one is proposed.
Subsequently, a second enhancement has been
achieved by means of implicitly including the
normalization of the compared features in the loss
function. This novel loss function allows to obtain
more discriminative features, which present more
robustness against intra-class variations and inter-
class ambiguities, as well as, a faster training stage,
due to the reduction in the number of the required
iterations.
The re-identification capacity of our method has
been evaluated over the challenging PRID 2011
dataset (Hirzer, 2011), proving the improvement
obtained with the use of our normalized double
margin-based loss function, in comparison with the
traditional one. Furthermore, these results have been
compared with a re-identification method based on
low-level features, highlighting the advantages of
employing deep features.
The rest of the paper is organized as follows.
Section 2 describes the proposed approach, Section 3
presents the experimental results obtained, and some
concluding remarks are given in Section 4.
2 THE PROPOSED METHOD
Considering the person re-identification task as an
isolated module of a more complex surveillance
system, its objective is to recognize a certain person
rendered in an image that has been selected in one
camera view (probe images), in all the images from
another view (gallery images). Therefore, it is
assumed that these person images have been
previously detected in both non-overlapping camera
views.
In this paper, that re-identification goal is
achieved by calculating the distances between the
probe image and all gallery images using a 3D deep
feature. Our 3D descriptor measures the degree of
similarity between two images. Therefore,
understanding the descriptor as a vector, its module
should present the smallest values for the matchings
between the images rendering the same person.
VISAPP 2017 - International Conference on Computer Vision Theory and Applications
278
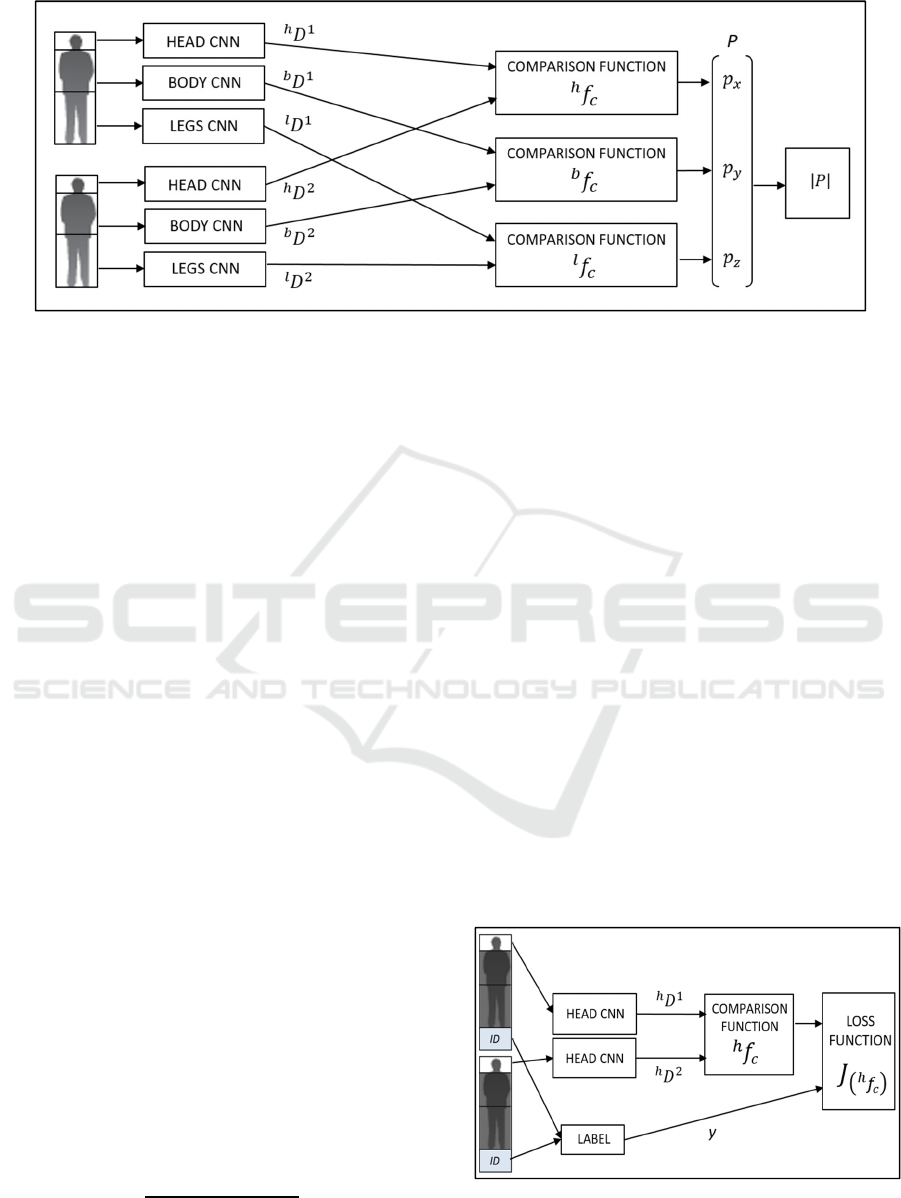
Figure 1: Re-identification Method Architecture.
The following sections present the architecture of this
re-identification method, the training of the deep
features models, the formulation of the new loss layer
employed, and the interpretation of our descriptor as
a 3D point, or as a Euclidean distance.
2.1 Re-Identification Method
Architecture
The proposed re-identification method follows the
architecture presented in Figure 1, as explained
bellow.
To measure the similarity between two person
images, firstly, each image is divided into three parts
roughly corresponding to the head, upper body, and
legs, using the human shape proportions. Secondly, a
Convolutional Neural Network (CNN) computes a
multi-dimensional descriptor,
, for each one of
the mentioned parts, whose formulation is shown in
(1), where the index bp represents one of the labels h,
b, and l, to refer to the head, upper body or legs
descriptor respectively. The index i takes the values 1
or 2 corresponding to each one of the two input
images. Every element of the array descriptor
presents the form
, where the index j represents
each one of the elements of the descriptor array.
Therefore, j can take values from 1 to N, being N the
dimension of the descriptor. The value of N is 100 for
, and 200 for
and
.
,…,
(1)
Subsequently, for every body part, bp, a comparison
function,
, calculates the distance between the
multi-dimensional descriptors obtained for the two
images, as in (2).
∑
(2)
The distance obtained for each body part comparison
is an element of a three-dimensional descriptor
P
,
,
, as it is set in (3), (4) and (5). The
module of this vector is then calculated and employed
as the metric to measure the appearance differences
between the images.
(3)
(4)
(5)
2.2 Siamese Deep Neural Network
Training
In order to train each one of the three Convolutional
Neural Networks used in the proposed re-
identification method, a deep Siamese architecture
has been configured. For each body part, a training
process has been conducted using a Siamese network.
The training is supervised, therefore the images must
be labelled with an identification number, ID, which
represents the identity of the rendered person.
Figure 2: Siamese deep training algorithm for head CNN.
Deep Part Features Learning by a Normalised Double-Margin-Based Contrastive Loss Function for Person Re-Identification
279
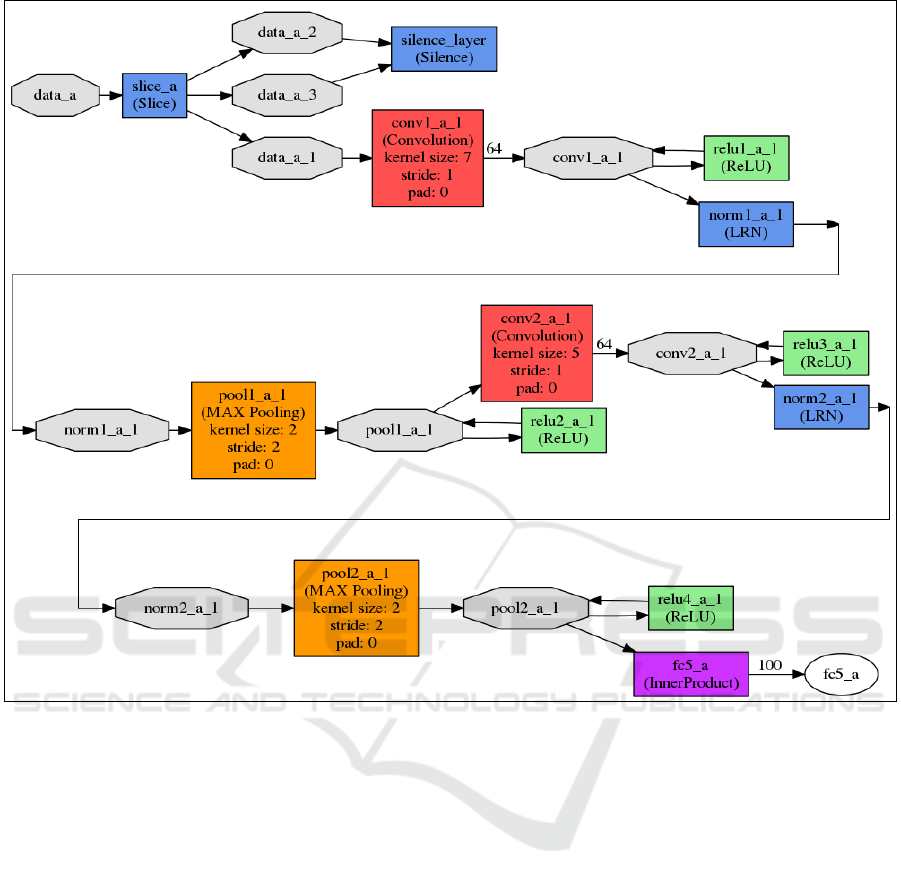
Figure 3: Convolutional Neural Network model.
Figure 2 shows the Siamese network employed to
train the head model. This model follows a CNN
architecture traditionally applied in computer vision
classification, which is shown in Figure 3. This neural
network is considered as a deep one because of the
relatively high number of layers compounding it,
whose implementations have been performed using
the Caffe libraries (Jia, 2014). The essential layers of
this network are two convolutional layers, two max-
pooling layers and an inner product layer, which is a
fully connected layer whose number of outputs is
equal to N, (1). The main parameters of the layers are
presented in Figure 3, where each layer is named with
the following combination of several fields
layernameR_i_bp. The layername field indicates the
layer type; R only is needed when more than one layer
of the same type is used in the model and takes
different values in order to differ those layers; i
represents the labels a and b to refer to each one of
the two input images, and bp takes the values 1, 2, or
3, corresponding to each body part, i.e. head, upper
body, and legs, respectively.
With the aim of learning the CNN weights values,
this model is duplicated. The input of each one of the
two obtained identical models is each one of the
images to be compared. Therefore, two CNN sharing
their parameters are joined by means of the
comparison function, (2). Moreover, a labeller layer
takes the identification numbers as inputs and its
output, y, values 1 if the IDs are the same number and
0, otherwise.
During the training, by means of the forward and
back propagation method (Rumelhart, 1988), the
parameters of both CNN are lead to values which
make the comparison function,
, get closer to
certain objective values. The objective values for the
comparison function, both when y equals to 1 and 0,
are defined in the loss function,
. This function
measures the deviation of the comparison function
value from the objective ones.
VISAPP 2017 - International Conference on Computer Vision Theory and Applications
280
2.3 Loss Function
Siamese networks have commonly been trained using
the contrastive loss function, presented in (6), as loss
function,
.
is a constant parameter called
margin, and B is the batch size which means the
number of pairs used to compute the cost function in
every iteration. θ is an array, whose elements,
,
are
the distances computed by the comparison function
for each one of the images pair of a batch of B
samples, i.e.
is the
of the sample n.
This equation measures the half average of the
error computed for every pair, taking into account
both cases, when the input images patches belong to
the same person, positive pair (y=1), or to different
ones, negative pair (y=0). The contribution of a
positive and a negative pair to the loss function are
described by (7) and (8), respectively.
1
2
1
,0
(6)
(7)
,0
(8)
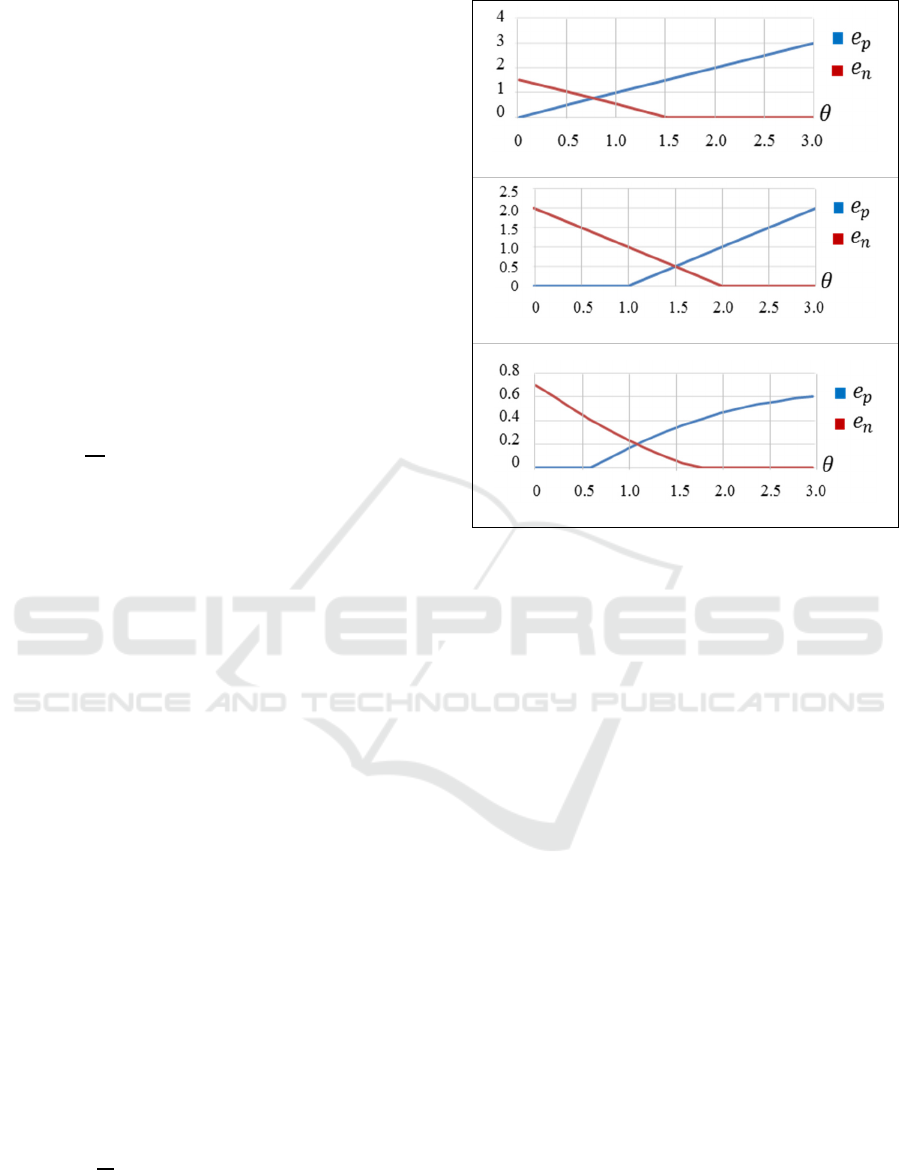
According to (7), positive samples cause an error or
loss even when the distance measured is under the
value of the margin given, as is shown in Figure 4a.
This loss leads the training to learn features which
make the distance between images null, causing at the
same time that the distance corresponding to quite
negative samples is also lower than the margin, m,
also causing an increment of the total loss. Therefore,
the total loss value oscillates throughout the training
due to the difficulty of leading the distances in
positive samples near the zero value, as Figure 5a
shows.
One of the main contributions of this paper is the
design of a new contrastive loss function based on
two margins. These two margins establish the
separation between the objective values of the
distances (calculated for the comparison function) for
positive and negative samples. The result of using two
margins is an increment in the discriminative capacity
of the learned features.
The formulation of the double-margin-based
contrastive function is described in (9), where
and
are two constant parameters called margins, and
B is the batch size, being each element,
,
the
distance computed by the comparison function,
,
for the sample n.
∑
,0
1
,0
(9)
(a)
(b)
(c)
Figure 4: Loss contribution of a positive,
, and
negative,
, single pair sample caused by the loss function
in the cases: (a) using the traditional contrastive loss
function, (6), with m=1.5 and
; (b) using the
double-margin contrastive loss function (9) with
1and
=2 when
and (c) using the double-margin
contrastive loss function, (9), with
0.3and
=0.7
when
.
The contribution of a positive and a negative pair to
the loss function, (9), are described by (10) and (11),
respectively.
,0
(10)
,0
(11)
According to (10) and (11), no loss is caused by
positive samples with a distance value lower than the
first margin,
, and negative samples with a distance
higher than the second margin,
, as is shown in
Figure 4b. The function forces the comparison values
obtained for positive pairs to be lower than the first
margin, and those obtained with negative pairs to be
higher than the second margin. This results in a
reduction in the amplitude of the oscillation in the
total loss value throughout the training process, as
well as in a decrease in the value around which the
loss function oscillates. Furthermore, such a value is
achieved in a lower number of iterations, becoming
the learning process faster, as Figure 5b shows.
Deep Part Features Learning by a Normalised Double-Margin-Based Contrastive Loss Function for Person Re-Identification
281
(a)
(b)
Figure 5: Loss function evaluated over a cross-validation
set of samples throughout the training process of the head
part in the cases: (a) using the traditional contrastive loss
function, (6); and (b) using the double-margin contrastive
loss function, (9).
The selection of the margins values is a critical
issue which depends on the range of values presented
by the distances,
. However, this range varies
along the training process. For that reason, a new
intermediate step of normalization has been added
with the goal of obtaining normalized distances,
, with a range of values [0,1). The distances
calculated by the comparison function
, are
normalized by the function presented in (12).
2
1
1
0.5
(12)
Subsequently, the normalized distances,
, are
the inputs,
,
of the loss function, (9), whose margin
parameters have been set with the values
0.3
and
=0.7. The loss contribution of a positive
sample, (10), and a negative sample, (11), in function
of the value of the distance
present a slightly
different shape, as Figure 4c shows.
2.4 Three-Dimensional Feature Module
Once the deep features for head, upper body, and legs
have been learned, the distances computed by the
comparison function for each one of them,
,
and
, respectively, constitute the elements of our
three-dimensional descriptor, P, according to Figure
1. The last step to obtain a single metric to measure
the appearance difference between person images is
the computation of the module of P, as in (13).
|
|
(13)
The descriptor P can be understood as a 3D point, and
consequently, its module,
|
|
, is the distance from the
origin of the coordinates system to the 3D point P.
Figure 6 represents that point for a test set of images
pairs. The point positions for positive samples are
nearer the origin than those for the negative ones,
proving that the training process has been effectively
conducted.
(a)
(b)
Figure 6: Three-dimensional representation of descriptor P,
in green for positive samples, and in red for the negative
samples for a test set in the cases: (a) using one margin
contrastive loss function, (6), in the training, and (b) using
double-margin contrastive loss function, (9), in the training.
The result of a proper training is the formation of
two separated clusters, those formed by the points
representing the positive samples and the negative
ones. The separating boundary between them is a
VISAPP 2017 - International Conference on Computer Vision Theory and Applications
282

cube, whose dimension is the value of the margin
parameter employed in the loss function. Therefore,
if the loss function employed is based on only one
margin, m, like the traditional contrastive loss
function, (6), the points representing positive samples
should be inside a cube of dimension m, and the
negatives outside, as Figure 6a shows.
If the novel double-margin contrastive loss function,
(9), is employed, the resulting clusters present a
bigger separation between them, which means that
more discriminative features have been learned. The
points representing positive samples should be inside
a cube of dimension
, and the negatives outside a
larger cube of dimension
, as Figure 6b shows.
2.5 Euclidean Distance as Metric
Distance
A common approach for the re-identification task
consist of the extraction of a number of features and
subsequently the computation of a metric distance to
measure the appearance similarity between two
person images from their vectors of features.
Following that structure, the vector of features
extracted, for each image i, by the proposed method
is an array of 500 deep features,
, which is
formed by means of concatenating the vectors of
features calculated for head, upper body and legs,
,
and
respectively, as in (14).
,…,
,
,…,
,
,…,
(14)
The metric distance used by our method is the
Euclidean distance, as can be deducted from the
computation of P module, (13). Taking into account
that the elements of P are the distances calculated by
the comparison function for each one of the body
parts, the module of P can be computed as (15)
presents. Using (2) to substitutes each one of the
distances, the modules computation takes the form
shown in (16), which is clearly the formulation for the
Euclidean distance between
and
.
|
|
(15)
|
|
(16)
3 EXPERIMENTAL RESULTS
In this section, the evaluation method is described, as
well as the dataset used to perform the different tests.
Finally, the obtained results are presented and
discussed.
3.1 Evaluation
The Cumulative Matching Characteristic (CMC)
curve (Moon, 2001) has been calculated in order to
evaluate the performance of the proposed re-
identification method. The CMC, which is a standard
performance measurement, renders the matching rate
for each rank, r, i.e. the expectation of finding the
correct match within the top r matches.
To obtain the CMC curve, first, every image from
the probe set is matched with all the images from the
gallery set, considering as top matches those which
present the lowest values for the module of our three-
dimensional descriptor,
|
|
.
3.2 Dataset
The tests have been performed on one of the most
widely used datasets for evaluating re-identification
approaches, the PRID 2011 dataset (Hirzer, 2011).
This dataset is formed by person images recorded
from two different static cameras, presenting
substantial differences in camera parameters,
illumination, person poses, and background. Two
versions are provided, single-shot, that contains only
one image for each person from each camera, and
multi-shot that presents several images for each
person and each camera. In this work, the first one has
been selected, where camera view A contains 385
individuals, and camera B, 749. There are 200 of
these pedestrians appearing in both views, which are
randomly divided into two groups of 100 individuals,
one used in the training process, and the other in the
test, that is the CMC curve computation. For
evaluation on the test set, the procedure described in
(Hirzer, 2011) is followed, i.e., the images of view A
for the 100 individuals selected as test set has been
used as probe set, and the gallery set has been formed
by 649 images belonging to camera view B (all
images of view B except the 100 corresponding to the
training individuals).
3.3 Results
The tests performed involve the computation of the
CMC curve using the PRID 2011 dataset as it has
been explained above.
Deep Part Features Learning by a Normalised Double-Margin-Based Contrastive Loss Function for Person Re-Identification
283
Three versions of the re-identification method
proposed in this paper have been tested, according to
the loss function used to learned the deep features:
Deep Features Learned by One Margin-based
contrastive loss function (6), (DFL-1M).
Deep Features Learned by Double Margin-based
contrastive loss function (9), (DFL-2M).
Deep Features Learned by Normalized Double
margin-based contrastive loss function (9) y (12),
(DFL-N2M).
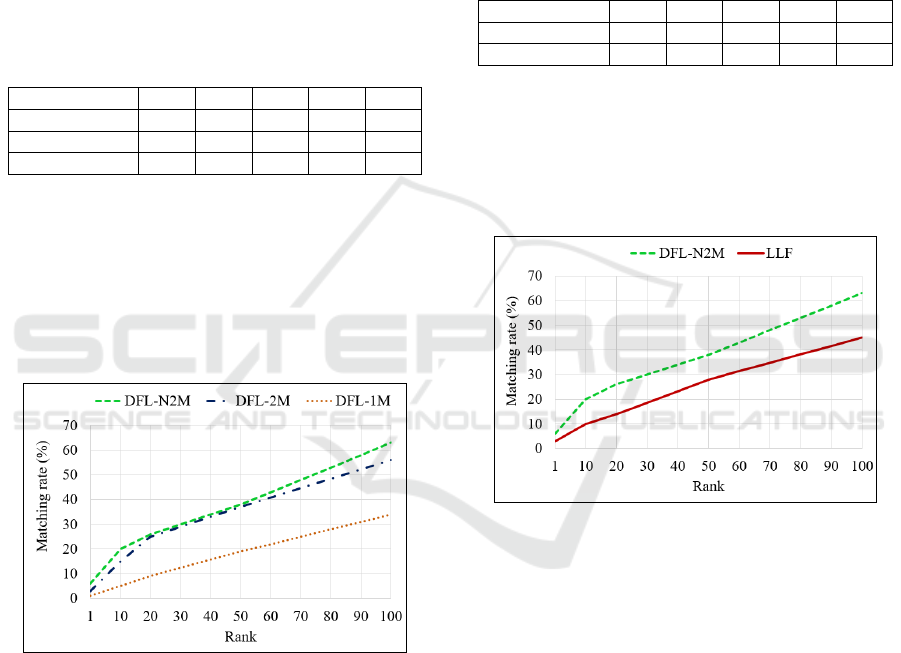
The CMC scores are presented in Table 1, and the
corresponding curves are plotted in Figure 7.
Table 1: CMC scores (%) for three versions of the proposed
re-identification method.
Rank 1 10 20 50 100
DFL-1M 1 5 9 19 34
DFL-2M 3 15 25 37 56
DFL-N2M 6 20 26 38 63
The use of our novel double-margin based
contrastive loss function cause remarkable
improvement in the performance of the re-
identification method. In addition, the normalization
of the distances considered by that loss function also
lightly enhances the obtained results. For that reason,
this last version has been selected as the definitive one
to be implemented in our re-identification algorithm.
Figure 7: CMC curves for Three Versions of the Proposed
Re-Identification Method.
In order to evaluate the effect of using deeply learned
features instead of other low-level features (LLF)
selected, our method performance has been compared
with an algorithm based on the Euclidean distance
between color and texture features, extracted as
(Hirzer, 2012) describes. This algorithm has been
selected because our algorithm can be understood as
the computation of the Euclidean distance between
the deep features computed for each image of a pair,
as it has been explained in section 2.5. In that way,
since the distance metric used for both of the
compared methods is the Euclidean distance, the
difference in the performance is only due to the use
of deeply learned features in contrast to low-level
ones.
The CMC scores for both approaches are
presented in Table 2, and the corresponding curves
are plotted in Figure 8.
Table 2: CMC scores (%) for the proposed Re-
Identification method and a method based on Low-Level
Features.
Rank 1 10 20 50 100
DFL-N2M 6 20 26 38 63
LLF 3 10 14 28 45
The automatic selection of features provided by the
proposed deep learning algorithm results in a
considerable improvement of the re-identification
performance compared with the computation of low-
level features based on color and texture, which have
been traditionally employed.
Figure 8: CMC curves for the Proposed Re-Identification
method and other based on Low-Level Features.
4 CONCLUSIONS
This paper presents a re-identification approach based
on the learning of deep features for different body
parts, providing a three-dimensional descriptor which
results in a notable improvement in the performance
in comparison with an algorithm based on low-level
features.
In addition, the traditional contrastive loss
function employed in the learning process has been
enhanced by the design of a novel formulation based
on two margins and the normalization of the variable
on which it depends.
The evaluation of the proposed method has been
performed over a highly challenging dataset, the
VISAPP 2017 - International Conference on Computer Vision Theory and Applications
284

PRID 2011 dataset, that presents many of the
variations occurring in a real world surveillance
scenario, such as changes in human pose,
illumination, background, and even camera
parameters. The evaluation results demonstrate that
deeply learned features provide more robustness
against these challenges than low-level features based
on color and texture.
The conducted tests have proved the remarkable
improvement in the performance due to the use of the
new loss function. This normalized double margin-
based loss function leads the training process to learn
more discriminative features, which reduces the intra-
class variation and highlights the inter-class variation.
Moreover, the proposed new loss function makes the
training process faster, since an acceptable model is
learned in a lower number of iterations, thanks to the
use of two margin parameters.
The obtained results present the normalized
double-margin contrastive loss function as a
potentially useful tool in the learning of appearance
similarity descriptors for multiple applications, as
well as, in the learning of a distance metric to get the
proper weighting of the deep features in the
construction of the optimal discriminative descriptor
for re-identification.
ACKNOWLEDGEMENTS
This work was supported by the Spanish Government
through the CICYT project (TRA2013-48314-C3-1-
R), (TRA2015-63708-R) and Ministerio de
Educación, Cultura y Deporte para la Formación de
Profesorado Universitario (FPU14/02143), and
Comunidad de Madrid through SEGVAUTO-TRIES
(S2013/MIT-2713).
REFERENCES
Bazzani, L., Cristani, M. and Murino, V., 2013. Symmetry-
driven accumulation of local features for human
characterization and re-identification. Computer Vision
and Image Understanding, 117(2), pp.130-144.
Bazzani, L., Cristani, M. and Murino, V., 2014. SDALF:
modeling human appearance with symmetry-driven
accumulation of local features. Person Re-
Identification, pp. 43-69. Springer London.
Corvee, E., Bremond, F. and Thonnat, M., 2010. Person re-
identification using spatial covariance regions of
human body parts. Advanced Video and Signal Based
Surveillance (AVSS), 2010 Seventh IEEE International
Conference on, pp. 435-440. IEEE.
Farenzena, M., Bazzani, L., Perina, A., Murino, V. and
Cristani, M., 2010. Person re-identification by
symmetry-driven accumulation of local features.
Computer Vision and Pattern Recognition (CVPR),
2010 IEEE Conference on, pp. 2360-2367. IEEE.
Hadsell, R., Chopra, S. and LeCun, Y., 2006.
Dimensionality reduction by learning an invariant
mapping. 2006 IEEE Computer Society Conference on
Computer Vision and Pattern Recognition (CVPR'06),
Vol. 2, pp. 1735-1742. IEEE.
Hirzer, M., Beleznai, C., Roth, P. M. and Bischof, H., 2011.
Person re-identification by descriptive and
discriminative classification. Scandinavian conference
on Image analysis, pp. 91-102. Springer Berlin
Heidelberg.
Hirzer, M., Roth, P. M., Köstinger, M. and Bischof, H.,
2012. Relaxed pairwise learned metric for person re-
identification. European Conference on Computer
Vision, pp. 780-793. Springer Berlin Heidelberg.
Jia, Y., Shelhamer, E., Donahue, J., Karayev, S., Long, J.,
Girshick, R., Guadarrama, S. and Darrell, T., 2014.
Caffe: Convolutional architecture for fast feature
embedding. Proceedings of the 22nd ACM
international conference on Multimedia, pp. 675-678.
ACM.
Krizhevsky, A., Sutskever, I. and Hinton, G. E., 2012.
Imagenet classification with deep convolutional neural
networks. Advances in neural information processing
systems, pp. 1097-1105.
Layne, R., Hospedales, T. M. and Gong, S., 2014.
Attributes-based re-identification. Person Re-
Identification, pp. 93-117. Springer London.
Ma, B., Su, Y. and Jurie, F., 2014. Discriminative Image
Descriptors for Person Re-identification. Person Re-
Identification, pp. 23-42. Springer London.
Moon, H. and Phillips, P. J., 2001. Computational and
performance aspects of PCA-based face-recognition
algorithms. Perception, 30(3), 303-321.
Oreifej, O., Mehran, R. and Shah, M. 2010. Human identity
recognition in aerial images. Computer Vision and
Pattern Recognition (CVPR), 2010 IEEE Conference
on, pp. 709-716. IEEE.
Rumelhart, D. E., Hinton, G. E. and Williams, R. J., 1988.
Learning representations by back-propagating
errors. Cognitive modeling, 5(3), 1.
Sánchez, J., Perronnin, F., Mensink, T. and Verbeek, J.,
2013. Image classification with the fisher vector:
Theory and practice. International journal of computer
vision, 105(3), pp.222-245.
Yi, D., Lei, Z., Liao, S. and Li, S. Z., 2014. Deep Metric
Learning for Person Re-identification. ICPR, Vol.
2014, pp. 34-39.
Zhang, Y. and Li, S., 2011. Gabor-LBP based region
covariance descriptor for person re-identification.
Image and Graphics (ICIG), 2011 Sixth International
Conference on, pp. 368-371. IEEE.
Deep Part Features Learning by a Normalised Double-Margin-Based Contrastive Loss Function for Person Re-Identification
285
