
Dispersion-scan Measurements of the Multiplate Continuum Process
Miguel Canhota
1
, Rosa Weigand
2
and Helder Crespo
1
1
IFIMUP-IN e Departamento de F
´
ısica e Astronomia, Faculdade de Ci
ˆ
encias, Universidade do Porto,
Rua do Campo Alegre 687, 4169-007 Porto, Portugal
2
Departamento de
´
Optica, Facultad de Ciencias F
´
ısicas, Avda. Complutense s/n,
Universidad Complutense de Madrid, 28040 Madrid, Spain
Keywords:
Ultrafast Optics, Dispersion-scan, Pulse Compression, Pulse Measurement, Multiplate Continuum, Supercon-
tinuum Generation.
Abstract:
Multiplate continuum (MPC) is a recent supercontinuum generation technique for spectral broadening of ul-
trashort laser pulses. In this work, we report the first direct temporal characterization of ultrashort laser pulses
generated by the MPC process, without any further pulse manipulation apart from dispersion compensation,
using the dispersion scan technique.
1 INTRODUCTION
The first reports on large spectral broadening of pi-
cosecond laser pulses - supercontinuum generation -
were done in the 1970s (Alfano, 2013). This nonlin-
ear optical phenomenon occurs in solids (bulk media,
optical fibers, photonics crystal fibers), liquids and
gases. It has major applications in ultrashort pulse
compression, ultrafast laser spectroscopy (Lindfors
et al., 2004), optical coherence tomography (Hum-
bert et al., 2006), telecommunications (Takara et al.,
2005), and application in carrier-envelope phase sta-
bilization of mode-locked lasers (Dudley J.M., 2010).
Supercontinuum generation in bulk media has
several practical advantages, but suffers from a major
drawback, i.e., it cannot be used with high peak power
pulses; the lower damage threshold in solids render
them unattractive for high power applications. While
the generation of supercontinuum in solids is readily
available for peak powers of MW (Silva et al., 2012),
no other method for the generation of high power su-
percontinuum in solids was available until the intro-
duction of the multiplate continuum (MPC), which
uses a set of thin slides of glass (e.g. fused silica).
This enables spectral broadening in each plate, while
avoiding damage to the medium due to self-focusing
(Lu et al., 2014).
The dispersion-scan (d-scan) technique (Miranda
et al., 2012) is a recent but well-established method
for the measurement of ultrashort laser pulses. It re-
lies on the manipulation of the total dispersion in-
curred by the pulse while traveling through a standard
pulse compressor setup comprised of dispersion com-
pensation mirrors (DCMs) and a pair of glass wedges.
The amount of glass traversed by the pulse is an in-
dependent variable that can be controlled with the
simple insertion of one of the wedges. While the
DCMs impart negative dispersion, the variable pos-
itive dispersion introduced by the wedges will vary
the total dispersion of the pulse to be measured. In
the case of the second-harmonic variant of the d-
scan (SHG d-scan), the measurement of the second-
harmonic signal after the compressor results in a two-
dimensional trace of the SHG spectrum versus glass
insertion. With the measured trace, together with
the linear spectrum of the light source, it is possible
to retrieve the spectral phase of the pulse under test
through a mathematical optimization algorithm, and
thus, reconstruct its full temporal profile.
2 EXPERIMENTAL SETUP
Our laser system is composed of a Ti:Sapphire
chirped pulse amplifier (Femtolasers FemtoPower
Compact Pro CEP) seeded by pulses from a few-
cycle, prismless Ti:Sa oscillator (Femtolasers Rain-
bow), with 0.8 mJ of pulse energy in sub-30-fs pulses
at an repetition rate of 1 kHz. Only a fraction of
this output power will be used for the present exper-
iment. The experimental setup (Figure 1) comprises
two main parts: the spectral broadening process, i.e.,
the MPC, and the ultrafast pulse measurement part,
the d-scan. The MPC part begins with a f=1 m lens
Canhota M., Weigand R. and Crespo H.
Dispersion-scan Measurements of the Multiplate Continuum Process.
DOI: 10.5220/0006167802690272
In Proceedings of the 5th International Conference on Photonics, Optics and Laser Technology (PHOTOPTICS 2017), pages 269-272
ISBN: 978-989-758-223-3
Copyright
c
2017 by SCITEPRESS – Science and Technology Publications, Lda. All rights reserved
269
that focuses our input beam onto a stack of six un-
evenly spaced, thin (100 µm) slides of fused silica
placed at Brewster’s angle. The uneven spacing is
motivated by simulations (Cheng et al., 2016), as well
as by the criterion of obtaining the broadest spectrum
as we place each individual slide in the setup while
minimizing spatial wavefront distortions due to self-
focusing. Both factors show that the spacing between
successive slides gets shorter. The long focal length of
the lens gives us a wide Rayleigh range that fully en-
velopes the slide stack, ensuring that the electric field
strength is high enough to induce spectral broaden-
ing. The emerging beam, with its successively broad-
ened spectrum is then collimated by a concave mirror
and directed to a pair of dispersion compensation mir-
rors (DCMs) which impart negative dispersion to the
pulse. We record the second-harmonic signal gener-
ated by a 5 µm thick nonlinear BBO crystal cut for
type-I SHG as a function of wedge insertion, hence
obtaining the d-scan trace of the pulses shown in Fig-
ure 2. The simplicity and performance of the d-scan
setup was one of the deciding factors on the choice of
this measurement method, compared with other con-
ventional techniques like SPIDER (Anderson et al.,
2008) and FROG (Trebino et al., 1997). Another con-
venient factor is the fact that after making the sweep
and obtaining the d-scan trace we can immediately
set the necessary amount of glass insertion, so that
the pulse at the exit of the wedges is as compressed as
possible for the given setup.
MPC
D-scan
Spectrometer
DCM
BBO
Wedges
Plates
~25 fs
~12,5 fs
Parabolic
mirror
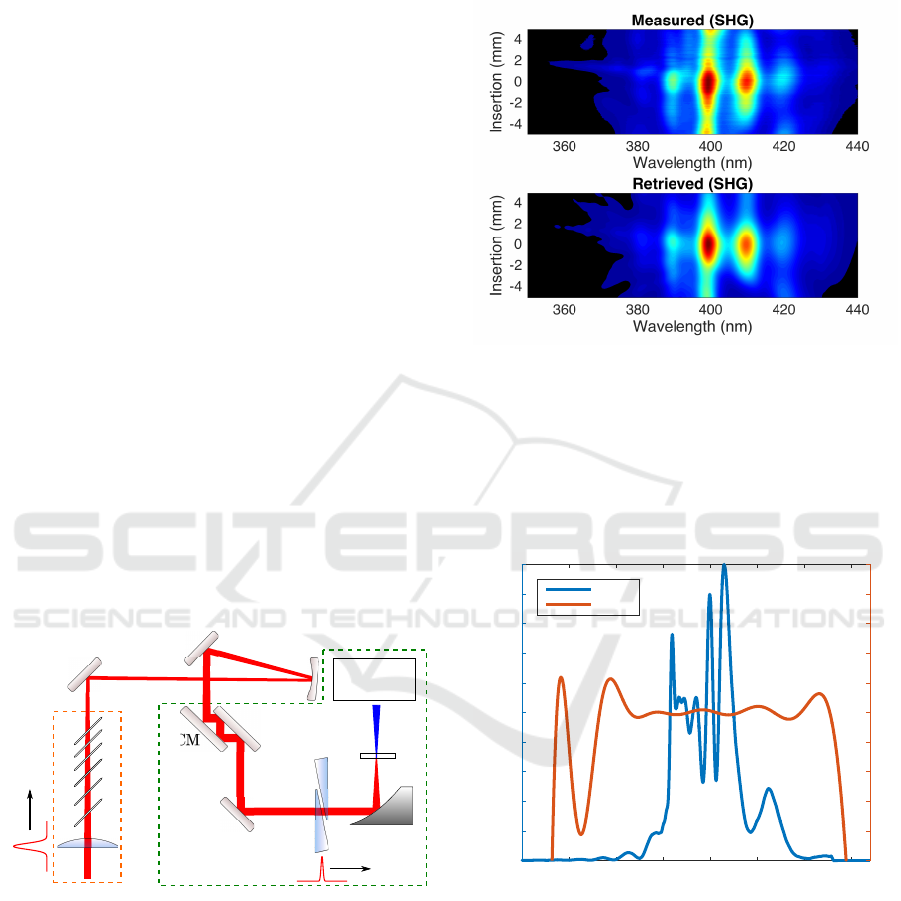
Figure 1: Experimental setup of the MPC and the d-scan.
3 RESULTS
As mentioned previously, the d-scan trace is a two-
dimensional plot of the second harmonic spectrum as
a function of glass insertion. As the total spectral
phase of the pulse under test changes from negative
to positive, it passes through a point where the pulse
is well compressed, i.e, the second-harmonic signal
achieves a maximum. This position is relabeled as the
point of zero insertion, as shown in Figure 2, which
contains the measured and numerically retrieved d-
scan traces.
Figure 2: Measured and retrieved d-scan traces.
Even though the measured trace has a complex
structure, we were able to get a retrieved trace that
closely resembles the measured one, i.e., it is able to
reproduce the main features of the measured trace.
The spectrum and retrieved spectral phase of the
MPC pulse is shown in Figure 3.
600 650 700 750 800 850 900 950
Wavelength (nm)
0
0.1
0.2
0.3
0.4
0.5
0.6
0.7
0.8
0.9
1
Arb. units
-10
-8
-6
-4
-2
0
2
4
6
8
10
Spec.
Phase
Figure 3: Spectrum and spectral phase of the measured
pulse.
Although the broadest high power supercontin-
uum is currently generated in gas-filled hollow fiber
compressors, e.g. (Silva et al., 2014; B
¨
ohle et al.,
2014), the supercontinuum generated by MPC is still
significant.
The measured linear spectrum and the retrieved
spectral phase gives us full information to completely
reconstruct the temporal profile of the pulse under
test, as shown in Figure 4.
PHOTOPTICS 2017 - 5th International Conference on Photonics, Optics and Laser Technology
270
-60 -40 -20 0 20 40 60
Time (fs)
0
0.1
0.2
0.3
0.4
0.5
0.6
0.7
0.8
0.9
1
Norm. intensity
TL: 9.8 fs
Measured: 12.5 fs
Figure 4: Retrieved pulse and transform-limited pulse.
We see that the retrieved pulse has twice the dura-
tion compared with the transform-limited (TL) pulse
(ie., a pulse with same spectrum but with a flat spec-
tral phase).
The pulses generated by MPC are longer than the
pulses generated in a hollow-core fiber (Silva et al.,
2014) by a factor of 3, but nonetheless this kind
of setup has its own advantages, such as compact-
ness (it occupies a small space), simplicity (can be
implemented with off-the-shelf optical components),
robustness (less dependent on alignment, whereas
hollow-core fibers setups normally require feedback
loops to keep a good alignment for a long period of
time), high efficiency, and does not involve the han-
dling of gases within a vaccuum system.
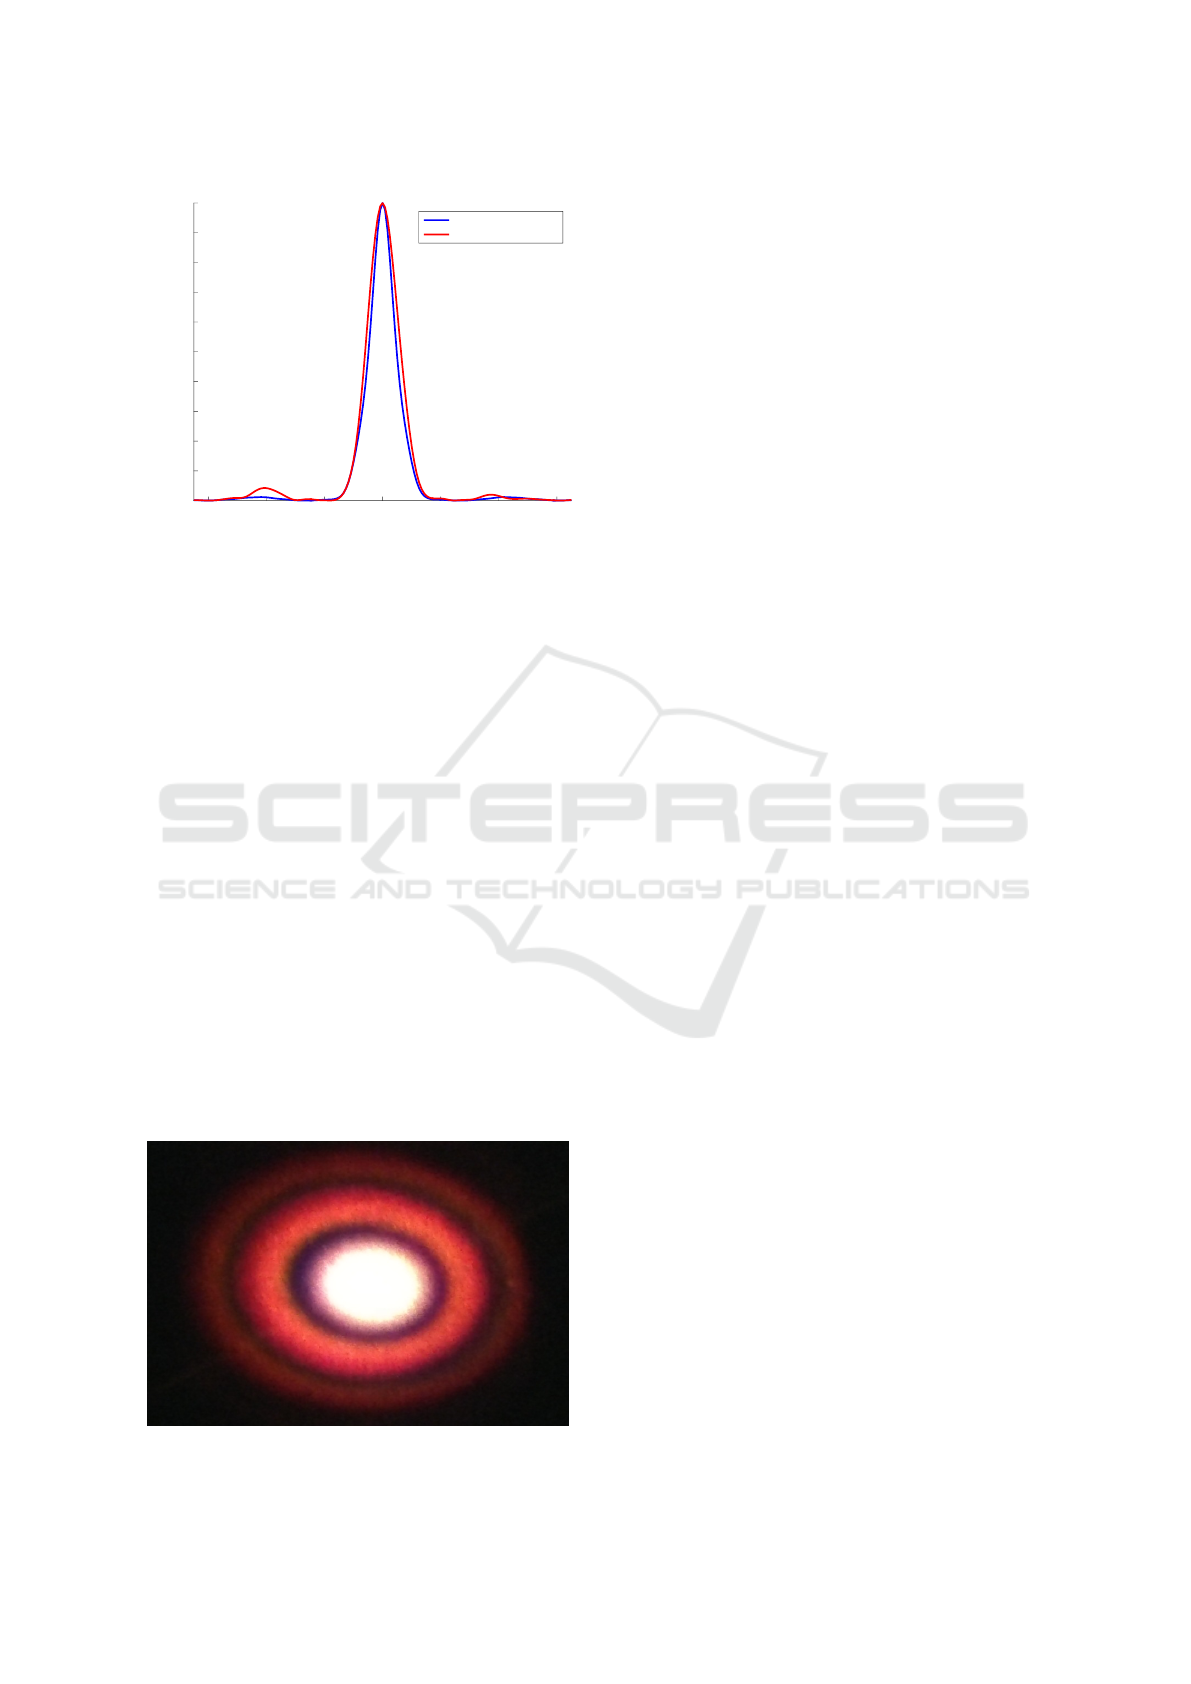
The output power of the MPC process is roughly
50 % of the 140 mW of input average power. The
output beam profile is shown in Figure 5; it is homo-
geneous and most of the power is concentrated in the
central part. Hence, the central part was spatially fil-
tered by an iris (not shown in Figure 1) before being
directed to the measurement setup (d-scan).
Figure 5: Spatial mode.
4 CONCLUSIONS
We successfully compressed and measured ultrashort
laser pulses using the multiplate and dispersion-scan
techniques. We were able to generate a broad spec-
trum capable of supporting transform-limited pulses
down to 9.8 fs from a high peak power laser, which
suggests that the output pulse can be further shortened
if additional phase control or pulse shaping is used.
The spatial mode is homogeneous and stable, and the
MPC process has a good efficiency compared to tra-
ditional hollow-fiber compression setups. The com-
pactness and simplicity of the setup makes the MPC
a good candidate/alternative for application in high-
harmonic generation (HHG), as was demonstrated re-
cently (Huang et al., 2016).
ACKNOWLEDGEMENTS
We acknowledge the funding through the Portuguese
funding agency, Fundac¸
˜
ao para a Ci
ˆ
encia e a Tecnolo-
gia (FCT) through project NORTE-07-0124-FEDER-
000070 (Task 3). The authors thank Francisco Silva
for the d-scan acquisition and retrieval software.
REFERENCES
Alfano, R. (2013). The Supercontinuum Laser Source.
Springer New York.
Anderson, M. E., Monmayrant, A., Gorza, S.-P., Wasyl-
czyk, P., and Walmsley, I. A. (2008). SPIDER: A
decade of measuring ultrashort pulses. Laser Physics
Letters, 5(4):259–266.
B
¨
ohle, F., Kretschmar, M., Jullien, A., Kovacs, M., Mi-
randa, M., Romero, R., Crespo, H., Morgner, U.,
Simon, P., Lopez-Martens, R., et al. (2014). Com-
pression of cep-stable multi-mj laser pulses down to
4 fs in long hollow fibers. Laser Physics Letters,
11(9):095401.
Cheng, Y.-C., Lu, C.-H., Lin, Y.-Y., and Kung, A. H. (2016).
Supercontinuum generation in a multi-plate medium.
Optics Express, 24(7):7224.
Dudley J.M., T. J. e. (2010). Supercontinuum Generation in
Optical Fibers. CUP.
Huang, P.-C., Lu, C.-H., Chen, B.-H., Yang, S.-D., Chen,
M.-C., and Kung, A. H. (2016). EUV continuum
from compressed multiple thin plate supercontinuum.
In Conference on Lasers and Electro-Optics, page
FTu3N.7, Washington, D.C. OSA.
Humbert, G., Wadsworth, W., Leon-Saval, S., Knight, J.,
Birks, T., Russell, P. S. J., Lederer, M., Kopf, D.,
Wiesauer, K., Breuer, E., et al. (2006). Supercontin-
uum generation system for optical coherence tomog-
raphy based on tapered photonic crystal fibre. Optics
express, 14(4):1596–1603.
Dispersion-scan Measurements of the Multiplate Continuum Process
271

Lindfors, K., Kalkbrenner, T., Stoller, P., and San-
doghdar, V. (2004). Detection and spectroscopy
of gold nanoparticles using supercontinuum white
light confocal microscopy. Physical review letters,
93(3):037401.
Lu, C.-H., Tsou, Y.-J., Chen, H.-Y., Chen, B.-H., Cheng, Y.-
C., Yang, S.-D., Chen, M.-C., Hsu, C.-C., and Kung,
A. H. (2014). Generation of intense supercontinuum
in condensed media. Optica, 1(6):400.
Miranda, M., Fordell, T., Arnold, C., L’Huillier, A.,
and Crespo, H. (2012). Simultaneous compression
and characterization of ultrashort laser pulses using
chirped mirrors and glass wedges. Optics Express,
20(1):688.
Silva, F., Austin, D., Thai, A., Baudisch, M., Hemmer,
M., Faccio, D., Couairon, A., and Biegert, J. (2012).
Multi-octave supercontinuum generation from mid-
infrared filamentation in a bulk crystal. Nature com-
munications, 3:807.
Silva, F., Miranda, M., Alonso, B., Rauschenberger, J., Per-
vak, V., and Crespo, H. (2014). Simultaneous com-
pression, characterization and phase stabilization of
GW-level 1.4 cycle VIS-NIR femtosecond pulses us-
ing a single dispersion-scan setup. Optics Express,
22(9):10181.
Takara, H., Ohara, T., Yamamoto, T., Masuda, H., Abe,
M., Takahashi, H., and Morioka, T. (2005). Field
demonstration of over 1000-channel dwdm transmis-
sion with supercontinuum multi-carrier source. Elec-
tronics Letters, 41(5):1.
Trebino, R., DeLong, K. W., Fittinghoff, D. N., Sweetser,
J. N., Krumbugel, M. a., Richman, B. a., and Kane,
D. J. (1997). Measuring ultrashort laser pulses in
the time-frequency domain using frequency-resolved
optical gating. Review of Scientific Instruments,
68(9):3277.
PHOTOPTICS 2017 - 5th International Conference on Photonics, Optics and Laser Technology
272
