
PLAIN: PLugin for predicting the usAbility of Mobile User INterface
Makram Soui
1
, Mabrouka Chouchane
2
, Ines Gasmi
2
and Mohamed Wiem Mkaouer
3
1
Department of Computer Sciences, Higher Institute of Management Gabes, Gabes, Tunisia
2
Department of Computer Sciences, National School of Computer Studies Manouba, Manouba, Tunisia
3
Department of Software Engineering, Rochester Institute of Technology, Rochester, U.S.A.
Keywords: Evaluation, Mobile User Interface, Defects Detection, Usability, Quality.
Abstract: Mobile user interfaces have the potential to improve the interaction between user and system by
automatically tailoring the graphical user interface presentation according to the mobile devices. Recently,
there is a myriad of works that addressed the problem of designing mobile user interfaces to various
contexts of use. But, there are very few proposals about evaluating their quality. Using existing evaluation
methods such as questionnaires and experts’ evaluation are time-consuming and error-prone. In this paper,
we propose an automatic evaluation plugin that allows detecting the defects related to the quality of mobile
user interface. The plugin allows the measurement of several metrics that have been known to constitute the
state of the art quality attributes that are used to predict the quality of interfaces from the usability
perspective. For a given input mobile applications, it generates a list of defects identified using quantitative
evaluation metrics and defects types. We evaluated our plugin on four open source mobile applications and
the obtained results confirm that our tool can be used to accurately evaluate the quality of interfaces.
1 INTRODUCTION
The half of world population is subscribed to mobile
services (3600 million of users since 2014) (Pascual
et al., 2015). The quality of Mobile User Interfaces
(MUIs) is a key factor in the mobile application
effectiveness and the user satisfaction. In addition,
according to (Vos et al., 2015), the user interface
represents an important part of the application. So,
assessing the MUI helps to evaluate the interaction
and usability of the overall system. Furthermore, user
interface level represents 50 % of software code
(Myers, 1995, Park et al., 2013) which proves the
importance of this level in the correctness and the
effectiveness of the mobile application. (Hellmann
and Maurer, 2011) reported that MUI-related defects
have a significant impact on the end users of the
mobile applications. He has shown that 60% of
defects can be traced to code in the Graphical User
Interface (GUI), and 65% of GUI defects resulted in
a loss of functionality. Therefore, evaluating a MUI
is a very important phase in the development to
decrease the maintenance cost of mobiles
applications. In fact, detecting the usability defects
help the evaluator to quickly enhance the quality of
MUIs.
Recently, reviews on the state of the art about
evaluation methods for GUI have been tackled by
several researchers (Gena, 2005, Soui et al., 2010,
Van Velsen et al., 2008, Mulwa et al., 2011, Zen and
Vanderdonckt, 2014, Alemerien and Magel, 2015).
However, there is no consensus on how mobile user
interface should be assessed. In fact, mobile UI has
limited characteristics (small screen size, event-
centric, simple and intuitive GUI) compared to
traditional desktop GUI which need specific
evaluation techniques.
Today, there is a lack of MUI evaluation tools to
assess developers during the implementation of
mobile applications although developers are
eventually aware of the class of users that will be
interested in their applications and they try to meet
their satisfaction, in terms of ease-of-use, based on
either their feedback or by following the design of
high-rated and popular applications.
One of the practically used methodologies to
evaluate MUIs is through empirical evaluations,
which aim to assess the quality by observations in
extracted from questionnaires and experts’ or end-
users feedback. This process is productive but at the
same time manual, time-consuming and very
subjective. To this end, we propose to automate the
analysis of interfaces using a tool called PLAIN that
Soui M., Chouchane M., Gasmi I. and Mkaouer M.
PLAIN: PLugin for predicting the usAbility of Mobile User INterface.
DOI: 10.5220/0006171201270136
In Proceedings of the 12th International Joint Conference on Computer Vision, Imaging and Computer Graphics Theory and Applications (VISIGRAPP 2017), pages 127-136
ISBN: 978-989-758-224-0
Copyright
c
2017 by SCITEPRESS – Science and Technology Publications, Lda. All rights reserved
127

calculates the state of the art metrics that have been
widely used in assessing the usability of interfaces.
Our tool aims in raising indicators for bad quality of
given interfaces, these warnings can be taken into
account by developers when designing or
maintaining their applications’ interfaces. We chose
to adapt the usability metrics to the mobile
computing environment because of the tremendous
growth of applications relying on heavy user
interactions.We evaluate our tool on four mobile
applications. The obtained results confirm that our
plugin can be used to accurately evaluate the quality
of mobile user interfaces.
The remainder of this paper is structured as
follows: Section 2 enumerates the related work.
Section 3 presents the overview and the functional
architecture of the PLAIN. Section 4 discusses the
results of the evaluation of our plugin. In Section 5,
we conclude with some remarks and future work.
2 RELATED WORK
Several tools have been developed to evaluate the
quality of a user interface. (Charfi et al., 2015)
proposed an automatic tool to evaluate the quality of
interaction between interactive systems and users
called RITA. This tool has a modular architecture
which includes 4 modules: (1) Ergonomic
Guidelines Manager, (2) Evaluation Data Capture
Module, (3) Evaluation Engine, and (4) Evaluation
Report Generator.Also, it exploits three evaluation
techniques (electronic informer, ergonomic quality
inspection, and questionnaire). In fact, the idea of
defining tool with modular architecture and multi-
evaluation techniques appears promoting and make
this tool generic, configurable and flexible.
However, the informer technique requires some
human expertise and it does not support all kind of
UI such as multi-screen UI and touch-screen UI. In
addition, (Nguyen et al., 2014) described another
automatic tool called GUITAR. It is a model-based
tool, multi-platform and supported by its plug-in-
based architecture. In fact, this tool supports a
variety of GUI evaluation techniques. It supports
flexibility and extensibility due to its modular
architecture. Moreover, (Vos et al., 2015) presented
TESTAR tool which is an automated approach to
testing applications at the GUI level. This tool aims
to solve part of the maintenance problem by
automatically generating test cases based on the
structure of user interface. Furthermore, (Alemerien
and Magel, 2014) presented GUIEvaluator, a metric-
based tool that automatically generates the
complexity of a given GUI. The complexity is
calculated through the combination of5 quantitative
metrics: alignment, grouping, size, density, and
balance. This work is seen to be the closest to our
contribution, which does not combine the previously
mentioned metrics and does rely on the original
definition of complexity that is widely used in the
literature of usability analysis.(Alemerien and
Magel, 2015) has extended GUIEvaluator to
GUIExaminer, a tool that supports SLC metric
(Screen Layout Cohesion). This metric is also used
to assess the usability of the user interface and it is
considered as a hybrid metric because it is measured
based on the structural, aesthetic, and semantic
aspects of GUI layout.
Similarly, (González et al., 2012) also presented
a BG Layout tool which aims to automate the
calculation of 5 aesthetic metrics: balance, linearity,
orthogonality, regularity, and sequentiality in order
to assess the quality of the UI. (Buanga, 2011)
designed a tool to measure the aesthetic quality of
user interfaces such as size, color, space,
background, etc. Furthermore, (Gajos et al., 2008)
examined the effects of predictability and accuracy
on the usability of GUIs. Based-on eye-tracker, his
study aimed to measure the predictability of GUI,
the task times, the utilization level and the
performance of user interface. The result shows that
increasing predictability led to a large improvement
in the user’s satisfaction. Increasing accuracy
enhances higher utilization and performance of
GUIs.
This category of evaluation needs a lot of time
to analyze and interpret the collected data and requires
the explicit evaluator intervention. In addition, the
diversity of context of use is not considered.
Moreover, many automatic simulators have been
proposed as an automatic tool to test the quality of
GUI. (Magoulas et al., 2003) proposed a framework
that simulates different types of behavior of users to
predict the quality of the GUI. It simulates
automatically and randomly the way a user is
selecting and moving objects. (Stober et al., 2010)
also implemented a simulator that is based on a
computing simulation of a virtual user to evaluate
the ergonomic aspect of theinterface. This simulator
was built on three models (environment, user, and
platform). It was proposed to test the usability of
GUI. However, this proposal needs to consider
different kinds of user behavior, it simulates
different prototypical users by changing selection
and moving strategies. Also, it considers only the
classification of interface components. Furthermore,
(Soui et al., 2012) presented MetSim simulator to
GRAPP 2017 - International Conference on Computer Graphics Theory and Applications
128

predict various scenarios by changing the context of
use (Platform, User, and Environment). This
simulator tests the personalization quality of user
interface, detects problems and suggests
recommendations for the detected problems.
The main drawback of the existing work is its
limitation to the use of one or few metrics, there is
no work that has gathered all the metrics studied in
the literature. Another limitation of the related work
is the absence of a plugin that can be added to the
developer’s integrated development environment
and allows him to customize the metrics’ thresholds.
3 EVALUATION OF MUI
According to the ISO 9241-11, the usability defined
as the effectiveness, efficiency and satisfaction with
which a set of users can achieve a set of tasks in a
defined environment. (Akiki et al., 2015) defines the
interface evaluation as the software unity which
improves its interaction with a user by the
construction of user's model based on its crossed
interactions with this user. For this reason, several
metrics have been used in HCI for the purpose of
evaluating GUIs. In this work, we use a set of
evaluation metrics that were previously validated by
(Ngo et al., 2000). But, these previous metric
definitions did not take into account the
characteristics of mobile devices such as the size of
the screen. In a traditional desktop GUI, the values
of metrics are calculated based on the area of layout
but in the context of mobile computing, mobile
applications can be either native, web-based, and
hybrid (Masi et al., 2012). In contrast with web-
based and hybrid applications, native apps are
strongly correlated to the underlying device’s
operating system and developers are required to re-
design their apps, including the MUIs, to match the
specifications of each device and each operating
system within that device. This manual process can
add a significant overhead that we are trying to
reduce through providing developers with a tool that
can re-evaluate MUIs and take into account the
variant screen dimensions. In this study, we included
metrics that can be classified into two criteria: (1)
guidance (2) coherence.
3.1 Guidance
User guidance refers to the means available to
advise, orient, inform, interact, and guide the users
throughout their interaction with the computer
(message, alarm, label, etc.). This criterion is
subdivided into four metrics: regularity,
composition, sorting and complexity.
3.1.1 Regularity
The regularity of MUIs aims to provide a
consistency spacing between all the MUI
components and to minimize the number of row and
columns of the interfaces (alignment points). The
main goal of this metric is the organization of the
structure of MUI components. It has an influence on
user criteria such as age, motivation, etc. Thus, the
regularity of the mobile user interface helps users to
find their needs in an easier way through the MUI.
To reach this purpose, the mobile user interfaces
must have a high regularity level. In fact, to measure
this metric we propose the following formula (1):
=1−
+
+
3
∈
0,1
(1)
N
av
: the numbers of vertical alignment points
(number of rows).
N
ah
: the numbers of horizontal alignment points
(number of the columns).
N
sp
: the number of distinct distances between
column and row starting points.
n: the number of the components of the mobile user
interface.
3.1.2 Composition
The composition metric is provided to enhance the
visual clarity of the MUI by presenting the
interactive objects in a meaningful and
understandable manner in order to guide the user
when interacting with this MUI. It aims to combine
visually the components of the MUI that are
semantically linked in same boundary (line, color,
shape, etc.). The goal of this metric is to count the
number of objects that own a clear boundary. The
composition of MUI is related to many user criteria
such as age and user experience. In fact,a user with
low experience (computer skills) must have a MUI
with high composition. To measure this metric we
will propose the following formula (2):
=1−
+
2
∈
0,1
(2)
G: is the number of groups with clear boundaries by
line, background, color, or space
UG: is the number of ungrouped objects.
n: is the total number of objects in the mobile user
interface.
PLAIN: PLugin for predicting the usAbility of Mobile User INterface
129

3.1.3 Sorting
The sorting metric aims to rank the MUI
components. This arrangement correlates with the
eye movement that progresses sequentially from a
dark area to a lighter area, from big object to little
object, etc. Thus, it spruces up the component to
lead the eye of the user through the mobile user
interface in a logical and sequential ordering that
refers to the user’s needs. In fact, it helps users
throughout their interaction with the mobile user
interfaces by offering to the elderly users an ordered
interface with a high level of sorting. We propose
the following formula (3) to calculate this metric:
=1−
∑
(
∑
)
,,,
4
∈
0,1
(3)
With:
=
,
,
,
=
4,3,2,1
UL: upper-left
UR: upper-right
LL: lower-left
LR: lower-right
: is the number of objects on the quadrant j.
Each quadrant is given a weighting in q.
So,
=4,
=3,
=2,
=1.
3.1.4 Complexity
The main idea of this metric is to provide an optimal
number of interactive objects in MUI and a minimal
number of alignment points. It helps the user to find
only the expected information that correlates with
their needs and expectation. This metric has an
influence on the context criteria such as age,
motivation, education level, type of interaction
platform, etc. In fact, novice users usually like
interface with low levels of complexity while users
having higher education level prefer user interfaces
with a high level of complexity. In our work, we
calculate the complexity metric as follows (4):
=
+
(2)
∈
0,1
(4)
Where, n
vap
: number of vertical alignment points.
n
hap
: the number of horizontal alignment points.
: number of objects on the frame.
3.2 Coherence
Coherence supplies how good the interaction
between users and mobile user interfaces is, and
secures the efficient use of the MUI. This criterion is
subdivided into four metrics: integrality, density,
repartition, and symmetry.
3.2.1 Integrality
Integrality aims to group all mobile interface
components to appear like a one piece. In fact, the
screen size of the Smartphone is not the same as of a
computer that is why it is necessary to adapt the
information quantities and form of information, the
navigation in the mobile user interface and graphic
objects placement according to the visualized
support. The best solution to guarantee the visibility
of information when the user interacts with the
system using device mobile is to secure centered the
MUI components of the interface and avoid its
fragmentation. The measure of this metric is
determined by the extent to which the components
are related to size, and the relative measure of the
space between groups (groups of the component)
and that of margins. The good integrality is obtained
by using the optimum number of size components
(minimize the uses of different sizes in the mobile
interface) and leaving less space between objects.
When the level of integrality increase, the mobile
interface is not centered as well. This metric is given
as follows (5):
=1−0.5
|n
−1|
+
|
+
∑
|
2
(5)
∈
0,1
Where n
size
: the number of different sizes of objects
used by the interface.
n: the number of objects.
a
MUI
: the area of the mobile interface.
a
sc
: the area of the screen.
a
i
: the area of the interactive object i.
3.2.2 Density
This metric refers to the minimization of the screen
density level that is the set of information presented
to the user. This metric is the extent of the number
of interactive objects. The level of this metric
depends on the motivation, experience, interest of
users and the type of target platform. In fact, a user
with a low motivation prefers an interface with a
low-density level. The density measure (DM) is
calculated by (6):
=0.5
∑
+
∈
0,1
(6)
Where a
i
: area of the interactive object i.
a
sc
: area of the screen of the interactive platform.
n:the number of the interactive objects.
a
MUI
: the area of the mobile user interface.
GRAPP 2017 - International Conference on Computer Graphics Theory and Applications
130

3.2.3 Repartition
Repartition is an overall display of component
distribution in theinterface, which provides users an
equal arrangement of interactive objects among the
four quadrants (upperleft, upper right, lowerleft,
lower right). This metric is the comparison between,
the numbers of different ways that objects can be
organized for the four quadrantsand an optimal
distribution. The optimal distribution is obtained
when the n objects are evenly allocated with the
quadrants of the MUI. However, for ncomponents,
there are n! different ways to organize them. In each
quadrant, n
j
object can be organized with n
j
!
different ways. This metric can be related to the
level of user experience. For example, a MUI should
propose an optimal distribution for novice users in
order to help them to navigate through it.The
repartition Measure (RM) is given as follows (7):
=
(
!)
n
!n
!n
!n
!
∈
0,1
(7)
where n:is the number of objects on the mobile user
interface.
n
UL
: is the number of objects on the upper-left.
n
UR
: is the number of objects on the upper-right.
n
LL
: is the number of objects on the lower-left.
n
LR
: is the number of objects on the lower-right.
3.2.4 Symmetry
Symmetry is the equal distribution of the quantity of
interactive objects such as a button, a text field and a
text box on the right and the left columns of
aninterface. It consists of duplicating components on
the left, right, and radical of the mobile interface
centerline, and avoid the imbalance in the different
part of MUI. For example, symmetry makes the
mobile user interface well adapted for users with
low motivation to stimulate their interests. In our
work, we use the formula (8) proposed by (Ngo et
al., 2000)
SYM=1−
|
|+|
|+|
|
3
(8)
∈0,1
SYM
vertical
, SYM
horizantal
, SYM
radial
are, respectively
the vertical, horizontal and radial symmetries with:
SYM
=
|X′
−X′
|+|X′
−X′
|+|Y′
−Y′
|+|Y′
−Y′
|+
|
H
−H
|
+
|
H
−H
|
+|B′
−B′
|+|B′
−B′
|+
|Θ′
−Θ′
|+|Θ′
−Θ′
|+|R′
−R′
|+|R′
−R′
|
12
=
|X′
−X′
|+|X′
−X′
|+|Y′
−Y′
|+|Y′
−Y′
|+
|H′
−H′
|+|H′
−H′
|+|B′
−B′
|+|B′
−B′
|+
|Θ′
−Θ′
|+|Θ′
−Θ′
|+|R′
−R′
|+|R′
−R′
|
12
=
|X′
−X′
|+|X′
−X′
|+|Y′
−Y′
|+|Y′
−Y′
|+
|H′
−H′
|+|H′
−H′
|+|B′
−B′
|+|B′
−B′
|+
|Θ′
−Θ′
|+|Θ′
−Θ′
|+|R′
−R′
|+|R′
−R′
|
12
X’
j
, Y’
j
, H’
j
, B’
j
, Θ’
j
, and R’
j
are, respectively, the
normalized values of:
=x
−x
j=UL,UR,LL,LR
=y
−y
j=UL,UR,LL,LR
=h
j=UL,UR,LL,LR
=b
j=UL,UR,LL,LR
Θ
=
y
−y
x
−x
j=UL,UR,LL,LR
=
x
−x
+(y
−y
)²j
=UL,UR,LL,LR
Where UL, UR, LL, and LR stand for upper-left,
upper-right, lower-left, and lower-right, respectively.
X
j
: is the total x-distance of quadrant j.
Y
j
: is the total y-distance.
H
j
: is the total height.
B
j
: is the total width.
Θ
j
: is the total angle.
R
j
: is the total distance
(x
ij
; y
ij
) : the coordinates of the centers of object i on
quadrant j.
(x
c
; y
c
) : the coordinates of the frame.
b
ij
: the width of the object.
h
ij
: the height of the object.
n
ij
: the total number of objects on the quadrant.
4 THE PLAIN PLUGIN
4.1 Motivation and Overview
PLAIN
1
(PLugin for predicting the usAbility of
mobile user INterface) is an Eclipse plug-in that
PLAIN: PLugin for predicting the usAbility of Mobile User INterface
131
detects the quality problems of MUIs based on the
above-defined usability metrics (expriment, 2016). It
takes as input a Java projectof MUIs to evaluate, and
it generates as output the list of detected problems.
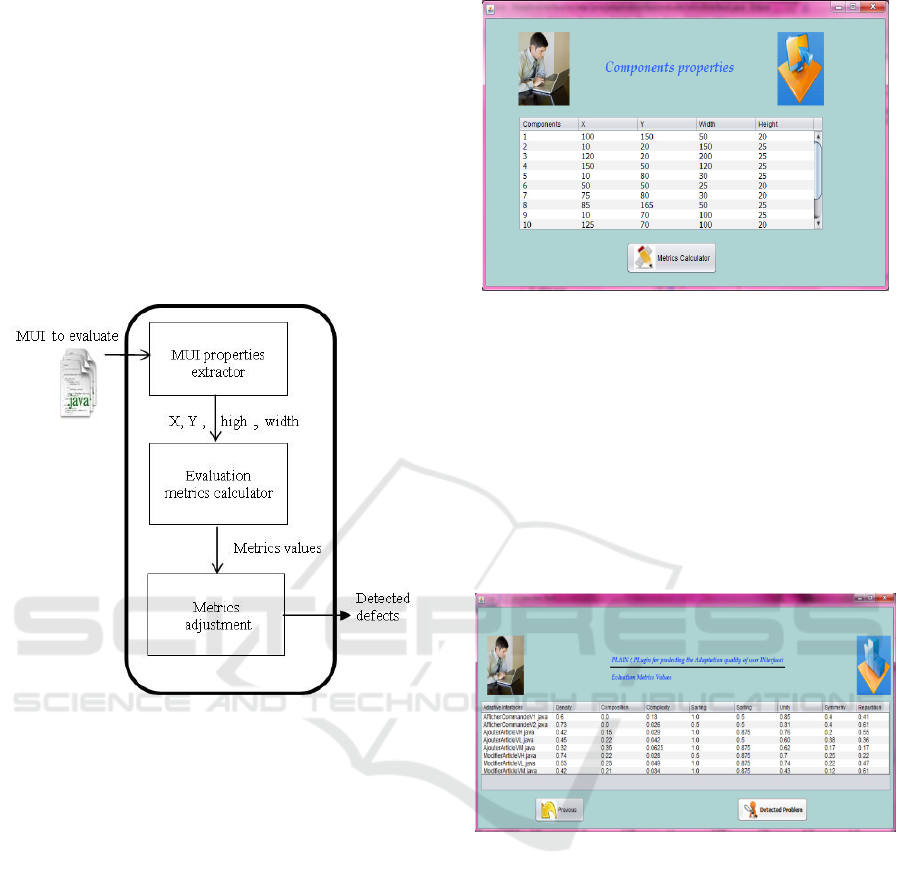
As figure 1 shows, our plug-in includes 3 modules:
1) MUI properties extractor, 2) evaluation metrics
calculator, and 3) metrics adjustment. First, the plug-
in generates all components properties for each
MUI. Second, these properties are used to calculate
quality evaluation metric measures. Then, based on
these measures our plug-in adjusts the evaluation
metrics based on the box plot technique. Finally,
PLAIN generates the detected defects.
Figure 1: The architecture of PLAIN.
4.2 Functional Architecture of PLAIN
Plugin
The architecture of PLAIN is a plugin. To use it, an
evaluator should import the source code of MUIs to
evaluate a project and opens Navigator View in Java
perspective of Eclipse editor.
4.2.1 The UI Properties Extractor
First, our plugin parses the source code of MUI to
extract components’ properties values. These values
would be used to calculate the measurement of
quality metrics. Our plugin needs to extract width,
height, alignment, axis of coordinates for the left top
point of an object, etc. This module will be started
when the evaluator clicks on Identify Problem
button, the MUI properties extractor parses the
source code of MUIs and extracts the MUI
component properties. Figure 2 presents the values
of these properties.
Figure 2: MUI properties values using PLAIN.
4.2.2 The Evaluation Metrics Calculator
This second module aims to calculate the quality
metrics values according to our aforementioned
formulas (see section 2). It has as input the values of
components properties and generates as output the
measures of quality metrics. The evaluation metrics
are: density, regularity, composition, sorting,
complexity, symmetry, and repartition. Figure 3
shows the values of these evaluation metrics.
Figure 3: A screenshot of the Metrics Calculator MUI of
PLAIN.
4.2.3 Metrics Adjustment
Our plugin assesses the MUIs based on a set of
metrics. The values of these metrics can indicate the
existence of a defect type. In fact, the usability
metrics can be interpreted as certain symptoms of
one or more defects. So, in the defects detection
process, we need to compare these measures with an
adequate threshold value. However, it is difficult to
generalize these thresholds for all mobile interfaces
that are very different in terms of the number of
interfaces by application, number of components by
mobile interface, etc. Thus, the aim of this module is
to adjust the thresholds using the box plot technique.
GRAPP 2017 - International Conference on Computer Graphics Theory and Applications
132
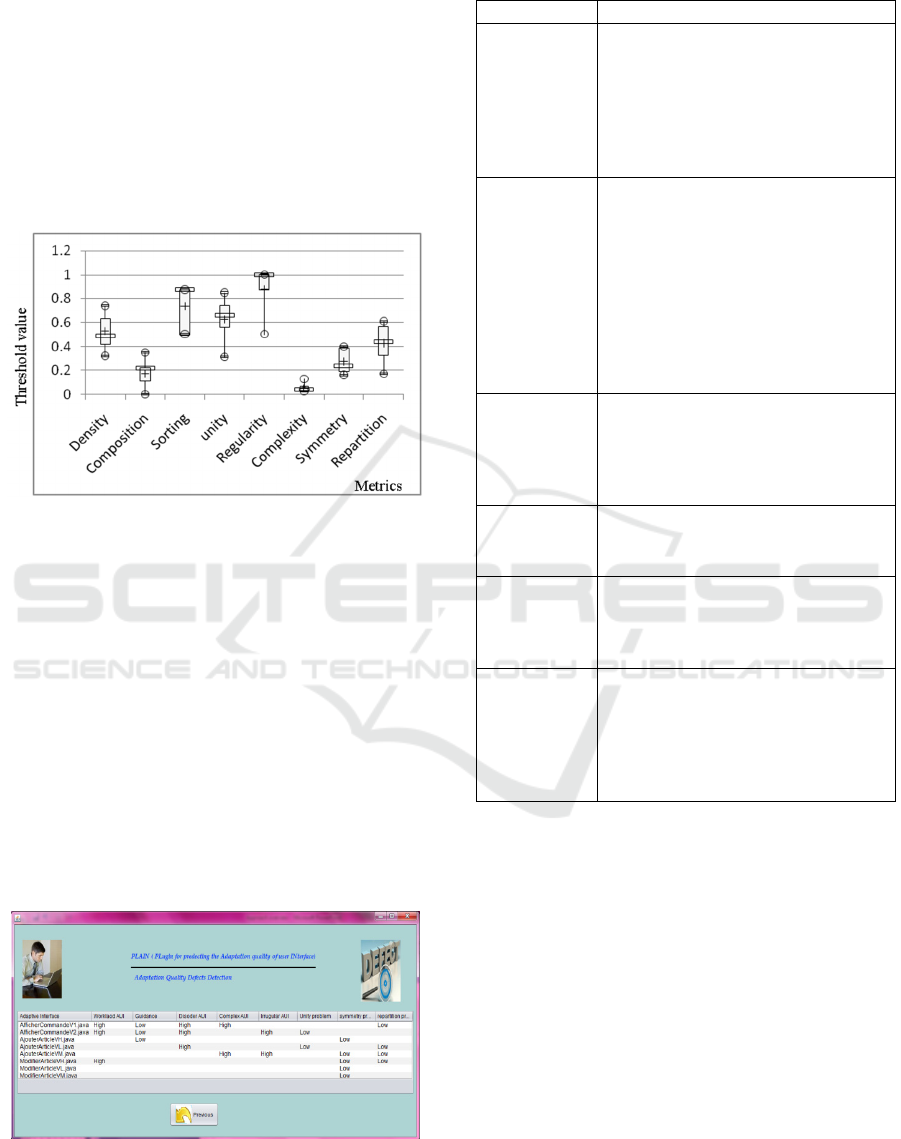
According to (Hubert and Vandervieren, 2008),
the box plot is a very popular graphical tool to
visualize the distribution of data. Thus, it determines
information about the location and the spread of the
data by means of the median and the interquartile
range.In our work, box plot takes as input the
measures of quality metrics and generates as output
the median of each metric that should be considered
as a threshold. Figure 4 shows an example of box-
plot distribution of one of studied projects called
Duolingo.
Figure 4: Boxplot distribution of our proposed metrics for
Duolingo project.
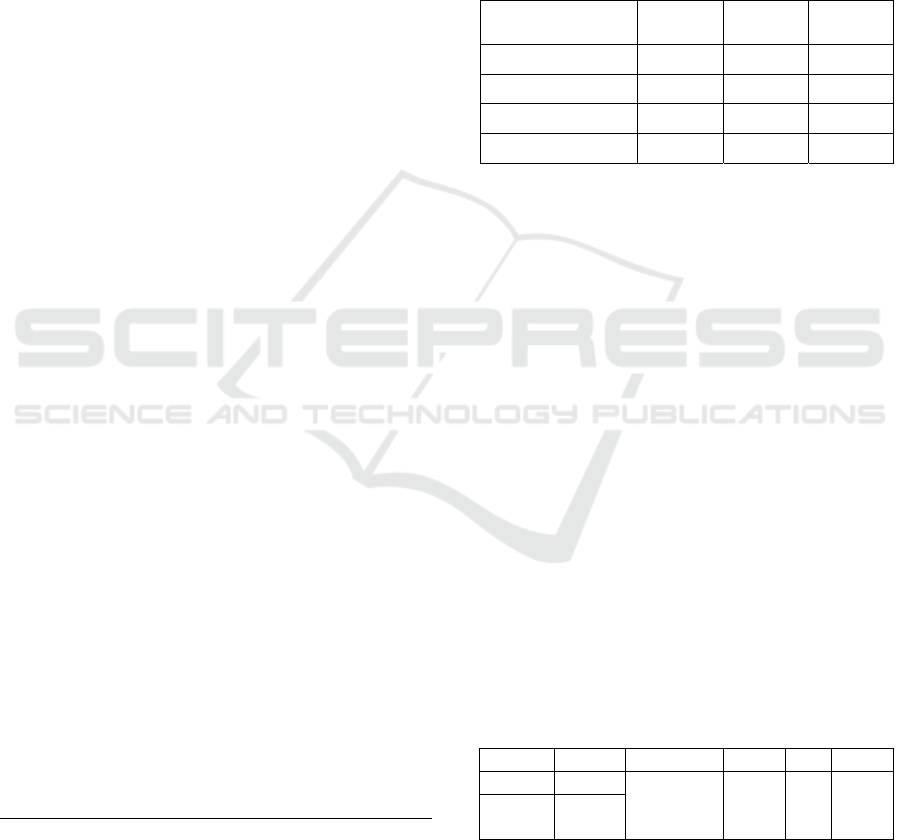
4.2.4 Defects Detection of MUIs
The following table represents the known state of art
defects that can be detected using the structural
metrics when their values go beyond specific
thresholds. Several studies have gone through the
specification of these thresholds. In this work, we
adopt the well-known thresholds from the original
work of metrics. But, our plugin allows developers
to specify their own thresholds as well.
Once threshold values are adapted to the current
mobile applications, the problems can be detected.
As figure 5 shows, PLAIN lists the detected
problems of each MUI.
Figure 5: A screenshot of the defects detection of MUI
using PLAIN.
Table 1: Metrics and their associated defects.
Metrics Example of defect
Regularity
Low level of MUI regularity
(irregularity) for no motivated user is
considered as a defect since this kind
of user usually, prefers regular UI
which has the same alignment point
between all components of the
interface.
Composition
Low guidance of MUI for users
having low computer skills
(experience) and high guidance for
users having high experience are
considered as an adaptation defects.
To resolve these problems, one of the
widely used techniques of guidance is
the composition which consists to
group the components of MUI by
tasks of services.
Sorting
Low sorting of components for
novice users can provoke bad
arrangement of MUI. This problem
can disturb the user during their
interaction with the system.
Complexity
When the MUI has high complexity,
the novice user cannot succeed to
achieve his task.
Integrality
Low integrality of MUI which has no
centered MUI components proposed
to old users can be considered as
adaptation defects.
Density
Proposal of an MUI with high density
(workload) for users with low levels
of education is considered as
adaptation defects because this kind
of user usually prefers just the right
information according to their needs.
5 VALIDATION
To assess our work for MUI evaluation, we
conducted a set of experiments based on 4 mobile
applications (Duolingo, Accuweather, loan
calculator and HandicraftWomen). The goal of the
study is to evaluate the efficiency of our tool for
quality defects detection. In this section, we first
present our research questions and then discuss the
obtained results.
5.1 Research Questions
We assess the performance of our tool by finding out
whether it could detect the usability defects of
PLAIN: PLugin for predicting the usAbility of Mobile User INterface
133
mobile interfaces. Our validation is conducted by
addressing the following research questions outlined
below. We also explain how our experiments are
designed to address these questions:
Research Question 1:Is PLAIN effective to
measure the quality of a given mobile user interface?
Research Question 2:How do the structural
measures of mobile user interface affect the mobile
interface quality rating?
To answer Research Question 1, we test the
following hypotheses:
H
1
: given a specific mobile user interface, the
means of user interface quality for the user rating
and the PLAIN are not equal.
H
2
:given a specific mobile user interface, there
is a strong positive correlation between the user
rating and the PLAIN in terms of interfaces quality
values.
To answer Research Question 2, we test this
hypothesis:
H
3
: given a specific mobile user interface, the
values of the calculated metrics are strongly
correlated with interface quality values given by
both the users and the PLAIN.
5.2 Studied Projects
The validation is conducted over the evaluation of
four open source android applications: Duolingo
2
,
Accuweather
3
, loan calculator
4
, and
HandicraftWomen
5
.
The corpus used includes releases of Duolingo
which is a great application for learning a different
language. It customizes the course according to the
user’s goal (casual, regular, serious) and experience
(beginner or medium).
Accuweather is an application that provides a
prediction about the current and future weather. It
has adynamic user interface that changes depending
on the location, time of day and weather conditions.
This application allows users to personalize the
number of displayed information according to their
needs. loan calculator is one of the best simulation
credit applications that help users to simulate their
personal loan.
1
https://github.com/mkaouer/PLAIN
2
https://github.com/KartikTalwar/Duolingo
3
https://github.com/AccuWeather
4
https://github.com/kunalbarve/LoanCalculator
5
https://github.com/mabroukachouchane/HandcraftWome
n/blob/master/FemmeArtisan.rar
And, Handcraft Women that aims to support
handcraft women in their business activities. This
project consists on adapting the current technologies
to the profile of those handcraft women. We have
chosen these projects because of their medium to
large size; they considered the most popular used
application and can be used as inputs to our tool. We
also extracted from the Google Play Store the user
rating of each application. Table 2 presents the
properties of the studied mobile applications.
Table 2: Properties of the studied mobile applications.
Mobile
applications
Release
Number
of MUI
User
Rating
Duolingo v3.21.0 30 4,7
Accuweather v4.1.0 9
4,3
loan calculator v1.7.2 8
4 ,4
HandicraftWomen v1.0 20
1,7
5.3 Results for Research Questions
5.3.1 Results for Research Question 1
We performed the t-test on (H1) and the Pearson
correlation on the test (H2) for both the user rating
and the PLAIN, at a significance level of 0.01, on 67
mobile user interfaces in order to test the two
aforementioned hypotheses (see section 5.1).
Furthermore, to test the hypothesis (H
1
), we
performed the t-test for (H
1
) as shown in table 2,
df=95, for a significance level of 0.01. It shows there
is no difference between the means of mobile user
interface quality of the user rating and the PLAIN.
In addition, to test the hypothesis (H
2
), we
performed the Pearson correlation test. In table 3,
the R-value (0.7100355) shows a strong positive
correlation between the user rating and the PLAIN at
a significance level of 0.01. Therefore, our tool can
be used to accurately evaluate the quality of mobile
user interfaces.
Table 3: Pearson correlation and t-test results between the
PLAIN and user rating.
means R t-Val df p-val
PLAIN 0.497
0.7100355 9.828 95 0.721
User
rating
0.430
GRAPP 2017 - International Conference on Computer Graphics Theory and Applications
134
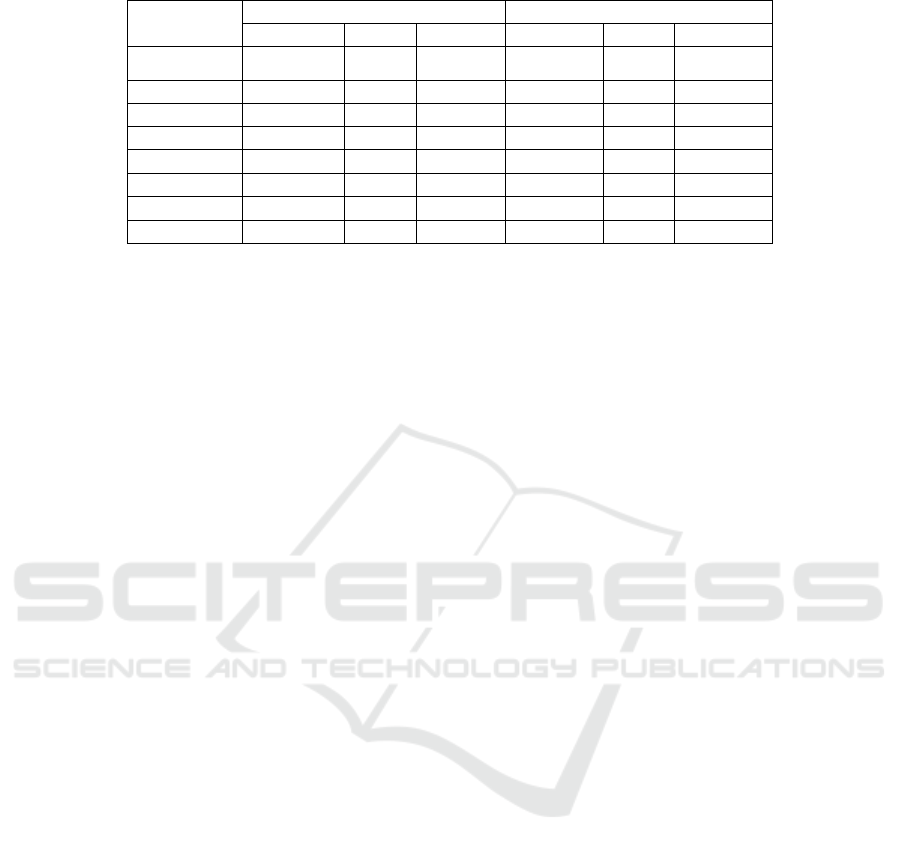
Table 4: The Pearson correlation test and t-test between metrics and both the user rating and the PLAIN.
Metrics
User rating PLAIN
R p-val. t-test R p-val. t-test
Regularity 0.9503328 0.3545 -0.93048 0.8135283 0.2682 -1.1137
Composition 0.8341943 0.4166 0.081592 0.6207615 0.6824 0.1047
Sorting 0.2179232 0.8322 0.21246 0.4400506 0.6687 0.2932
Complexity 0.67007 0.102 -1.651 0.5855533 0.5689 0.171
Integrality
0.6223945
0.2324 -1.202 0.8018682 0.9379 0.078159
Density
0.680073 0.8703
0.16378 0.6544041 0.5242 0.06392
Symmetry 0. 1248698 0.2586 0.00123 0.0789546 0.3214 0.04569
Repartition 0.7511553 0.01309 -2.529 0. 7454942 0.9942 0.0072662
5.3.2 Results for Research Question 2
We performed the Pearson correlation test and the t-
test for both the PLAIN and the user rating with the
eight quality metrics, at a significance level of 0.01,
on 67 mobile user interfaces in order to test the
aforementioned hypothesis (see section 5.1).
Table 4 shows the results of the Pearson correlation
test and t-test for the values of the eight quality
metrics and the values of mobile user interface
quality given by both the PLAIN and the user rating.
First, Table 4 shows that there is a strong correlation
between the user rating and the PLAIN and the
following metrics at a significance level of 0.01:
regularity, composition, complexity, integrality,
density and repartition. Second, there are two
metrics which have a weak correlation with the user
rating and the PLAIN. Sorting with R values
0.2179232 and 0.4400506, and symmetry with R
values 0.1248698 and 0.0789546 respectively. Thus,
we can claim that our metrics are effectives to
evaluate the mobile user interfaces quality. To this
end, we can accept the hypothesis H
3
for the six
metrics (regularity, composition, complexity,
integrality, density and repartition) but we fail to
accept it for sorting and symmetry metrics.
According to the finding results, we can conclude
that
whether we use PLAIN or user rating to
evaluate the MUIs quality, we reach the same
results. Therefore, our findings confirm the
effectiveness of our plugin and its metrics measures.
5.4 Threats to Validity
In this section we report threats to validity to our
study. As an internal validity, we have used state of
the art metrics that we have adapted to the context of
mobile computing, these metrics are known to be a
good measure of the quality of interfaces, and we
have no prior validation for these metrics as we
relied on their prior work for ensuring their
performance. As a construct validity, we have used
box-plot to generate threshold, this cannot be proven
to be the best technique especially that, manually
tuning these values by an expert can give better
results, but in our approach we aim in automating
this step and our results were statistically significant.
As an external threat, we have used only 4 projects
and this may not be enough to generalize our
findings, and that’s why we are planning on
extending the number of projects analyzed to
challenge the scalability of our results.
6 CONCLUSIONS
In this paper, we propose a java plugin devoted to
MUI evaluation by considering quality metrics, in
order to evaluate the usability of the mobile user
interface. This plugin called PLAIN includes four
modules which provide a generic tool able to
evaluate different mobile applications. It can be used
to predict the defects of MUIs in early stages of
software development. We evaluated our tool on
four open-source projects. The findings show that
PLAIN is effective to predict the usability of MUIs.
Some issues still need investigation, such as
additional problems can be considered to detect all
the quality defects that can occur. Also, we
considered extending the correction of detected
defects. We are planning to apply some refactoring
operations such as rearrangement of mobile user
interface content, resizing the dimension of
components, etc.
REFERENCES
Akiki, P. A., Bandara, A. K. & Yu, Y. (2015) Adaptive
model-driven user interface development systems.
ACM Computing Surveys 47.
PLAIN: PLugin for predicting the usAbility of Mobile User INterface
135

Alemerien, K. & Magel, K. (2014) GUIEvaluator: A
Metric-tool for Evaluating the Complexity of
Graphical User Interfaces. In: SEKE, pp. 13-18.
Alemerien, K. & Magel, K. (2015) SLC: a visual cohesion
metric to predict the usability of graphical user
interfaces. In: Proceedings of the 30th Annual ACM
Symposium on Applied Computing, pp. 1526-1533.
ACM.
Buanga, P. M. (2011) Automated evalution of graphical
user interface metrics.
Charfi, S., Ezzedine, H. & Kolski, C. (2015) RITA: a useR
Interface evaluaTion frAmework. Journal of Universal
Computer Science 21, 526-560.
expriment (2016) https://github.com/mkaouer/PLAIN.
Gajos, K. Z., Everitt, K., Tan, D. S., Czerwinski, M. &
Weld, D. S. (2008) Predictability and accuracy in
adaptive user interfaces. In: Proceedings of the
SIGCHI Conference on Human Factors in Computing
Systems, pp. 1271-1274. ACM.
Gena, C. (2005) Methods and techniques for the
evaluation of user-adaptive systems. The Knowledge
Engineering Review 20, 1-37.
González, S., Montero, F. & González, P. (2012)
BaLOReS: a suite of principles and metrics for
graphical user interface evaluation. In: Proceedings of
the 13th International Conference on Interacción
Persona-Ordenador, pp. 9. ACM.
Hellmann, T. D. & Maurer, F. (2011) Rule-based
exploratory testing of graphical user interfaces. In:
Agile Conference (AGILE), 2011, pp. 107-116. IEEE.
Hubert, M. & Vandervieren, E. (2008) An adjusted
boxplot for skewed distributions. Computational
statistics & data analysis 52, 5186-5201.
Magoulas, G. D., Chen, S. Y. & Papanikolaou, K. A.
(2003) Integrating layered and heuristic evaluation for
adaptive learning environments. In: Proceedings of the
Second Workshop on Empirical Evaluation of
Adaptive Systems, held at the 9th International
Conference on User Modeling UM2003, Pittsburgh,
pp. 5-14.
Masi, E., Cantone, G., Mastrofini, M., Calavaro, G. &
Subiaco, P. (2012) Mobile apps development: A
framework for technology decision making. In:
International Conference on Mobile Computing,
Applications, and Services, pp. 64-79. Springer.
Mulwa, C., Lawless, S., Sharp, M. & Wade, V. (2011) The
evaluation of adaptive and personalised information
retrieval systems: a review. International Journal of
Knowledge and Web Intelligence 2, 138-156.
Myers, B. A. (1995) User interface software tools. ACM
Transactions on Computer-Human Interaction
(TOCHI) 2, 64-103.
Ngo, D., Teo, L. & Byrne, J. (2000) Formalising
guidelines for the design of screen layouts. Displays
21, 3-15.
Nguyen, B. N., Robbins, B., Banerjee, I. & Memon, A.
(2014) GUITAR: an innovative tool for automated
testing of GUI-driven software. Automated Software
Engineering 21, 65-105.
Park, J., Han, S. H., Kim, H. K., Cho, Y. & Park, W.
(2013) Developing elements of user experience for
mobile phones and services: survey, interview, and
observation approaches.
Human Factors and
Ergonomics in Manufacturing & Service Industries
23, 279-293.
Pascual, G. G., Pinto, M. & Fuentes, L. (2015) Self-
adaptation of mobile systems driven by the common
variability language. Future Generation Computer
Systems 47, 127-144.
Soui, M., Abed, M., Kolski, C. & Ghédira, K. (2010)
Evaluation by simulation for personalized information
systems. In: 8th International Conference of Modeling
and Simulation, MOSIM'10" Evaluation and
optimization of innovative production systems of
goods and services, pp. 10-12.
Soui, M., Abed, M., Kolski, C. & Ghèdira, K. (2012)
Evaluation by simulation to optimise information
systems’ personalisation quality in logistics.
International Journal of Production Research 50,
3579-3593.
Stober, S., Hentschel, C. & Nürnberger, A. (2010)
Evaluation of adaptive SpringLens: a multi-focus
interface for exploring multimedia collections. In:
Proceedings of the 6th Nordic Conference on Human-
Computer Interaction: Extending Boundaries, pp. 785-
788. ACM.
Van Velsen, L., Van Der Geest, T., Klaassen, R. &
Steehouder, M. (2008) User-centered evaluation of
adaptive and adaptable systems: a literature review.
The Knowledge Engineering Review 23, 261-281.
Vos, T. E., Kruse, P. M., Condori-Fernández, N.,
Bauersfeld, S. & Wegener, J. (2015) Testar: Tool
support for test automation at the user interface level.
International Journal of Information System Modeling
and Design (IJISMD) 6, 46-83.
Zen, M. & Vanderdonckt, J. (2014) Towards an evaluation
of graphical user interfaces aesthetics based on
metrics. In: 2014 IEEE Eighth International
Conference on Research Challenges in Information
Science (RCIS), pp. 1-12. IEEE.
GRAPP 2017 - International Conference on Computer Graphics Theory and Applications
136
