
Towards an Understanding of the Misclassification Rates of Machine
Learning-based Malware Detection Systems
Nada Alruhaily, Behzad Bordbar and Tom Chothia
School of Computer Science, University of Birmingham, Birmingham, U.K.
{N.M.Alruhaily,bxb, T.P.Chothia}@cs.bham.ac.uk
Keywords:
Malware, Classification Algorithms, Machine Learning, Behavioural Analysis.
Abstract:
A number of machine learning based malware detection systems have been suggested to replace signature
based detection methods. These systems have shown that they can provide a high detection rate when recog-
nising non-previously seen malware samples. However, in systems based on behavioural features, some new
malware can go undetected as a result of changes in behaviour compared to the training data. In this paper
we analysed misclassified malware instances and investigated whether there were recognisable patterns across
these misclassifications. Several questions needed to be understood: Can we claim that malware changes over
time directly affect the detection rate? Do changes that affect classification occur in malware at the level of
families, where all instances that belong to certain families are hard to detect? Alternatively, can such changes
be traced back to certain malware variants instead of families? Our experiments showed that these changes
are mostly due to behavioural changes at the level of variants across malware families where variants did not
behave as expected. This can be due to the adoption of anti-virtualisation techniques, the fact that these vari-
ants were looking for a specific argument to be activated or it can be due to the fact that these variants were
actually corrupted.
1 INTRODUCTION
Malware is a major concern in most computer sectors.
Past research has shown that machine learning based
detection systems can detect new malware using the
knowledge gained from training a classifier on previ-
ously discovered and labeled malware samples (e.g.
(Bailey et al., 2007; Firdausi et al., 2010; Pirscoveanu
et al., 2015; Hansen et al., 2016)). However, due to
the fact that malware are evolving and their behaviour
can change, as in the case of exploiting a new vulner-
ability (Walenstein and Lakhotia, 2007) or an attempt
of malware writers to avoid detection, malware can
remain undetected and, therefore, be classified incor-
rectly as benign.
In this paper we investigate the reasons behind the
misclassification of malware by using a knowledge-
base of malware and benign samples that we have col-
lected from a range of sources. We tracked changes
adopted by the misclassified malware instances and
we investigated whether there was a recognisable pat-
tern across these misclassified samples. In our first
experiment, we grouped malware by year and clas-
sified them in order to check whether there was any
relation between the passage of time and the malware
detection rate. In our second experiment, we checked
whether the changes that caused the misclassification
occur in malware at the level of families where all
instances that belong to specific new families are mis-
classified, or if these changes can be traced back to
individual variants?
In summary, in this paper we have investigated the
following research questions:
• Does misclassification increase over a period of
time?
• Does misclassification occur in malware at the
level of families, where all instances that belong to
specific new malware families are misclassified?
• Alternatively, does misclassification occur at the
level of variants, and it is not related to malware
families?
• When misclassification does occur can we find the
reason for it?
In order to answer these questions we used 5410
malware samples, from approximately 400 variants
drawn from 200 malware families. Although anti-
malware vendors may have different names for the
same sample, they usually share a similar naming
scheme where malware can be grouped into families
Alruhaily, N., Bordbar, B. and Chothia, T.
Towards an Understanding of the Misclassification Rates of Machine Learning-based Malware Detection Systems.
DOI: 10.5220/0006174301010112
In Proceedings of the 3rd International Conference on Information Systems Security and Privacy (ICISSP 2017), pages 101-112
ISBN: 978-989-758-209-7
Copyright
c
2017 by SCITEPRESS – Science and Technology Publications, Lda. All rights reserved
101
based on some similarities (code similarity as an ex-
ample) and then each family can have a number of
variants where each variant represent a new strain that
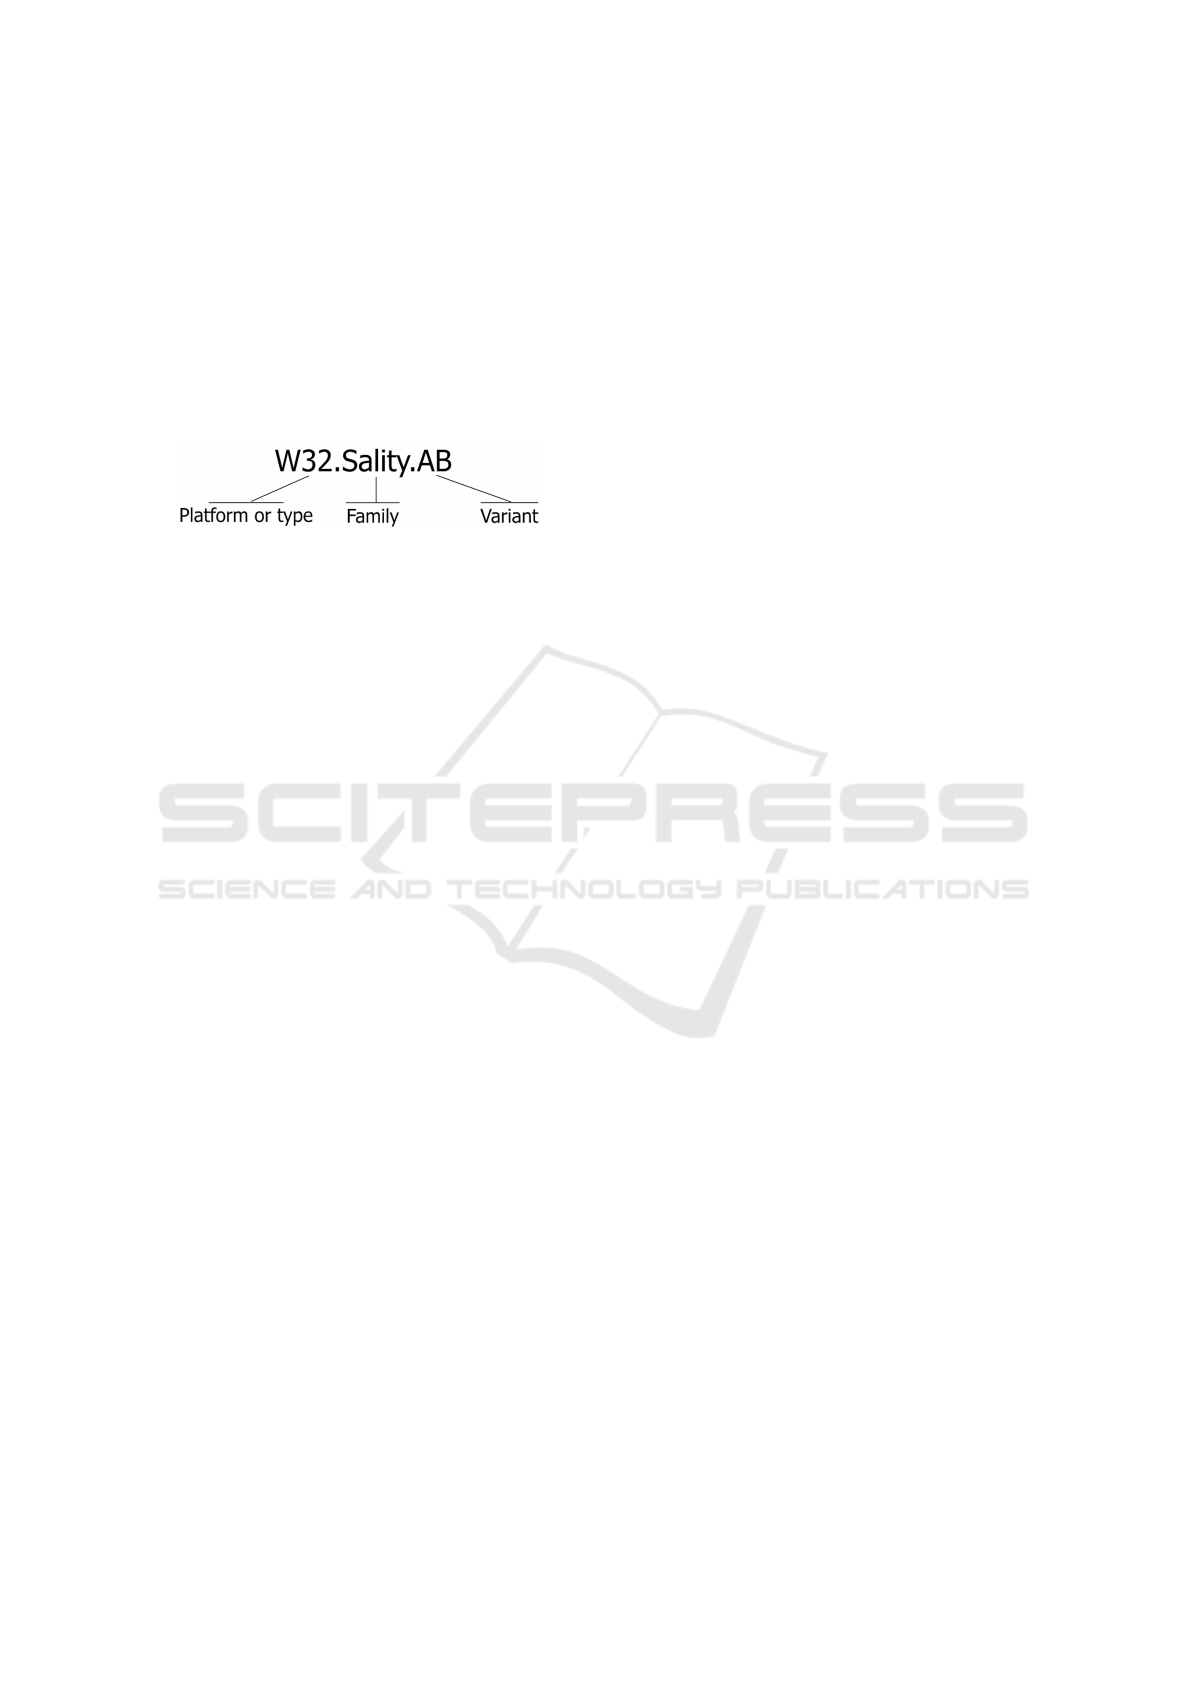
is slightly modified. Figure 1 shows an example of the
naming scheme followed by the company Symantec;
it consists of a prefix, the family name and a suffix
(Symantec, 2013a). Throughout this paper Syman-
tec’s Listing of Threats and Risks (Symantec, 2016a)
has been used as a source of malware discovery date,
types and malware family and variants names.
Figure 1: Symantec malware naming scheme.
We first build a classifier based on our malware
and benign samples. We have an imbalanced dataset
as the malware class is the majority, which is an is-
sue that proposed malware detection systems usu-
ally encounter (Miao et al., 2015; Tian et al., 2010).
We showed that malware detection systems based
on Bagging (Breiman, 1996) classifier could be af-
fected by the imbalance problem as the classifier be-
comes more biased towards the majority class, there-
fore, we propose to adopt Exactly Balanced Bagging
(EBBag) (Chang et al., 2003) instead, which is a
version of Bagging for dealing with an imbalanced
dataset.
We then conducted multiple experiments: in the
first experiment we ran the classifier on new mal-
ware grouped into their year of discovery. In the sec-
ond experiment we grouped each new malware family
into their available variants. We recorded the detec-
tion rate resulting from each group, in each experi-
ment, in order to answer the research questions men-
tioned above. We used two different classification al-
gorithms: Support Vector Machines (SVM) and De-
cision trees (DT) as a base for our classifier to make
sure that the results produced are not dependent on a
specific classification algorithm.
When looking at how the classifier performed on
malware released after the training data, we saw a
small fall in the detection rate after the first tested
year, however we found no significant, long-term cor-
relation between the time since a classifier is built and
the misclassification rate of new malware, i.e., after
a small initial drop off, the behavioural changes in
the new malware did not reduce the accuracy of the
classifier. It can be seen, however, that when having
access to more training data the classifier tend to per-
form slightly better overall. Our research also showed
that most of the behavioural changes that affect the
classification rate of malware can be traced back to
particular malware variants, and in most cases these
changes are not replicated across malware families.
Meaning that we would see a single variant that was
hard to detect in a family of malware in which the
other variants could be reliably detected.
We also found that the misclassifications were
mostly due: to the adoption of anti-virtualisation tech-
niques, or the fact that particular variants were look-
ing for a specific argument to run, or due to the fact
that some variants were actually considered as cor-
rupted files. While removing all examples of mis-
classified corrupted malware from our dataset would
have been possible, we note no other work on mal-
ware classification does this, so removing these sam-
ples would not reflect other work.
We hope that our results will help the reader to
interpret other papers that present the detection rate
of a machine learning classification system as their
main result, and that our work sheds some light on
how these classification rates will perform over time
and why some malware avoids detection.
The paper is organised as follows: Section 2 de-
scribes related work in this field. Section 3 gives an
overview of the methodology followed. Section 4
presents the sample preparation and data collection
procedure. The main contribution to this field of re-
search is described in Section 5 and 6 along with the
experiments’ results. The analysis is presented in Sec-
tion 7. Section 8 discusses the research outcomes and
outlines the conclusion.
2 RELATED WORK
In the following section we review the literature on
malware classification and detection systems that is
related to our work, and we indicate how this paper
differs.
A large number of studies have introduced or eval-
uated different machine learning-based detection sys-
tems; the authors in (Xu et al., 2004; Ye et al., 2008;
Wang et al., 2009) have based their detection systems
on API calls sequence extracted using static analysis.
However, static analysis is known to be questionable
when dealing with obfuscation techniques where the
sequence of the instructions might be modified or data
locations can be hidden (Moser et al., 2007). Moti-
vated by this fact, other researchers have based their
detection systems on API call sequence extracted us-
ing behavioural analysis (Zhao et al., 2010; Tian et al.,
2010; Faruki et al., 2012).
Most of the proposed detection systems have been
tested on either a limited, or a current set of mal-
ware. Therefore, there was a need to examine the af-
ICISSP 2017 - 3rd International Conference on Information Systems Security and Privacy
102

fect of the passage of time on such malware detection
systems and explore whether this can affect the sys-
tems’ detection rate. Islam et al in (Islam et al., 2012)
showed that it is possible for current malware detec-
tion systems to maintain a high detection rate even
when classifying future malware. They considered
two sets of malware in order to verify this idea, one
collected between 2002 and 2007 and the other col-
lected from 2009 to 2010. In their experiment they
dated malware based on the collection date and they
used static, behavioural and a combination of both
features during their experiment.
In (Shabtai et al., 2012) the OpCode n-gram pat-
terns are used as features. They addressed the ques-
tion “How often should a classifier be trained with
recent malicious files in order to improve the detec-
tion accuracy of new malicious files?” Their research
showed that classifiers can maintain a reliable level of
accuracy. However, when testing malware created in
2007, a significant decrease in the accuracy was ob-
served, which might indicate that new types of mal-
ware were released during that year.
Our work is different from the research mentioned
above in the following respects:
• In addition to looking at malware behaviour over
time, we also tracked the misclassification and in-
vestigated whether it can be traced back to mal-
ware families, or even to variants.
• We also investigated the possible reasons that led
to this misclassification and analysed the results.
3 METHODOLOGY
Our work on this paper can be divided into four
stages:
1. Collecting malware; described in detail in Sec-
tion 4.
2. Building a Classifier:
• Extracting and determining the features that we
will be using when classifying the data.
• Addressing the imbalance class problem on our
data where malware samples outnumber the be-
nign samples.
• Assessing the performance of the proposed
method.
The feature extraction step is described on Sec-
tion 5.1 while the system architecture is illustrated
on Section 5.3.
3. Classifying large grouped datasets: Following the
previous step, we will be classifying large datasets
which have been grouped into:
• Years: in order to check whether there is a no-
table change in malware behaviour over time
which might result in a change in the classifica-
tion rate in one of the years. We chose one year
intervals based on the amount of data we have,
as it was the minimum period which was able
to produce a stable results.
• Variants: in order to check whether these
changes, which affect the detection rate, can be
traced back to specific malware families were
all their variants are hard to detect, or just to
particular variants, without the family member-
ship being a factor.
The details of these two experiments are described
in detail in Section 6.
4. Analysing the misclassified instances, which in-
cludes analysis of the misclassification that oc-
curred and identification of its reasons. The anal-
ysis is discussed on Section 7.
4 THE KNOWLEDGE-BASE
In order to conduct our experiments we built a
knowledge-base, which consisted of information and
analysis reports related to all our collected malware
and benign samples. The following section provides
an overview of the procedure that was followed to col-
lect the data.
Initially, the python-based tools: mwcrawler and
maltrieve (Maxwell, 2012; Maxwell, 2015) were
used to collect malware samples from a number of
sources through parsing multiple malware websites
and retrieving the latest malicious samples which
have been uploaded to them. These websites include:
Malc0de, Malware Black List,Malware Domain List,
Malware URLs, VX Vault URLquery, CleanMX and
ZeusTracker.
To makes sure our dataset reflected the most
common types of malware, we have developed a
python-based script that collect the most common
10 and 20 malware families recorded by Syman-
tec and Microsoft in their Internet Security Threat
reports (Symantec, 2015) and Security Intelligence
Reports (Microsoft, 2015), respectively. The script
works by pulling all samples resulting from the search
request for each malware family, including all the
available variants, from an open malware database
Open Malware (Offensivecomputing, 2015). In addi-
tion, a large number of samples have also been down-
loaded from VirusTotal website (VirusTotal, 2015)
through their intelligence service.
We note that this method succeeded in getting
Towards an Understanding of the Misclassification Rates of Machine Learning-based Malware Detection Systems
103

more samples from the most common malware fam-
ilies. As a result of the previous step, 5410 malware
samples were collected. Our malware samples vary
between approximately 400 malware variants with a
date of discovery ranging from 08.12.1997 (Infos-
tealer) to 22.10.2015 (W32.Xpiro.I).
We have also parsed all the information found on
Symantecs’ Threats, Risks & Vulnerabilities (Syman-
tec, 2016a) pages in order to collect some valuable
information, such as: malware types, discovery date
of each malware family, and the risk level, in addition
to the systems affected.
Our benign executables (956 samples) were col-
lected from fresh installations of Windows XP SP3
and several official websites such as Windows and
Adobe. Windows XP SP3 was selected to be in-
stalled on the virtual machines during the analysis as
all the collected malware samples from 08.12.1997
to 22.10.2015 could run on this system according
to the Symantec’s systems affected information for
each malware family. In addition, Windows XP SP3
is widely used for the purpose of analysing mal-
ware (Ceron et al., 2016; Pektas¸ et al., 2015) for mul-
tiple reasons; one of them is the fact that it “consumes
less memory and CPU power” (Pektas¸ et al., 2015).
All the executables were sent to Virustotal in order
to retrieve the scanning results from multiple vendors
such as Symantec, Kaspersky, Avira, ClamAV and
others, and to ensure the integrity of the benign ap-
plications.
To analyse the malware and benign samples we
used Cuckoo Sandbox version 0.2 (Cuckoo Sandbox,
2015), an automated malware analysis system. The
sandbox executes samples in a controlled environ-
ment (virtual machines) for 120 seconds and gener-
ates reports with API calls, system traces in addition
to network activities in .pcap file. In order to decrease
the analysis time, we configured Cuckoo Sandbox to
use three virtual machines instead of one where all of
them will run simultaneously on a host machine that
runs Ubuntu 14.04.
After the analysis was completed, behavioural
analysis reports were parsed so that the extracted API
calls and the other information included in the report
could be added to our knowledge-base, along with
the information which was collected from Symantecs’
Threats, Risks & Vulnerabilities pages.
5 BUILDING A CLASSIFIER
This section discuss the process of extracting the fea-
tures that will be used and outlines the classification
procedure. This section also includes the metrics used
to measure performance throughout the paper.
5.1 Feature Extraction
In this paper, we used the API calls as our dynamic
features as they have been widely used as behavioural
features for such systems, and they also demonstrate
that they can offer a good representation of malware
behaviour (Fan et al., 2015; Faruki et al., 2012; Tian
et al., 2010; Pirscoveanu et al., 2015; Hansen et al.,
2016). Additionally, It also worth noting that rely-
ing on behavioural analysis helps to avoid problems
when dealing with some cases such as malware ob-
fuscation. Based on preliminary tests on 1282 mal-
ware samples from our data, we found that the fre-
quency of the APIs did not improve the classification
any further, which is similar to the conclusion reached
by (Tian et al., 2010), where only information related
to the presence of an API is important and not the
frequency. Thus we used the binary vector represen-
tation of the extracted APIs where 0 refers to the ab-
sence of an API call and 1 denotes its presence.
In addition, in our experiments we used an n-
gram based method to represent the API call se-
quence (Alazab et al., 2010) where unigram, bigram,
a combination of unigram and bigram, and trigram
have been evaluated. Using unigrams means that the
sequence of API words is unimportant, where we sim-
ply check if a word is present or not (aka ‘bag of
words’ representation). By using bigram and trigram,
the feature vector will not only contain a single API
word but also will preserve the sequence of two and
three words, respectively, which can be considered as
taking a snapshot of the malware behaviour.
We also believe that using a hybrid analysis (both
static and dynamic features) might boost the detection
rate further. However, as we intend to use the classi-
fier in checking malware behaviour in different sce-
narios such as: over time and with malware grouped
into variants, static analysis was beyond the scope of
this paper.
5.2 Evaluation Metrics
The following metrics have been used for evaluation
purposes throughout the paper:
• True positive (TP): Number of samples correctly
identified as malware.
• True negative (TN): Number of samples correctly
identified as benign.
• False positive (FP): Number of samples incor-
rectly identified as malware.
ICISSP 2017 - 3rd International Conference on Information Systems Security and Privacy
104

• False negative (FN) Number of samples incor-
rectly identified as benign.
These terms are used to define four performance
metrics which we use throughout the paper:
1. Sensitivity (recall): measures the proportion of
true positives: Sensitivity =
T P
T P+FN
2. Specificity: measures the proportion of true nega-
tives: Specificity =
T N
T N+FP
3. Geometric mean (G-mean): Also known as the
macro-averaged accuracy (Ferri et al., 2009); it
is the geometric mean of recall over all classes
and it is known in the field of machine learning
as a more accurate measure of performance than
the normal accuracy in an unbalanced classifica-
tion scenario as it considers the accuracy of both
classes: the majority and the minority (Lin and
Chen, 2012; Kang and Cho, 2006). The G-mean
can be calculated as follows:
G-mean=
√
Sensitivity ·Speci f icity
4. Area under the ROC curve (AUC
ROC
) (Huang and
Ling, 2005): The ROC curve is a graphical plot
that illustrates the performance of a binary clas-
sifier. The curve is created by plotting the true
positive rate (sensitivity) against the false positive
rate (1-specificity) at various threshold. The value
of AUC
ROC
can vary between 1.0 and 0, where
1 indicates a perfect classifier with an ideal sepa-
ration of the two classes, and an AUC
ROC
of 0.5
represents worthless classifier. AUC
ROC
is insen-
sitive to class imbalance; if the majority labels of
the data are positive or negative, a classifier which
always outputs 1 or 0, respectively, will have a
0.5 score although it will achieve a very high ac-
curacy. We calculated the AUC
ROC
score based
on the functions provided by Scikit-learn library,
where the library offers a wide range of machine
learning algorithms and tools (Scikit-learn, 2013).
Both metrics, G-mean and AUC
ROC
, are com-
monly used to evaluate the imbalanced data classifica-
tion performance. However as AUC
ROC
considers all
the possible thresholds, it is usually used to assess the
performance when choosing the best model that will
be used during the classification procedure. There-
fore, we used both G-mean and AUC
ROC
to choose
the best model on Section 5.3. Moreover, we used
the G-mean, which represents the balanced accuracy,
as our main metric when classifying malware based
on their year of discovery (Section 6.1). However,
in Section 6.2 we used sensitivity as our main metric
as it conforms with our goal there, which focused on
the classifier’s ability to correctly identify those mali-
cious instances without adding any noisy data related
to the benign samples.
5.3 Addressing the Imbalance Problem
For our classifiers, we used Support Vector Machine
(SVM) and Decision Tree (DT) as they are widely
known machine learning algorithms (Cortes and Vap-
nik, 1995; Kotsiantis et al., 2007). In addition,
they have shown State-of-the-Art results in a num-
ber of classification problems, including classifying
and recognising new malware (Zhang et al., 2006b;
Zhang et al., 2006a; Ye et al., 2009; Lu et al., 2010;
Alazab et al., 2010; Kruczkowski and Szynkiewicz,
2014) . The SVM and DT classifiers are based on the
implementation of Scikit-learn library.
As mentioned previously, we have also evaluated
the performance of our classifiers with different sizes
of n-grams: unigram, bigram, unigram+bigram and
trigram as shown in Table 1, and we have chosen the
best for each classifier. In the case of SVM, the bi-
gram and the unigram+bigram both gave us the best
results, however, as our aim is to test malware discov-
ered on the followed years where a match of an exact
sequence might not be found, we thus preferred to use
the unigram+bigram which will result in more gen-
eralisation, as it tests the occurrence of a single API
word, in addition to a sequence of two APIs together.
The class imbalance is a common problem in the
area of machine learning in general (Yap et al., 2014)
and in malware detection in particular (Moskovitch
et al., 2008; Ye et al., 2010). The imbalance prob-
lem occurs when the number of instances in each
class varies. In malware detection systems, this is
due to the fact that malware can be downloaded
on large numbers from open access databases, such
as Openmalware (Offensivecomputing, 2015), VX-
Heaven (VX Heaven, 2016), VirusShare (Virusshare,
2016), whereas it is more difficult to gather large
number of benign samples. The imbalance prob-
lem can affect the classification process as the clas-
sifier becomes more biased towards the majority class
which is usually the malicious class, as mentioned
in (Miao et al., 2015). Motivated by (Moskovitch
et al., 2008), where they stated that the classifica-
tion is more accurate when we have the same number
of malware and benign, we addressed this problem
by evaluating a well-known approach in the area of
machine learning that is referred to as Exactly Bal-
anced Bagging (EBBag) (Chang et al., 2003; Kang
and Cho, 2006; Khoshgoftaar et al., 2011). This ap-
proach is based on classifying balanced subsets; it is a
modified version of Bagging (Breiman, 1996), which
is a method that have been used extensively in mal-
ware detection systems with different base classifiers;
it delivers a considerably higher detection rate than
the normal classifiers (Ye et al., 2009) even with an
Towards an Understanding of the Misclassification Rates of Machine Learning-based Malware Detection Systems
105
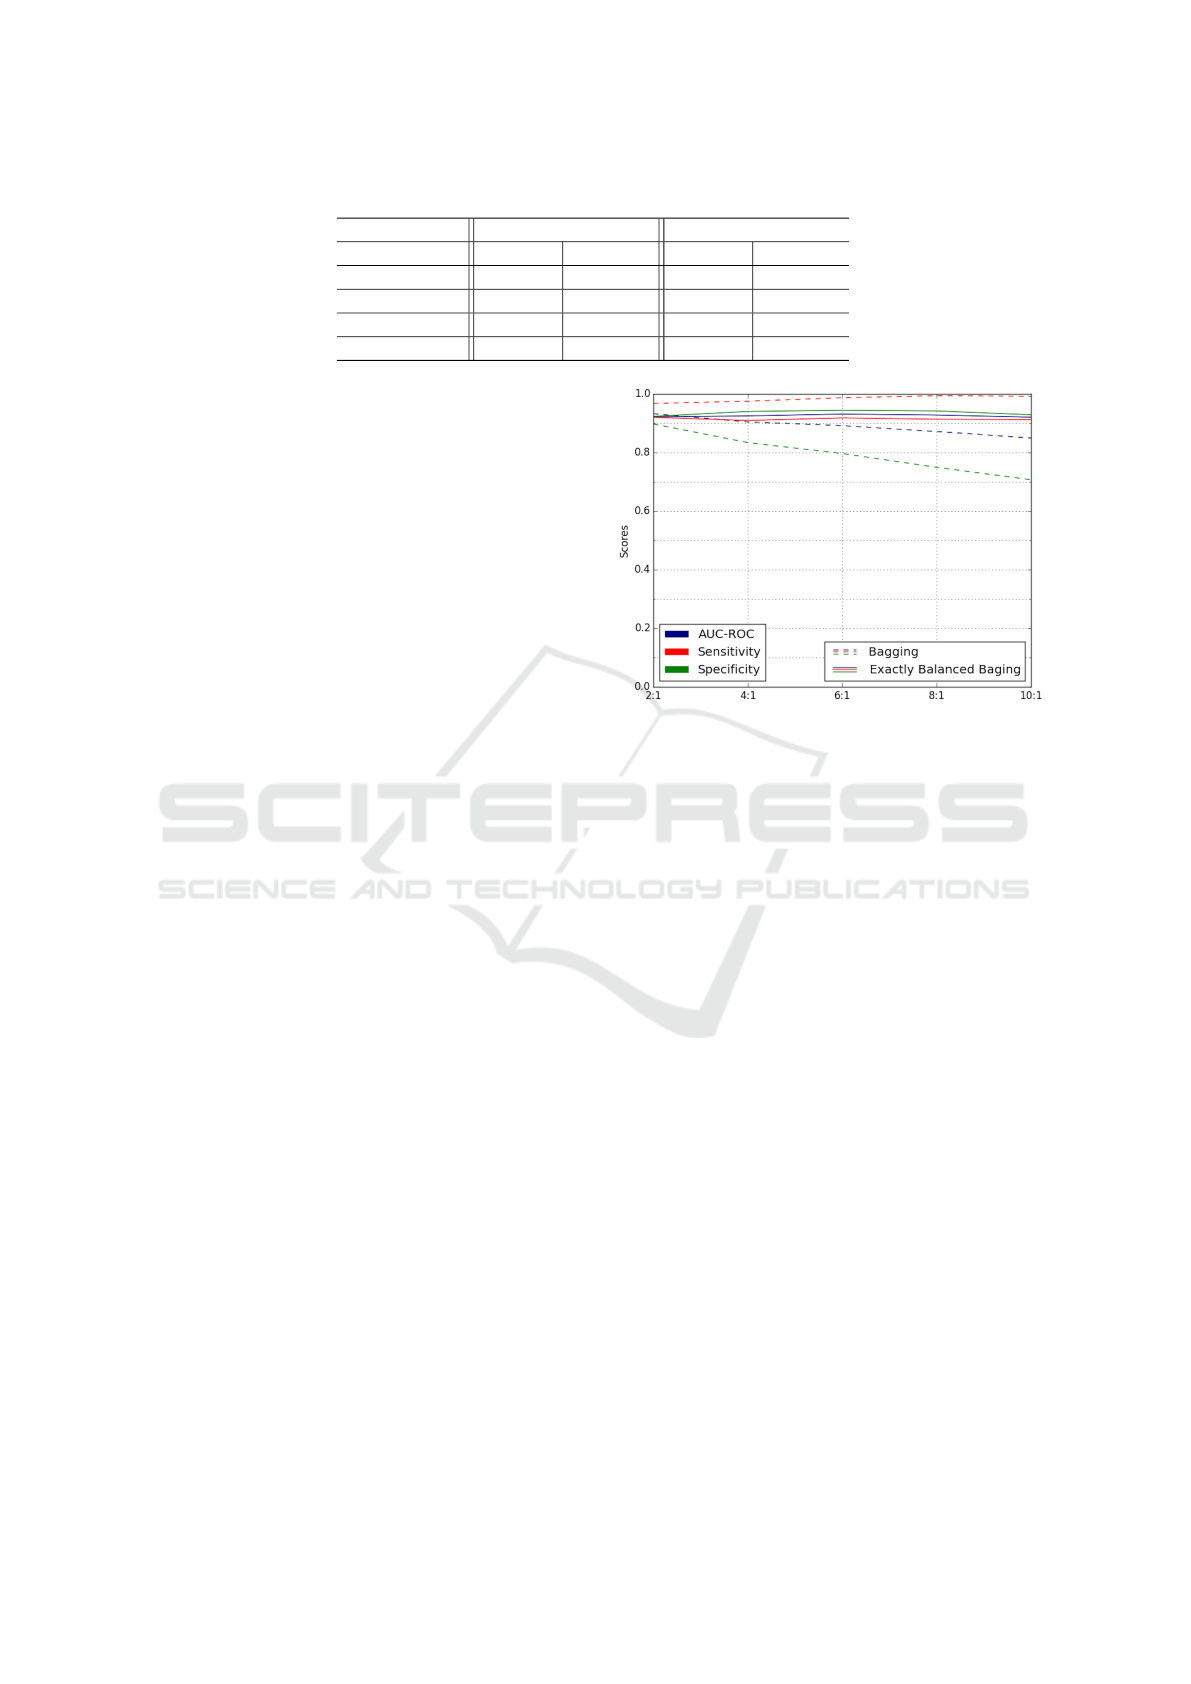
Table 1: Classifiers performance on different n-gram sizes.
SVM DT
Feature set G-mean AUC
ROC
G-mean AUC
ROC
API
Uni
0.93 0.93 0.93 0.93
API
Bigram
0.94 0.94 0.92 0.92
API
Uni+Bigram
0.94 0.94 0.92 0.92
API
Tigram
0.92 0.92 0.90 0.90
imbalance dataset (Peiravian and Zhu, 2013). To the
best of our knowledge, this paper is the first that uses
EBBag for malware detection.
Bagging, in general, is a classifier ensemble tech-
nique based on randomly drawn subsets of the train-
ing data. Each time a subset is drawn, a classifier is
constructed to classify the newly generated subsets.
The classification procedure is repeated a number of
times (we used 100 ) and the majority voting over all
predictions is calculated as the final prediction to en-
sure the robustness of the results.
Our framework implemented the EBBag approach
which is based on Bagging but with a minor modifi-
cation to the way the subsets are drawn. In EBBag,
the entire minority class is used for each classifier
along with randomly generated subsets of the ma-
jority class, which are the same size as the minority
class, so balancing the data. The procedure of gener-
ating smaller subsets is known as “downsampling”.
We ran five tests to compare Bagging with EBBag,
calculating the classification rate of randomly chosen
malware and benign samples, with a malware to be-
nign ratio varying between 2:1 and 10:1. We per-
formed 10-fold cross validation and compared our
adopted approach, EBBag, to the Bagging approach,
with the same base classifier (SVM) and the best n-
gram size. The results of these tests are shown in Fig-
ure 2. The figure shows the true positive rate (Sen-
sitivity), true negative rate (Specificity) and AUC
ROC
recorded for each approach. We note that Bagging
becomes increasingly inaccurate as the data becomes
more imbalanced. So the figure indicates that imbal-
anced data will be part of the cause of the misclassifi-
cation rate in papers that use Bagging alone to classify
malware.
By using EBBag, it can be seen that the measures
of sensitivity and specificity, which represent the ac-
curacy of the malicious and benign classes, respec-
tively, were not affected by the imbalance problem.
Also, the False Positive rate (1-specificity) was sig-
nificantly decreased from 0.29 to 0.07, where a false
positive occurs when a classifier flag a benign file as
malicious by mistake; this is usually costly as it con-
sumes a considerable amount of resources and time.
As this analysis shows that EBBag outperforms Bag-
ging, we used EBBag for the rest of the paper. Our
Figure 2: Classification rate with different ratio of malware
samples to benign.
implementation of EBBag have been made available
on: https://github.com/nalruhaily/EBBag.
6 CLASSIFYING A LARGE
GROUPED DATASET
In order to answer the main research questions we
have followed two methods to test the data:
1. Classifying all malware based on the year of dis-
covery.
2. Classifying malware based on malware variants.
Section 6.1 and 6.2 describe in detail the process used
in these two methods.
6.1 Classifying Malware based on the
Year of Discovery
In our first experiment, we tested the classifier on
data grouped into years, in order to check whether
there was a notable change in malware behaviour over
time, which will be represented as a change in the
classification rate. We divided the entire test set into
years from 2007 to 2014, based on the discovery date
recorded by Symantec, thus we ended up with 8 test-
ing sets. We chose one year intervals based on the
ICISSP 2017 - 3rd International Conference on Information Systems Security and Privacy
106
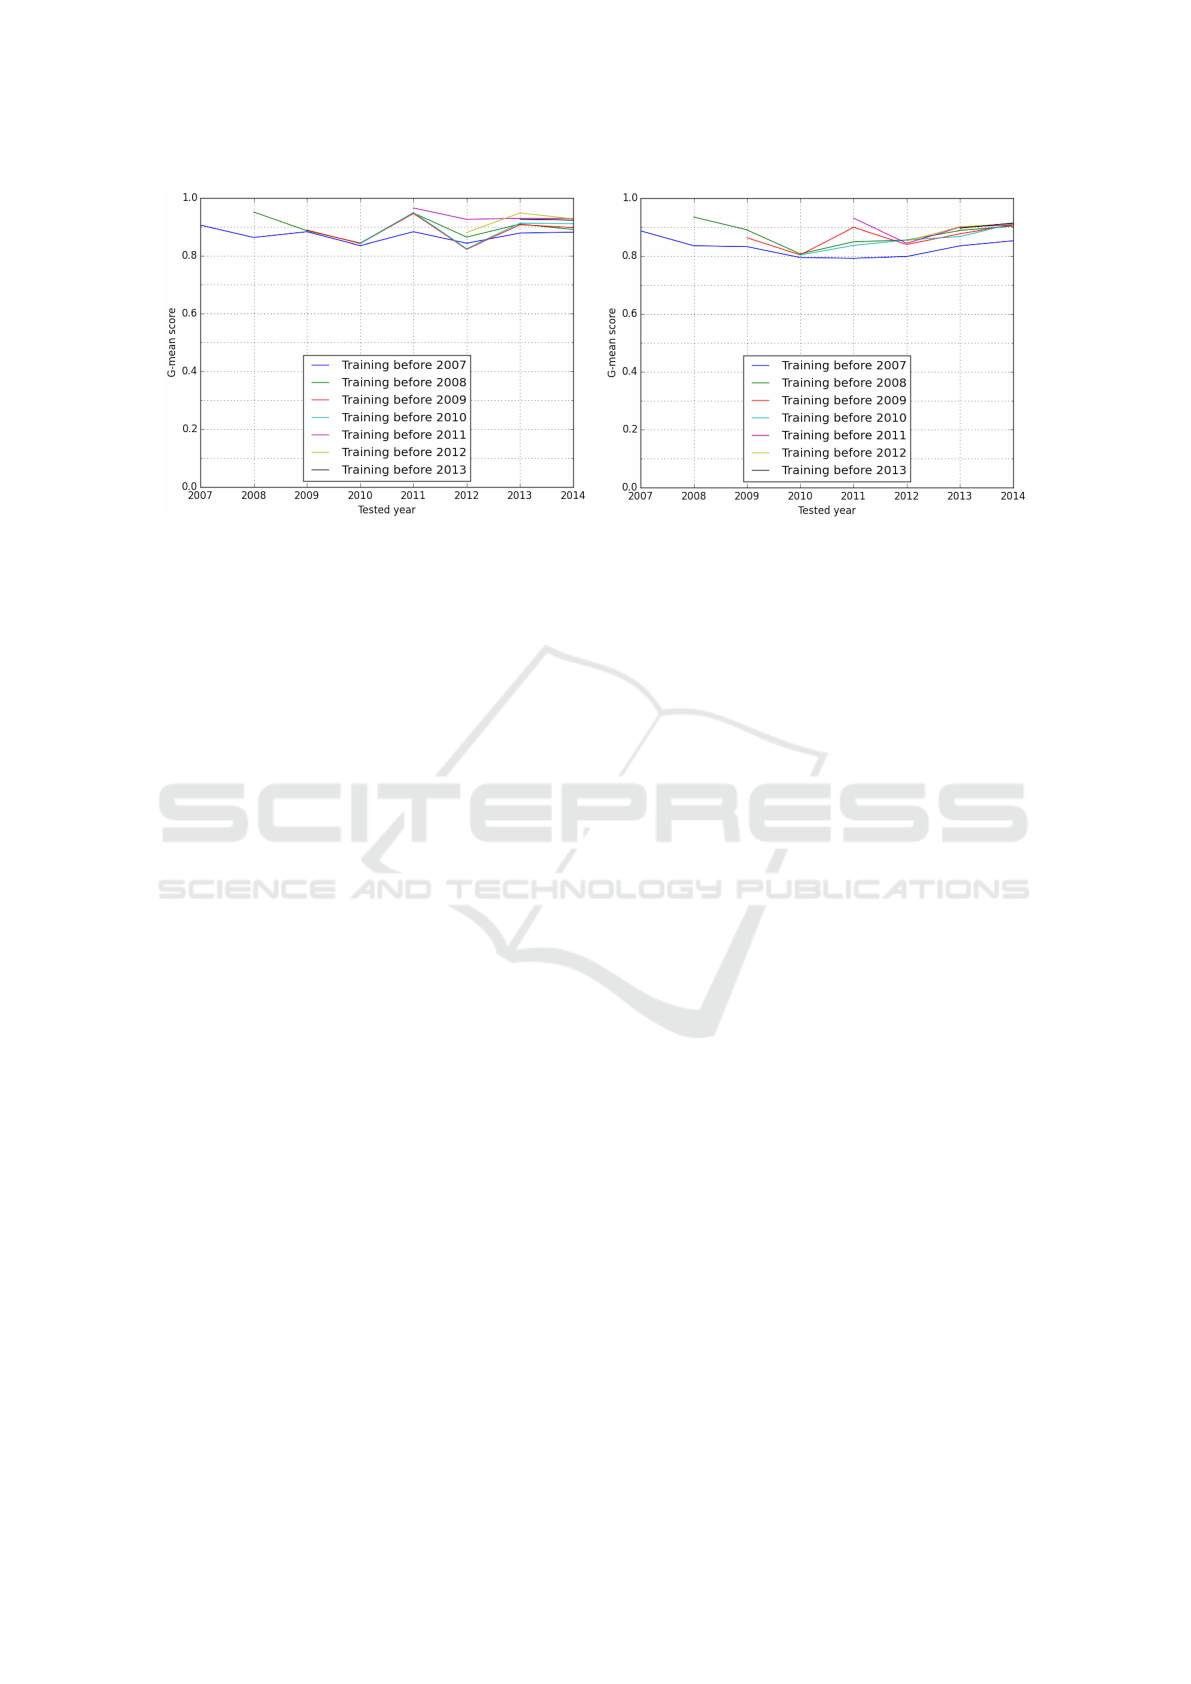
(a) Using SVM (b) Using DT
Figure 3: Malware tested yearly.
amount of data we had, as it was the minimum pe-
riod which was able to produce a stable results. The
initial training set included samples until year 2006.
Each time, the training set was evaluated separately
on each of the followed years, so for the initial train-
ing set it was evaluated on malware discovered from
2007 to 2014. We repeated the experiment by extend-
ing the training set to include the followed year and
test on the remaining years.
Figure 3 shows the averaged accuracy (G-mean)
recorded by our framework on data trained on real
malware samples. Most of the results showed that
the classifier can maintain a score above 80%. It
can also be seen that the more the data included in
the training phase, the higher the G-mean score for
the following year was, except for some cases where
a new family was introduced, such as in 2009 and
2010, or where a new variant with a slightly differ-
ent behaviour was introduced such as in 2012 with
W32.Ramnit.B!gen2. In fact, although some variants
of the malware family W32.Ramnit were introduced
before 2012 and the system was trained on some of
them, it failed to identify this variant correctly. It
seems that W32.Ramnit.B!gen2 variant implements
some anti-sandboxing techniques where the malware
tried to unhook Windows functions monitored by the
sandbox, causing the Cuckoo monitor to throw 1025
exceptions.
However, overall from Figure 3 we can conclude
that the detection rate was not consistently affected by
the passage of time; instead, the classifiers, generally,
can continue giving a good detection rate. Thus, to
analyse the results further, we carried out another ex-
periment which is explained in the next section. The
experiment aimed to check whether the misclassifica-
tion caused by the changes in malware behaviour can
be traced back to a number of malware families or
even to sub-families (a.k.a variants).
6.2 Classifying Malware based on
Malware Variants
In this experiment we tested seven malware fami-
lies (broken down into variants) in order to check
whether the misclassified malware instances were a
result of undetected behavioural changes at the mal-
ware family level or whether they were caused by
other changes in the level of variants.
The experiment was conducted for seven families,
namely: W32.Changeup, W32.Pilleuz, W32.Imaut,
W32.Sality, Trojan.FakeAV, Trojan.Zbot and Tro-
jan.Gen. The remaining families were not used due to
an insufficient amount of samples for each particular
variant in the available data set. These seven families
correspond to a total of 2737 malware samples. For
testing each of these families we trained the classifier
on malware data prior to 2007, as we will have af-
ter this date a reasonable number of malware families
grouped into variants to carry out the testing process.
We used sensitivity here as our main metric in
the experiment (referred to in the table as Sens) to
measure the detection rate as it conforms with our
goal, which is focusing on the classifier’s ability to
correctly identify those malicious instances without
adding any noisy data related to the benign samples.
Table 2 shows the results of classifying each of the
malware families, including their available variants. It
appears, mostly, that there is no absolute pattern be-
tween the misclassification and the malware family,
nor with the discovered year of each of the variants.
Therefore, it can be concluded that most of the mis-
classification can be traced back to several malware
variants and it cannot be traced back to the discovery
date of each of the tested variants, nor to changes at
Towards an Understanding of the Misclassification Rates of Machine Learning-based Malware Detection Systems
107

Table 2: Tested by classifiers trained before 2007.
Variants # Date SVM-Sens DT-Sens
Changeup
W32.Changeup 41 18/08/09 0.98 0.98
W32.Changeup!gen9 48 02/09/10 1.0 1.0
W32.Changeup!gen10 47 02/02/11 1.0 1.0
W32.Changeup!gen12 47 11/08/11 1.0 1.0
W32.Changeup!gen16 51 20/07/12 1.0 1.0
W32.Changeup!gen44 76 01/08/13 0.99 1.0
W32.Changeup!gen46 67 28/05/14 1.0 1.0
W32.Changeup!gen49 64 20/08/14 0.94 1.0
Pilleuz
W32.Pilleuz!gen1 47 19/01/10 0.77 0.68
W32.Pilleuz!gen6 138 29/09/10 0.88 0.86
W32.Pilleuz!gen19 70 17/01/11 0.97 0.79
W32.Pilleuz!gen21 64 29/03/11 0.28 0.03
W32.Pilleuz!gen30 46 01/02/12 1.0 1.0
W32.Pilleuz!gen36 60 07/02/13 1.0 1.0
W32.Pilleuz!gen40 98 22/08/13 1.0 1.0
Imaut
W32.Imaut.AA 68 07/06/07 0.97 0.80
W32.Imaut.AS 45 01/08/07 0.84 0.84
W32.Imaut.CN 73 20/02/08 0.85 0.92
W32.Imaut.E 64 23/12/08 0.88 0.83
W32.Imaut!gen1 46 20/09/10 0.24 0.04
Sality
W32.Sality.X 46 12/01/07 0.96 0.93
W32.Sality.Y!inf 91 16/03/07 0.98 0.98
W32.Sality.AB 55 11/01/08 0.02 0.02
W32.Sality.AE 71 20/04/08 0.93 0.87
W32.Sality.AM 51 18/04/09 0.80 0.75
W32.Sality!dr 71 31/08/10 0.80 0.80
W32.Sality!dam 54 30/04/13 0.15 0.15
W32.Sality.AF 93 02/01/14 0.90 0.77
FakeAV
Trojan.FakeAV 41 10/10/07 0.68 0.85
Trojan.FakeAV!gen29 70 07/05/10 0.99 0.93
Trojan.FakeAV!gen99 38 08/03/13 1.0 1.0
Trojan.FakeAV!gen119 42 01/04/14 0.29 0.12
Zbot
Trojan.Zbot 40 10/01/10 0.98 0.28
Trojan.Zbot!gen9 48 16/08/10 1.0 0.94
Trojan.Zbot!gen43 48 26/05/13 0.85 0.88
Trojan.Zbot!gen71 44 23/12/13 1.0 0.11
Trojan.Zbot!gen75 32 05/06/14 0.69 0.97
Gen
Trojan.Gen 202 19/02/10 0.48 0.77
Trojan.Gen.2 137 20/08/10 0.45 0.45
Trojan.Gen.X 52 12/01/12 0.42 0.42
Trojan.Gen.SMH 52 26/10/12 0.62 0.40
Trojan.Gen.3 99 06/08/13 0.61 0.60
the level of the malware family (which would affect
all of that families’ future variants).
7 REASONS FOR
MISCLASSIFICATION
Our aim in this section is to analyse the classifica-
tion results. This also includes outlining the differ-
ences between the correctly classified and the mis-
classified variants and explaining the reasons that may
ICISSP 2017 - 3rd International Conference on Information Systems Security and Privacy
108

have led to the misclassification. Generally, From Ta-
ble 2 we can identify three misclassification cases al-
though most of the misclassifications occurred at the
level of variants. We can summarise the different mis-
classification cases as follows:
• Variants misclassified by both classifiers.
• Variants misclassified by only one classifier.
• Misclassification which occurred on the family
level instead of variants.
7.1 Variants Misclassified by Both
Classifiers
Table 2 shows malware variants misclassified by
both classifiers: SVM and DT. These variants
are: W32.Pilleuze!gen21, W32.Sality.AB , W32.Sality
!dam, W32.Imaut!gen1 and Trojan.FakeAV! gen119.
In the case of the W32.Pilleuze!gen21, W32.Sality
!dam and W32.Sality.AB variants, it seems that they
have not performed any behavioural action when
being analysed. This can happens because the
samples implemented some anti-virtualisation tech-
niques, or they were looking for a specific argu-
ment, or because they were corrupted files. All
three mentioned variants terminated the process
by calling NtTerminateProcess. In case of W32.
Sality.AB and W32.Sality!dam they also adopted a
stealthiness technique, where they disabled the er-
ror messages through calling SetErrorMode API
with the arguments SEM NOGPFAULTERRORBOX
— SEM NOOPENFILEERRORBOX. After looking
at W32.Sality!dam page on Symantec (Symantec,
2013b) it seems that this variant is considered as a
corrupted file where it can no longer be executed or
infect other files. As stated previously, while remov-
ing all examples of misclassified corrupted malware
from our dataset would have been possible, we note
no other work on malware classification do this, so
removing these samples would not reflect other work.
The W32.Imaut!gen1 worm, on the other hand, did
not terminate the process, however, it did not perform
any network activity which might led to being mis-
classified. In fact only 2 samples out of the 46 carried
out some network activities and both of them were
classified correctly.
In the case of Trojan.FakeAV!gen119, the malware
variant used an uncommon API, (compared to oth-
ers in our database), to connect to the Internet: In-
ternetOpenW, InternetOpenUrlW which are the Uni-
code based API of the high-level Internet API: Win-
dows Internet (WinINet). The calls used by this
variant takes arguments in Unicode format, while
the older variants of this malware family used the
Table 3: Performance on stemmed and un-stemmed features
set.
un-stemmed
280 API
stemmed
230 API
G-mean AUC G-mean AUC
SVM 0.95 0.95 0.94 0.94
DT 0.92 0.92 0.92 0.92
ASCII based API calls instead: InternetOpenA, Inter-
netOpenUrlA. This raises the question: would normal-
ising the API by removing the appended characters
such as A, W, ExW, and ExA when processing the fea-
tures, such as having only Inter netOpen in the features
set instead of multiple entries will increase the overall
accuracy of API based classifiers?
To answer this question we carried out another ex-
periment, using all of our data and normalising the
Win32 API by removing the appended characters,
such as A, W, ExA and ExW. We then performed 10-
fold cross validation to assess the performance of the
classifier using the stemmed and un-stemmed features
set. The results are shown in Table 3.
It can be seen from Table 3 that removing the ap-
pended letters did not have a considerable impact on
the classification rate. However, by removing the ap-
pended characters we ended up with approximately
230 features instead of 280, without significantly af-
fecting the detection rate. Such an option can be con-
sidered to improve the efficiency of the classifier and
minimise the time needed for the classification. We
note that other papers (Sami et al., 2010; Veeramani
and Rai, 2012; Salehi et al., 2014) use feature selec-
tion methods to reduce the number of features in their
datasets, however, they do not use API stemming,
which Table 3 suggests might be a helpful addition.
7.2 Variants Misclassified by Only One
Classifier
Another case which we have investigated can be seen
in Trojan.Zbot and Trojan.Zbot!gen71, where most of
their instances have been correctly classified by the
SVM classifier. However, DT failed to classify these
samples correctly. We analysed random trees con-
structed by the classifier to be able to determine the
reasons for the misclassification. In the case of Tro-
jan.Zbot, it seems that the absence of the call: SetWin-
dowsHookExA was the reason for the misclassifica-
tion on almost all the variant’s samples. While in
case of Trojan.Zbot!gen71 variant, the correctly classi-
fied malware called the NtProtectVirtualMemory API
to allocates a read-write-execute memory. This API is
usually called by malware binaries during the unpack-
ing process, and the absence of this call might indicate
Towards an Understanding of the Misclassification Rates of Machine Learning-based Malware Detection Systems
109

that the malware sample was not packed, which, on
our case, led to the misclassification of the incorrectly
classified instances.
7.3 Misclassification on Malware
Family Level
Although most of the misclassification seen occurred
at the variant level, there is a single case where the
misclassification can be linked to the family instead,
as can be seen in Table 2 in the case of Trojan.Gen
family. The reason that this family is different from
the others seems to be due to the fact that this fam-
ily is actually a category “ for many individual but
varied Trojans for which specific definitions have not
been created ” as stated by Symantec on the Tro-
jan.Gen family page (Symantec, 2016b). By check-
ing the misclassified samples and the paths taking by
samples belonging to this family, it can be seen that
although the samples may share some general charac-
teristics, they adopt different techniques and thus the
samples can behave in various ways and take differ-
ent paths on trees generated by DT classifier (approx-
imately 15 different behavioural paths), unlike other
families where their behaviour was very uniform (2
or 3 paths).
As we have explained, the behavioural profiles
and definitions that resulted from this family were
varied and thus we only giving examples for some
of the misclassification cases here, as identifying all
the reasons for the misclassification for this family
would not be possible. Many of the misclassified in-
stances did not connect to the Internet either, because
the malware were applying some anti-virtualisation
techniques, an example of this case is: Trojan.Gen.X;
or they were terminating the process as a specific ar-
gument had not been found, as in Trojan.Gen.3. In
the case of Trojan.Gen.X, nearly half of the misclas-
sified samples belonging to this variant were monitor-
ing the user window by calling GetForegroundWin-
dow and checking the mouse movement through call-
ing theGetCursorPos API. They also followed these
calls by calling GetKeyState to monitor the following
keys constantly: the mouse keys, Alt, Ctrl, and shift
key. The execution was then delayed through going
on a loop when monitoring these actions and NtDe-
layExecution also have been called. These techniques
have been noticed when analysing recent malware, as
reported by malware researchers (SCHICK, 2016) in
order to evade sandbox detection, and this could be
the reason why all the variants that used that tech-
nique have been misclassified.
8 CONCLUSION
In this paper, we classified malware grouped into their
year of discovery, in addition to grouping them into
malware variants. We have tracked the misclassified
malware instances and we investigated whether there
were recognisable patterns across these misclassified
samples. From our first experiment we found that
classifiers can continue to give a high detection rate
even after a period of time which means that there
is no correlation between the passage of time and the
misclassification that occurred, despite a minor rise of
the detection rate on the following year. We then con-
cluded from our second experiment that, mostly, there
were little recognisable patterns between the misclas-
sification and malware families, as with the discov-
ered year of malware variants. Instead, most of the
misclassifications can be traced back to several mal-
ware variants. This variation which occurred on the
variant level is due to the fact that some variants apply
some anti-sandboxing techniques, or because some
samples are looking for a specific argument to run,
or due to the fact that some variants are actually con-
sidered as bad data. This conclusion can help in inter-
preting the successful rate achieved when proposing a
machine learning based detection system.
Also, the situation where only some variants are
unrecognisable might be due to the fact that malware
writers are not trying to evade, yet, machine learning
techniques as they are still considered as new tech-
niques to detect malware, and have not been used as
widely as the signature based ones. If these recogni-
tion systems became more common, it might be the
case that we would see more of these techniques used
to evade the detection by such systems.
For future work, we are aiming to investigate
whether using hybrid features with our proposed de-
tection system, instead of only using behavioural fea-
tures, outperform the State-of-the-Art detection sys-
tems.
ACKNOWLEDGEMENTS
We would like to express our sincere gratitude to
Professor Peter Tino, Chair of Complex and Adap-
tive Systems in the University of Birmingham, for his
valuable advise and suggestions. We would like also
to thank VirusTotal for providing us with access to
their intelligence service in addition to a private API.
ICISSP 2017 - 3rd International Conference on Information Systems Security and Privacy
110

REFERENCES
Alazab, M., Layton, R., Venkataraman, S., and Watters, P.
(2010). Malware detection based on structural and be-
havioural features of api calls.
Bailey, M., Oberheide, J., Andersen, J., Mao, Z. M., Ja-
hanian, F., and Nazario, J. (2007). Automated clas-
sification and analysis of internet malware. In Re-
cent Advances in Intrusion Detection, pages 178–197.
Springer.
Breiman, L. (1996). Bagging predictors. Machine learning,
24(2):123–140.
Ceron, J. M., Margi, C. B., and Granville, L. Z. (2016).
Mars: An sdn-based malware analysis solution. In
2016 IEEE Symposium on Computers and Communi-
cation (ISCC), pages 525–530. IEEE.
Chang, E. Y., Li, B., Wu, G., and Goh, K. (2003). Statistical
learning for effective visual information retrieval. In
ICIP (3), pages 609–612. Citeseer.
Cortes, C. and Vapnik, V. (1995). Support-vector networks.
Machine learning, 20(3):273–297.
Cuckoo Sandbox (2015). Automated malware analysis -
cuckoo sandbox. http://www.cuckoosandbox.org/.
Fan, C.-I., Hsiao, H.-W., Chou, C.-H., and Tseng, Y.-F.
(2015). Malware detection systems based on api log
data mining. In Computer Software and Applications
Conference (COMPSAC), 2015 IEEE 39th Annual,
volume 3, pages 255–260. IEEE.
Faruki, P., Laxmi, V., Gaur, M. S., and Vinod, P. (2012).
Behavioural detection with api call-grams to identify
malicious pe files. In Proceedings of the First Inter-
national Conference on Security of Internet of Things,
pages 85–91. ACM.
Ferri, C., Hern
´
andez-Orallo, J., and Modroiu, R. (2009).
An experimental comparison of performance mea-
sures for classification. Pattern Recognition Letters,
30(1):27–38.
Firdausi, I., Lim, C., Erwin, A., and Nugroho, A. S.
(2010). Analysis of machine learning techniques used
in behavior-based malware detection. In Advances
in Computing, Control and Telecommunication Tech-
nologies (ACT), 2010 Second International Confer-
ence on, pages 201–203. IEEE.
Hansen, S. S., Larsen, T. M. T., Stevanovic, M., and Peder-
sen, J. M. (2016). An approach for detection and fam-
ily classification of malware based on behavioral anal-
ysis. In 2016 International Conference on Computing,
Networking and Communications (ICNC), pages 1–5.
IEEE.
Huang, J. and Ling, C. X. (2005). Using auc and accuracy
in evaluating learning algorithms. IEEE Transactions
on knowledge and Data Engineering, 17(3):299–310.
Islam, R., Tian, R., Moonsamy, V., and Batten, L. (2012).
A comparison of the classification of disparate mal-
ware collected in different time periods. Journal of
networks, 7(6):946–955.
Kang, P. and Cho, S. (2006). Eus svms: Ensemble of under-
sampled svms for data imbalance problems. In Inter-
national Conference on Neural Information Process-
ing, pages 837–846. Springer.
Khoshgoftaar, T. M., Van Hulse, J., and Napolitano, A.
(2011). Comparing boosting and bagging techniques
with noisy and imbalanced data. IEEE Transactions
on Systems, Man, and Cybernetics-Part A: Systems
and Humans, 41(3):552–568.
Kotsiantis, S. B., Zaharakis, I., and Pintelas, P. (2007). Su-
pervised machine learning: A review of classification
techniques.
Kruczkowski, M. and Szynkiewicz, E. N. (2014). Sup-
port vector machine for malware analysis and classi-
fication. In Proceedings of the 2014 IEEE/WIC/ACM
International Joint Conferences on Web Intelligence
(WI) and Intelligent Agent Technologies (IAT)-Volume
02, pages 415–420. IEEE Computer Society.
Lin, W.-J. and Chen, J. J. (2012). Class-imbalanced classi-
fiers for high-dimensional data. Briefings in bioinfor-
matics, page bbs006.
Lu, Y.-B., Din, S.-C., Zheng, C.-F., and Gao, B.-J. (2010).
Using multi-feature and classifier ensembles to im-
prove malware detection. Journal of CCIT, 39(2):57–
72.
Maxwell, K. (2012). Mwcrawler. https://github.com/
0day1day/mwcrawler.
Maxwell, K. (2015). Maltrieve. https://github.com/
technoskald/maltrieve.
Miao, Q., Liu, J., Cao, Y., and Song, J. (2015). Malware
detection using bilayer behavior abstraction and im-
proved one-class support vector machines. Interna-
tional Journal of Information Security, pages 1–19.
Microsoft (2015). Microsoft security intelligence re-
port (sir). http://www.microsoft.com/security/sir/
default.aspx.
Moser, A., Kruegel, C., and Kirda, E. (2007). Limits of
static analysis for malware detection. In Computer
security applications conference, 2007. ACSAC 2007.
Twenty-third annual, pages 421–430. IEEE.
Moskovitch, R., Feher, C., and Elovici, Y. (2008). Unknown
malcode detectiona chronological evaluation. In In-
telligence and Security Informatics, 2008. ISI 2008.
IEEE International Conference on, pages 267–268.
IEEE.
Offensivecomputing (2015). Open malware. http://
www.offensivecomputing.net.
Peiravian, N. and Zhu, X. (2013). Machine learning for
android malware detection using permission and api
calls. In 2013 IEEE 25th International Conference
on Tools with Artificial Intelligence, pages 300–305.
IEEE.
Pektas¸, A., Acarman, T., Falcone, Y., and Fernandez, J.-C.
(2015). Runtime-behavior based malware classifica-
tion using online machine learning. In 2015 World
Congress on Internet Security (WorldCIS), pages 166–
171. IEEE.
Pirscoveanu, R. S., Hansen, S. S., Larsen, T. M., Ste-
vanovic, M., Pedersen, J. M., and Czech, A. (2015).
Analysis of malware behavior: Type classification us-
ing machine learning. In Cyber Situational Aware-
ness, Data Analytics and Assessment (CyberSA), 2015
International Conference on, pages 1–7. IEEE.
Salehi, Z., Sami, A., and Ghiasi, M. (2014). Using feature
Towards an Understanding of the Misclassification Rates of Machine Learning-based Malware Detection Systems
111

generation from api calls for malware detection. Com-
puter Fraud & Security, 2014(9):9–18.
Sami, A., Yadegari, B., Rahimi, H., Peiravian, N., Hashemi,
S., and Hamze, A. (2010). Malware detection based
on mining api calls. In Proceedings of the 2010 ACM
symposium on applied computing, pages 1020–1025.
ACM.
SCHICK, S. (2016). Security intelligence:
Tinba malware watches mouse movements,
screen activity to avoid sandbox detection.
https://securityintelligence.com/news/tinba-malware-
watches-mouse-movements-screen-activity-to-avoid-
sandbox-detection/.
Scikit-learn (2013). Scikit-learn: machine learning in
python. http://scikit-learn.org/stable/.
Shabtai, A., Moskovitch, R., Feher, C., Dolev, S., and
Elovici, Y. (2012). Detecting unknown malicious code
by applying classification techniques on opcode pat-
terns. Security Informatics, 1(1):1–22.
Symantec (2013a). Symantec: Symantec secu-
rity response - virus naming conventions.
https://www.symantec.com/security response/
virusnaming.jsp.
Symantec (2013b). Symantec: W32.sality!dam.
https://www.symantec.com/security response/writeup.
jsp?docid=2013-043010-4816-99.
Symantec (2015). Internet security threat report.
http://www.symantec.com/security response/
publications/threatreport.jsp.
Symantec (2016a). Symantec: A-z listing of threats & risks.
https://www.symantec.com/security response/landing/
azlisting.jsp.
Symantec (2016b). Symantec: Trojan.gen.
https://www.symantec.com/security response/writeup.
jsp?docid=2010-022501-5526-99.
Tian, R., Islam, R., Batten, L., and Versteeg, S. (2010).
Differentiating malware from cleanware using be-
havioural analysis. In Malicious and Unwanted Soft-
ware (MALWARE), 2010 5th International Confer-
ence on, pages 23–30. IEEE.
Veeramani, R. and Rai, N. (2012). Windows api based mal-
ware detection and framework analysis. In Interna-
tional conference on networks and cyber security, vol-
ume 25.
Virusshare (2016). Virusshare.com. http://vxheaven.org.
VirusTotal (2015). Virustotal - free online virus, malware
and url scanner. https://www.virustotal.com/.
VX Heaven (2016). Vxheaven.org. http://vxheaven.org.
Walenstein, A. and Lakhotia, A. (2007). The software simi-
larity problem in malware analysis. In Dagstuhl Sem-
inar Proceedings. Schloss Dagstuhl-Leibniz-Zentrum
f
¨
ur Informatik.
Wang, C., Pang, J., Zhao, R., and Liu, X. (2009). Using
api sequence and bayes algorithm to detect suspicious
behavior. In Communication Software and Networks,
2009. ICCSN’09. International Conference on, pages
544–548. IEEE.
Xu, J.-Y., Sung, A. H., Chavez, P., and Mukkamala, S.
(2004). Polymorphic malicious executable scanner
by api sequence analysis. In Hybrid Intelligent Sys-
tems, 2004. HIS’04. Fourth International Conference
on, pages 378–383. IEEE.
Yap, B. W., Rani, K. A., Rahman, H. A. A., Fong, S.,
Khairudin, Z., and Abdullah, N. N. (2014). An appli-
cation of oversampling, undersampling, bagging and
boosting in handling imbalanced datasets. In Pro-
ceedings of the First International Conference on Ad-
vanced Data and Information Engineering (DaEng-
2013), pages 13–22. Springer.
Ye, Y., Chen, L., Wang, D., Li, T., Jiang, Q., and Zhao, M.
(2009). Sbmds: an interpretable string based malware
detection system using svm ensemble with bagging.
Journal in computer virology, 5(4):283–293.
Ye, Y., Li, T., Huang, K., Jiang, Q., and Chen, Y. (2010). Hi-
erarchical associative classifier (hac) for malware de-
tection from the large and imbalanced gray list. Jour-
nal of Intelligent Information Systems, 35(1):1–20.
Ye, Y., Wang, D., Li, T., Ye, D., and Jiang, Q. (2008).
An intelligent pe-malware detection system based on
association mining. Journal in computer virology,
4(4):323–334.
Zhang, B., Yin, J., Tang, W., Hao, J., and Zhang, D.
(2006a). Unknown malicious codes detection based
on rough set theory and support vector machine.
In The 2006 IEEE International Joint Conference
on Neural Network Proceedings, pages 2583–2587.
IEEE.
Zhang, B.-y., Yin, J.-p., Hao, J.-b., Zhang, D.-x., and Wang,
S.-l. (2006b). Using support vector machine to detect
unknown computer viruses. International Journal of
Computational Intelligence Research, 2(1):100–104.
Zhao, H., Xu, M., Zheng, N., Yao, J., and Ho, Q. (2010).
Malicious executables classification based on behav-
ioral factor analysis. In e-Education, e-Business, e-
Management, and e-Learning, 2010. IC4E’10. Inter-
national Conference on, pages 502–506. IEEE.
ICISSP 2017 - 3rd International Conference on Information Systems Security and Privacy
112
