
Detecting Non-lambertian Materials in Video
Seyed Mahdi Javadi, Yongmin Li and Xiaohui Liu
Department of Computer Science, Brunel University, London, U.K.
Keywords:
Texture Analysis, Object Recognition, Lambert Model, Shiny Surface, Matt Texture, Glass and Water
Detection.
Abstract:
This paper describes a novel method to identify and distinguish shiny and glossy materials in videos automat-
ically. The proposed solution works by analyzing the logarithm of chromaticity of sample pixels from various
materials over a period of time to differentiate between shiny and matt textures. The Lambertian materials
have different reflectance model and the distribution of their chromaticity is not the same as non-Lambertian
texture. We will use this to detect shiny materials. This system has many application in texture and object
recognition, water leakage and oil spillage detection systems.
1 INTRODUCTION
Object detection and texture analysis are important
topics in image and video processing and have many
applications in visual systems. In this paper we pro-
pose a new solution to distinguish matt and shiny sur-
faces. This method can be used to automatically de-
tect water leakage, oil spillage, glass and metal de-
tection etc. Unlike many of the exiting systems, no
training data or manual interaction with user is need
and glossy materials are detected automatically with-
out any input from user. Our solution works in natural
outdoor scenarios during day time where illumination
varies. No additional information such as time and
GPS location is needed and using stationary camera,
successful detection is achieved in around 15 minutes
of video recording.
Our method works by analyzing how different
types of materials reflect light and use this to automat-
ically categorize textures into Lambertian and non-
Lambertian texture types. We use the logarithm of
chromaticity of texture pixels over a period of time
and show that matt and shiny materials display differ-
ent patterns and trajectories and use this information
for our detection algorithm. We plot the trajectory
of logarithm of chromaticity and show that matt tex-
tures show linear pattern over time while glossy ob-
jects don’t.
By analyzing the distribution of of reflectance
from matt and glossy object, we can develop a system
that can distinguish these materials. Additionally, we
have used the same methodology to differentiate be-
tween glare and white objects. Glare or excessive re-
flectance impacts tracking and object recognition sys-
tems and here we have proposed a novel solution to
detect and reduce the impact of glare in video.
The rest of the paper is organized as follow. Sec-
tion 2 describes the background of this topic and Sec-
tion 3 explains our method and describes how we are
identifying glossy materials. Section 4 shows our ex-
periments and section 5 is the summary of this paper.
2 LITERATURE REVIEW
Texture analysis is an important topic in image pro-
cessing. Malik and Liuin (Malik and T.Leung, 2001)
categorized different materials such as concrete, rug,
marble, or leather on the basis of their textural appear-
ance and they devid them into two surface attributes:
(1) reflectance and (2) surface normal. In their work
they provided a unified model to address both these
aspects of natural texture. Get et al. (Ged et al., 2010)
presented gloss as an appearance attribute that could
reveal certain information about object properties and
concluded that observers can apprehend the physi-
cal nature of the surface of real objects from features
that are included in the BRDF and available in the
gloss appearance. Obein (Knoblauch and Viot, 2010)
provided a measurement to calculate the strength if
gloss which they explained it as attribute of visual ap-
pearance that originates from the geometrical distri-
bution of the light reflected by the polished surface.
they used the maximum likelihood difference scaling
(MLDS) procedure by Maloney (Maloney and Yang,
2003) to estimate gloss scales over an extended range.
Arora (Arora and Werman, 2014) presented a
new approach to evaluate the illuminant chromaticity
254
Javadi S., Li Y. and Liu X.
Detecting Non-lambertian Materials in Video.
DOI: 10.5220/0006185002540259
In Proceedings of the 12th International Joint Conference on Computer Vision, Imaging and Computer Graphics Theory and Applications (VISIGRAPP 2017), pages 254-259
ISBN: 978-989-758-225-7
Copyright
c
2017 by SCITEPRESS – Science and Technology Publications, Lda. All rights reserved
which does not need exact correspondences and has a
better estimate of illuminant chromaticity. They used
the evaluated chromaticity to project the input images
on to a specular invariant color space and showed that
standard optical flow algorithms on this color space
significantly improves the results. Other works such
as (Prinet et al., 2014),(Yoon and Kweon, 2006) and
(Yang et al., 2011) provide similar approach to re-
move the impact of glare from glossy texture.
Multi-view solutions are has been extensively re-
searched and they provide an alternative approach
to the issue of irregular reflectance from glossy tex-
tures. Li and Liu (Li et al., 2011) reconstructed
3D fine-scale surface models for non-Lambertian ob-
jects from multi-view multi-illumination image sets.
Their solution provides good results but requires mul-
tiple images from different angel to produce the 3-D
model. This is a very effective and popular approach
and many other works such as (Basri and Jacobs,
2003) , (Hertzmann and Seitz, 2005) and (Schechner
et al., 2007) have used the same method. Although
muti-view methods produce good results they require
users to take pictures from different angels manually.
Unlike these methods, our system detects the non-
lambertian texture automatically and does not need
any manual interaction.
Texture analysis is a very important topic in image
and video processing and has many application such
as road detection (Amini and Karasfi, 2016),(Zhang
et al., 2015),(Munajat et al., 2015),(Hariyono and Jo,
2015) which is very popular in road traffic surveil-
lance systems. Human detection is another popu-
lar use case for texture analysis in image processing.
Kim and park (Kim et al., 2007) proposed an algo-
rithm to recognize human presence with USB Web
camera. Their method detects human movement us-
ing the circle detection and morphological methods.
There are similar studies for human detection such
as (Kahily and Sudheer, 2016) and (Sharma et al.,
2016) where authors used neural network based train-
ing methods for human detection.
In this paper we are focusing on detecting glossy
and shiny textures in outdoor scenarios and this solu-
tion can be used to detect water, oil leakage metal and
glass in natural environments.
3 NON-LAMBERTIAN
MATERIAL DETECTION
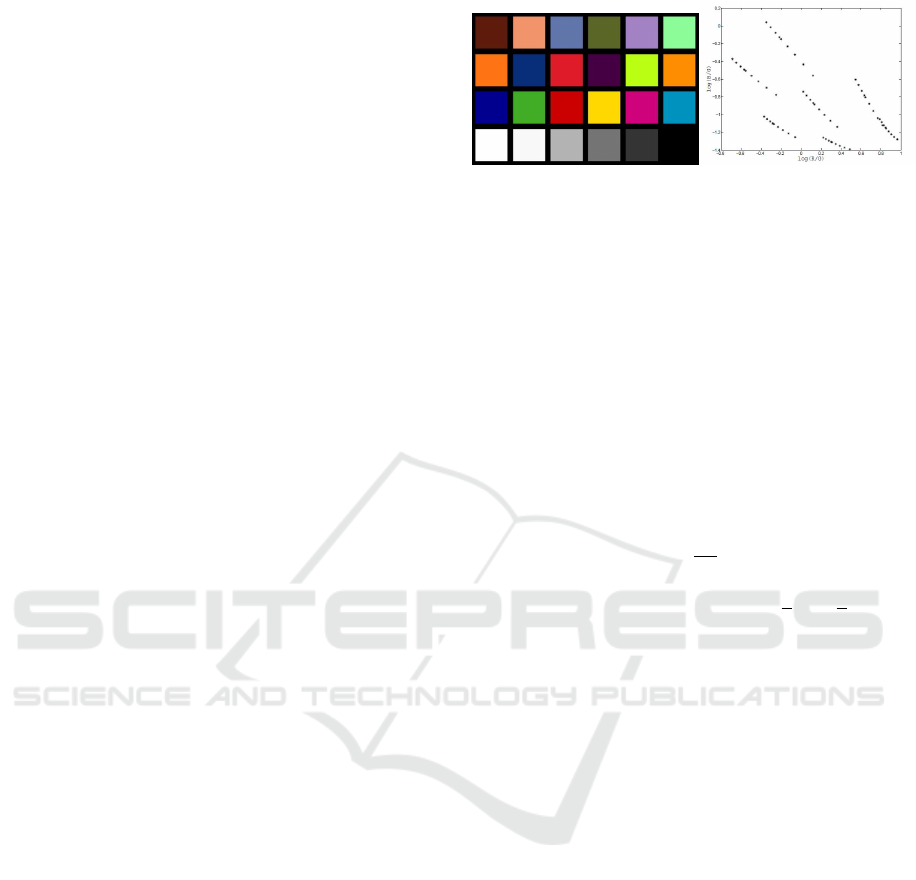
If we image a set of coloured surfaces under Planck-
ian light, in a controlled light box and if surfaces are
Lambertian and not shiny, then for each colour the log
of the chromaticity r,g will be presented as a single dot
(a) (b)
Figure 1: (a) Macbeth colour chart (b) Plot of each colour
on Log(B/G) and Log(R/G).
in a 2-d plot As displayed in Figure 1.(b)
This is because the RGB colour ρ for each of the
tree channels K where K = (R, G, and B) is given by:
ρ
k
= Ic
1
λ
−5
k
e
−(c
2
/T λ
k
)
S(λ
k
)q
k
(1)
Assuming that lighting can be approximated by
Planks law, constants c
1
and c
2
are equal to 3.74183
× 10
−16
W m
2
and 1.4388 × 10
−2
mK. The variable
I controls the intensity and S(λ
k
) is surface spectral
reflectance function. Now to form band-ratio chro-
maticitys from colour values ρ,
r
k
=
ρ
k
ρ
G
(2)
We divide this by green and calculate
R
G
and
B
G
to re-
move the intensity information and by doing this, the
intensity information I will be removed. In addition
to remove the temperature term, the log of equation
4.2 will be taken to form:
r
0
k
= log(r
k
)log(s
k
/s
N
) + (e
k
− e
N
)/T (3)
In this equation, s
k
= c
1
λ
−
k
5S(λ
k
)q
k
and e
k
= −c
2
/λ
k
and when temperature changes, the 2 vectors r and
k will form a straight line. In this paper, we have
called this Logarithm of Chromaticity Ratio line or
LCR line.
Since this behavior is only produced from materi-
als which fit into Lambertian model, we can use it to
distinguish between Lambertian and non-Lambertian
surfaces.
3.1 Detecting Shiny Texture using LCR
Line
The graph that was displayed in Figure 1.(b) was pro-
duced from a Macbeth colour chart in a controlled
laboratory environment under a single light source.
In real-life outdoor scenarios, the Illumination Re-
flectance Line is not as perfect as displayed in Fig-
ure 1 (b). The reason for this mismatch is although
the illumination from sun to dominant, there are other
sources of light such as reflectance from other nearby
Detecting Non-lambertian Materials in Video
255
objects as well as sudden changes to the illumination
due to clouds or other moving objects.
By adopting a Lambertian model of image forma-
tion so that if light source with a spectral power dis-
tribution (SPD) denoted E(λ, x , y) is incident on a
surface which surface reflectance function is denoted
S(λ, x , y) then the response of the camera sensors can
be formulated as:
ρ
k
(x,y) = σ(x, y)
Z
E(λ,x,y)S(λ,x,y)Q
k
(λ)dλ (4)
where Q
k
(λ) is the spectral sensitivity of the k cam-
era sensor, k = 1, 2, 3, and σ(x,y) is a constant fac-
tor which represents the Lambertian shading term at a
given pixel. In previous section, it was explained that
assuming the surface has Lambertian characteristics,
plotting Log (R/G) and Log (B/G) would form a line
which will be orthogonal to lighting source.
Here we present a novel idea to discover non-
Lambertian materials such as glass, water, metal or
any shiny material in the video under natural lighting
condition. The approach that has been taken here is
producing a plot from Log (R/G) and Log (B/G) of
different regions and various pixels in the video to see
if they fit in the Lambertian model and then check if
they produce a line.
Now we change the approach and claim that the
objects that their chromaticity don’t fit into the lin-
ear model of gs = c
1
R
0
(R) − c
2
R
0
(B) should not be
matt. Therefore projecting R
0
(R) = log(R/G) and
R
0
(B) = Log(B/G) would be able to display if the sur-
face chromaticity is fitting into Lambertian model or
not. This is explained in the following example:
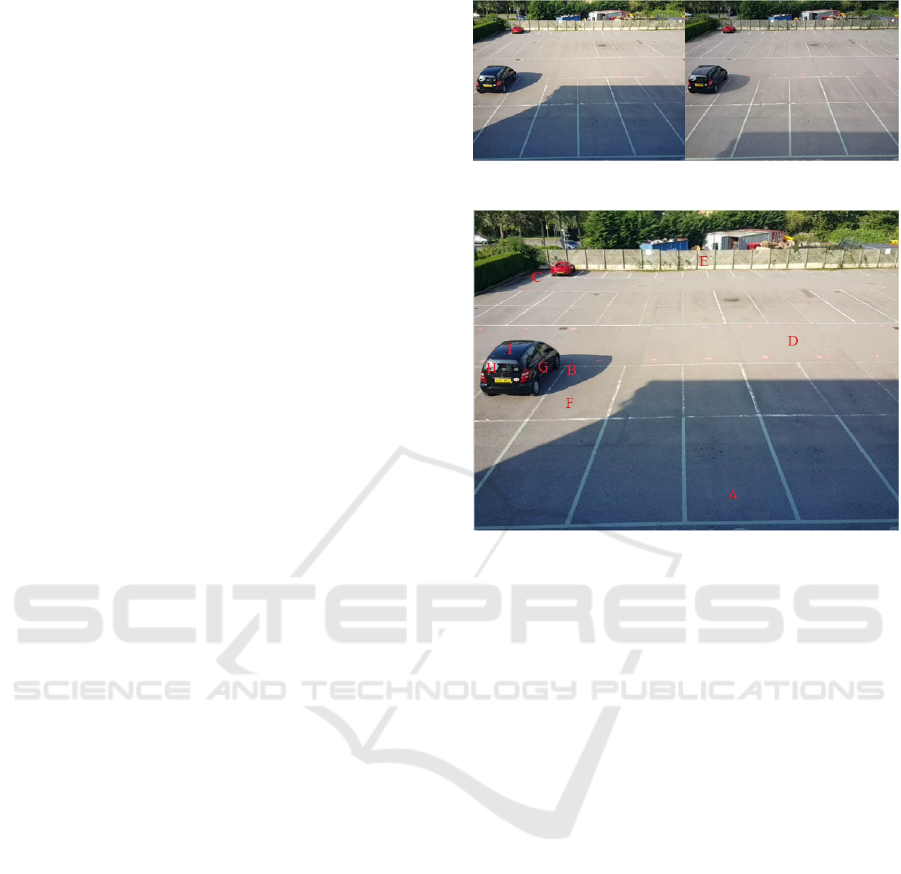
In this experiment 9 pixels were analysed and
the trjecotry of their Log(R/G) and Log(B/G) were
compared. The 9 samples are from these 3 categories
: 1) Shadow area 2) non-shadow 3) sample from
black car. These samples are marked from A-I in
Figure 5.1 (c). The duration of this video is 1 hour
and the plot of Log (B/G) and Log (R/G) of these 9
pixels over one hour is displayed in figure 5.2
The important observation here is the pixels
which belong to Lambertian surface model i.e. matt
materials show linear trajectory overtime. This is true
regardless of the sampling position weather the pixel
belongs to shadow or nonshaow region. However
the pixel which belong to non-Lambertian surface
model i.e. shiny materials such as water, glass or
metal do not fit into this model and their chromaticity
doesn’t show linear pattern when illumination source
changes.
This behaviour can be seen in Figure 3. The first
two rows show the chromaticity of matt objects in
(a) (b)
(c)
Figure 2: (a) First frame of the video (b) last frame of the
video (c) 9 different pixels from three categories are se-
lected for analysis. A, B, C are in shadow, D, E, F from
none shadow, G, H , I are from the shiny parts of the car.
both shadow and nonshadowed part of the image and
the 3rd shows the same analysis for shiny objects.
In this experiment the matt regions show linear
chromaticity over time whilst the shiny materials
don’t. This important characterised can be used to
discover and distinguish shiny and matt textures in
the video.
Another example is shown in Figure 4 where
pixels from matt surfaces show linear chromaticity
over time (both shadow and nonshadowed regions).
But on the other hand, pixels from glass windows and
doors where don’t fit into non-Lambertian model do
no show any linear trajectory over time.
Hence by plotting R
0
(R) = log(R/G) and
R
0
(B) = Log(B/G) we can successfully distinguish
matt and shiny textures over time because matt
materials show linear pattern whilst shiny materials
don’t fit into any linear model.
Another interesting observation is seeing the dif-
ference between Figure 3,4 and 1.(b). The trajectories
illustrated in Figures 3 and 4 are from real life sce-
narios where the illumination changes are not as con-
VISAPP 2017 - International Conference on Computer Vision Theory and Applications
256

(a) (b) (c)
(d) (e) (f)
(g) (h) (i)
Figure 3: First row figures shows the trajectory of pixels (a)
, (b) and (c) in Figure 5.1 over 1 hour of video which belong
to shadow region. Second row displays the pattern of pixels
(d), (e) and (f) which are from nonshadowed region of the
image. 3rd row shows the trajectory of pixels (g), (h) and
(I) which are from shiny metal and glass.
(a) (b)
Figure 4: The 1st and last frame of the video taken outside
Brunel university library.
trolled and regulated as lab lighting conditions which
can be seen in Figure 1.(b). In natural outdoor condi-
tions, the presence of additional sources of light and
reflectance as well moving objects and clouds creates
illumination noises hence the trajectory of matt tex-
ture will never be a perfect line similar to Figure 1.(b)
and mostly it will be some scattered dots around the
LCR line.
3.2 Logarithm of Chromaticity
In previous section we explained that plotting Log
(R/G) and Log (B/G) of Lambertian material would
form a line which called it LCR and it will be orthog-
onal to lighting source. We also explained that mate-
rials and textures that don’t fit into the linear model
of gs = c
1
R
0
(R) − c
2
R
0
(B) are not matt and therefore
projecting R
0
(R) = log(R/G) and R
0
(B) = Log(B/G)
(a) (b) (c)
(d) (e) (f)
(g) (h) (i)
Figure 5: The 1st row figures shows the trajectory of pix-
els taken in shadow region. 2nd row displays the pattern
of pixels from nonshadowed region of the image. The last
row images show the pattern of the trajectory of pixels from
glass doors and windows.
would be able to display if the surface chromaticity is
fitting into Lambertian model or not. Reflectance and
glares are one of the examples that don’t fit into the
following model:
ρ
k
(x,y) = σ(x, y) =
Z
E(λ,x,y)S(λ,x,y)Q
k
(λ)dλ
(5)
This methodology is illustrated in figure 6. In this
example both the white paper and the mirror have sat-
urated all tree channels and the value of their RGB is
close to 255 however during the 15 minutes of record-
ing, their logarithm of chromaticity shows a different
trajectory and this can be used to distinguish the white
paper (matt surface) from the mirror (shiny surface).
To deploy this automatically we try to form a line
from log(R/G) and Log(B/G) values using a smooth-
ing filter from trajectory of both matt and shiny sur-
faces.
In Figure 7. The distribution of chromaticity val-
ues near the line of best fit is displayed for the mirror
and white paper.
3.3 Using Line of Best Fit to Detect
Glossy Materials
To distinguish white matt objects from reflectance we
draw a line from scattered data and calculate the nor-
mal distribution of the logarithm of chromaticity of
Detecting Non-lambertian Materials in Video
257

(a)
(b) (c)
Figure 6: (a) The RGB value of both objects are close to 255
and both surfaces are white (b) logarithm of chromaticity of
mirror over a period of time (C)logarithm of chromaticity
of white paper which forms a line. In this example the σ of
white paper is 89.15 but it is 221.89 for the mirror.
(a) (b)
Figure 7: (a) The ratio of change of logarithm of chromatic-
ity of a shiny surface (b) at The ratio of change of logarithm
of chromaticity of a matt material.
both surfaces. The σ of shiny surface is significantly
higher than matt material. There are many materials
and research in the field of statistic about interpolating
scattered data. For the simplicity we used the Vander-
monde matrix, V, whose elements are powers of x.
v
i, j
= x
n− j
i
We used Matlab to find the coefficients of a poly-
nomial p(x) of degree n that fits the data, p(x(i)) to
y(i),in a least squares sense. The result p is a row
vector of length n + 1 containing the polynomial co-
efficients in descending powers:
p(x) = p
1
x
n
+ p
2
x
n−1
+ ... + p
n
x + p
n+1
(6)
To fit a straight line, then n = 1, and the equation
would be:
p(x) = p
1
x + p
2
(7)
By using Vandermonde matrix based function of
polyfit in Matlab, we can produce p
1
and p
2
and when
the line of best fit is identified, we calculate the dis-
tribution of logarithm of chromaticity and use σ to
differentiate between matt and glossy objects. This is
explained in the following algorithm.
Algorithm 1: How to differentiate between white materials
and reflectance.
1: Plot the gradient of R
0
(R) = log(R/G) and
R
0
(B) = Log(B/G) from saturated regions using
the available frames.
2: Produce the line of best fit .
3: Produce the normal distribution of all the loga-
rithms of chromaticity.
4: The σ of the distribution of the shiny material will
be higher than matt surface and this indication
can be used to distinguish these two object ma-
terial.
An important advantage of this method is it is
completely independent of colours and the RGB val-
ues will not impact the distribution of chromaticity.
The only material characteristic which will have im-
pact on the distribution is glossiness of texture. There-
fore this algorithm can be used to successfully detect
all different types of shiny surfaces.
4 CONCLUSION AND FURTHER
WORK
In this paper we have provided a novel solution to au-
tomatically detect non-lambertian materials in video.
Our method works by analysing the logarithm of
chromaticity of pixels over time and checking their
distribution around a straight line which is orthogonal
to lighting direction.
We showed regardless of the colour of the mate-
rials, the matt and glossy textures show different be-
haviors when the logarithm of their chromaticity is
analyzed for a period of time and this can be used
to automatically detect objects such a water, glass or
shiny metal. This solution can have many applica-
tions in video and image processing systems such as
water detection, oil leakage detection and many more.
Unlike some of the existing methods, training data or
manual or semi supervised user input is not required.
One way to continue this work would be to use the
colour information and other features of textures to
identify various types of glossy objects. Water, glass
and metal have different characteristics which can be
used to differentiate one from the other.
VISAPP 2017 - International Conference on Computer Vision Theory and Applications
258

REFERENCES
Amini, H. and Karasfi, B. (2016). New approach to road
detection in challenging outdoor environment for au-
tonomous vehicle. In 2016 Artificial Intelligence and
Robotics (IRANOPEN), pages 7–11.
Arora, C. and Werman, M. (2014). Optical flow for non
lambertian surfaces by cancelling illuminant chro-
maticity. In 2014 IEEE International Conference on
Image Processing (ICIP), pages 1977–1981.
Basri, R. and Jacobs, D. W. (2003). Lambertian reflectance
and linear subspaces. IEEE Transactions on Pattern
Analysis and Machine Intelligence, 25(2):218–233.
Ged, G., Obein, G., Silvestri, Z., Rohellec, J., and Vinot, F.
(2010). Recognizing real materials from their glossy
appearance. Journal of Vision, 10(18):451–465.
Hariyono, J. and Jo, K. H. (2015). Detection of pedes-
trian crossing road using action classification model.
In 2015 IEEE International Conference on Advanced
Intelligent Mechatronics (AIM), pages 21–24.
Hertzmann, A. and Seitz, S. M. (2005). Example-based
photometric stereo: shape reconstruction with gen-
eral, varying brdfs. IEEE Transactions on Pattern
Analysis and Machine Intelligence, 27(8):1254–1264.
Kahily, H. M. and Sudheer, A. P. (2016). Real-time human
detection and tracking from a mobile armed robot us-
ing rgb-d sensor. In 2016 World Conference on Fu-
turistic Trends in Research and Innovation for Social
Welfare (Startup Conclave), pages 1–6.
Kim, Y. S., Park, J. I., Lee, D. J., and Chun, M. G. (2007).
Real time detection of moving human based on digital
image processing. In SICE, 2007 Annual Conference.
Knoblauch, K. and Viot, F. (2010). Difference scaling of
gloss: Nonlinearity, binocularity, and constancy. Jour-
nal of Vision, 10:189–203.
Li, G., Liu, Y., and Dai, Q. (2011). Multi-view photometric
stereo of non-lambertian surface under general illu-
minations. In 2011 International Conference on 3D
Imaging (IC3D), pages 1–6.
Malik, J. and T.Leung (2001). Representing and recog-
nizing the visual appearance of materials using three-
dimensional textons. International JOurnal of Com-
puter Vision, pages 29–43.
Maloney, L. and Yang, J. (2003). Maximum likelihood dif-
ference scaling. Journal of Vision, 6:573–568.
Munajat, M. D. E., Widyantoro, D. H., and Munir, R.
(2015). Road detection system based on rgb histogram
filterization and boundary classifier. In 2015 Inter-
national Conference on Advanced Computer Science
and Information Systems (ICACSIS), pages 195–200.
Prinet, V., Lischinski, D., and Werman, M. (2014). Illumi-
nant chromaticity from image sequences. The IEEE
International Conference on Computer Vision (ICCV),
3:311–319.
Schechner, Y. Y., Nayar, S. K., and Belhumeur, P. N. (2007).
Multiplexing for optimal lighting. IEEE Transac-
tions on Pattern Analysis and Machine Intelligence,
29(8):1339–1354.
Sharma, A., Singh, A., and Rohilla, R. (2016). Color based
human detection and tracking algorithm using a non-
gaussian adaptive particle filter. In 2016 3rd Interna-
tional Conference on Recent Advances in Information
Technology (RAIT), pages 439–442.
Yang, Q., Wang, S., Ahuja, N., and Yang, R. (2011).
A uniform framework for estimating illumination
chromaticity, correspondence, and specular reflection.
IEEE Transactions on Image Processing, 20(1):53–
63.
Yoon, K. and Kweon, I. (2006). Correspondence search in
the presence of specular highlights using specular-free
two-band images. Computer Vision ACCV, 7:761–
770.
Zhang, Y., Meng, H., Hu, C., Liu, Y., and Du, Z. (2015).
Road and vehicle detection in highway scene for auto-
motive fmcw antenna array radar. In IET International
Radar Conference 2015, pages 1–5.
Detecting Non-lambertian Materials in Video
259
