
Truth Assessment of Objective Facts Extracted from Tweets:
A Case Study on World Cup 2014 Game Facts
Bas Janssen
1
, Mena Habib
2
and Maurice van Keulen
1
1
Faculty of EEMCS, University of Twente, PO Box 217, 7500AE, Enschede, The Netherlands
2
Department of Data Science & Knowledge Engineering, Maastricht University, P.O. Box 616, Maastricht, The Netherlands
Keywords:
Twitter, Fact Extraction, Truth Assessment.
Abstract:
By understanding the tremendous opportunities to work with social media data and the acknowledgment of
the negative effects social media messages can have, a way of assessing truth in claims on social media would
not only be interesting but also very valuable. By making use of this ability, applications using social media
data could be supported, or a selection tool in research regarding the spread of false rumors or ’fake news’
could be build. In this paper, we show that we can determine truth by using a statistical classifier supported by
an architecture of three preprocessing phases. We base our research on a dataset of Twitter messages about the
FIFA World Cup 2014. We determine the truth of a tweet by using 7 popular fact types (involving events in
the matches in the tournament such as scoring a goal) and we show that we can achieve an F1-score of 0.988
for the first class; the Tweets which contain no false facts and an F1-score of 0.818 on the second class; the
Tweets which contain one or more false facts.
1 INTRODUCTION
Internet users continue to spend more time on social
media websites than any other type of website(Inc.,
2012). Although social media is not always reliable,
people do rely a lot on social media. According to
Reuters (Reuters Institute for the Study of Journal-
ism, 2013), social media appears to be one of the
most important ways people find news online. This
means that social media influences the sources of the
news and therefore the content and interpretation. Be-
cause of these vast number of users and the diversity
of topics people discuss, social media has become a
widespread, diverge platform containing a lot of fac-
tual information which makes it a very valuable plat-
form for a lot of people, for example leading to social
media mining.
Because of the popularity of (research based on)
social media, the question which automatically comes
to mind is: how reliable is social media and should
we trust the information in social media messages? If
we could assess the reliability or truth of social media
messages, this could result in a very interesting pre-
processing step to take for researchers who work with
social media datasets. A possible use would be to use
this tool as a false rumor detector in times of crisis or
presidential elections or use it as a fraud detector.
In this paper, we present an architecture of several
phases (components) leading to a mechanism which
can automatically assess truth in Tweets. We will con-
centrate our efforts on popular football related facts
and we will be using a dataset of Tweets about the
FIFA World Cup 2014.
Prior to truth assessment of a fact, important step
in this process is the step of knowing what is meant in
a Twitter message. A lot of facts are not presented in a
straightforward way; a Tweet’s content is often brief,
contains mistakes, lacks context and is uncurated
1
.
By introducing a fact classifier and the fact extractor,
we automate this process by identifying the types of
facts in the Tweet by using a fact classifier (achieving
a average F1-score over all the fact types of 0.96) and
extracting the facts using a fact extractor (achieving a
average F1-score over all the fact types of 0.85). The
reliability classifier, by making use of the components
presented above, has achieved an F1-score of 0.988
for class A; the Tweets which contained no false facts
and an F1-score of 0.818 on class B; the Tweets which
contained one or more false facts.
The paper is organized as follows: after the intro-
duction, we present related work in section 2. Sec-
tion 3 describes the approach we have taken in the
1
https://gate.ac.uk/wiki/twitie.html
Janssen, B., Habib, M. and Keulen, M.
Truth Assessment of Objective Facts Extracted from Tweets: A Case Study on World Cup 2014 Game Facts.
DOI: 10.5220/0006185101870195
In Proceedings of the 13th International Conference on Web Information Systems and Technologies (WEBIST 2017), pages 187-195
ISBN: 978-989-758-246-2
Copyright © 2017 by SCITEPRESS – Science and Technology Publications, Lda. All rights reserved
187

research. Section 4, 5 and 6 describe the the archi-
tectural components of the system. We end this pa-
per with a discussion and future research section in
section 7 and conclusion in section 8. Due to space
limitations, we will dedicate most of the paper on the
approach and reliability classifier chapter and often
refer to the underlining work: ’Determining truth in
tweets using feature based supervised statistical clas-
sifiers’(Janssen, 2016), referred to as ’thesis’.
2 RELATED WORK
Research has shown that the credibility (believability)
of social media messages is low (Bram Koster, 2014).
Although there has been done a lot of research in
credibility of social media(Castillo et al., 2011; Kang,
2010), research relating to the reliability (quality of
being reliable) of social media is lacking. Although
there is little research on the reliability, the limited re-
search available does show that a lot of people spread
false facts through social media and show a couple
of examples where Twitter has lead to false spread-
ings of misinformation. Unsurprisingly, social media
is not always reliable, given the open uncontrolled na-
ture of social media.
A very interesting research project close to the
work done in this paper is the European funded
Pheme project
2
. The Pheme project is named after
the goddess of fame and rumours. The Pheme project
is a 36 months research project establishing the ve-
racity of claims made on the Internet. Two promi-
nent case studies in the Pheme project cover informa-
tion about healthcare and information used by jour-
nalists. Many papers published within this research
project have a relation to our work. In ”Visualis-
ing the Propagation of News on the Web”(Vakulenko
et al., 2016), Vakulenko et al. describe the prop-
agation of news on the web. This is very interest-
ing for our research because the possible relation be-
tween the way a rumour propagates over the inter-
net and the truth of rumour. A related paper in the
Pheme project is ”Analysing how people orient to and
spread rumours in social media by looking at con-
versational threads”(Zubiaga et al., 2016). A num-
ber of papers published in the Pheme project focus
on detecting and processing events and fact/rumour
recognition and processing. Those include ”Process-
ing and Normalizing Hashtags”(Declerck and Lend-
vai, 2015) and ”GATE-Time: Extraction of Temporal
Expressions and Events”(Derczynski et al., 2016) in
which the authors add a Temporal Expression plug-
2
https://www.pheme.eu/
in for Gate
3
, a popular information extraction toolkit.
Another interesting research is The ‘ClaimFinder’
framework(Cano et al., 2016). In this paper, Lim et
al present a system using existing open information
extraction techniques to find claims in a Tweets, re-
sulting in subject-predicate pairs. Using these claims,
Tweets are grouped according to their agreement on
events, based on the similarity of their claims. In this
way, ClaimFinder is able to group opinions on social
media; an important prepossessing task as we will
show in this paper. The credibility assessment task
is beyond the scope of this work.
To sum up, existing research efforts on this prob-
lem focused either on rumors detection (Hamidian
and Diab, 2016; Zhao et al., 2015) or on information
credibility (Castillo et al., 2011; Gupta et al., 2014).
In both efforts, researchers used shallow features (like
meta data of the post, or its sentiment, or existence of
some words or punctuations) to assess the truth of a
social media post. None of the existing approaches
digs deeper to extract the facts themselves contained
in the social media post and assess their truthfulness
afterwards.
3 APPROACH
In this section, we explain our research approach by
describing our implementation plan. We begin with
explaining the relation of the research with the dataset
and ground truth which is used to construct the foun-
dations.
3.1 Dataset
FIFA World Cup is one of the biggest sport events
in the world, and consequently, many people tweet
about it. After the FIFA World Cup 2014, Twitter Inc.
reported (Twitter, 2015) that Twitter users have sent
about 670 million Tweets about the world cup, mak-
ing it the biggest sport event on Twitter ever. By the
end of the finals of the World Cup, knowing Germany
won the FIFA World Cup 2014, Twitter reported that
users sent a peak volume of 618 thousand Tweets per
minute. Many of those Tweets cover the World Cup in
a detailed and comprehensive way. They cover goals,
substitutes and yellow and red cards; important events
in a match worthy to be mentioned in a summary
about the game. Next to true important and true but
unimportant facts, there are also a lot of Tweets con-
taining false, untrue information regarding the World
Cup. These Tweets may contain misguided informa-
tion, lies or small errors. Many are copied from false
3
https://gate.ac.uk/
WEBIST 2017 - 13th International Conference on Web Information Systems and Technologies
188
sources, contain reversed facts or are not accurately
adopted from true sources.
We collected a database containing 64 million
Tweets about the FIFA World Cup 2014. This
database was filled by collecting all Tweets which
contained one ore more of the following hash-
tags: #worldcup, #worldcup2014, #fifaworldcup,
#brazil2014, #brasil2014 and #fifaworldcup2014.
Note that those 64 million Tweets are original Tweets,
retweets and replies combined.
3.2 Ground Truth
The FIFA World Cup is FIFA’s biggest event and it
is documented thoroughly. Using the Open football
project
4
, we received a prepared list of players, end
score and score development for every match in the
World Cup. Other needed statistics like substitutions,
yellow and red cards and country codes, were ex-
tracted manually from the FIFA website
5
. In our re-
search, we focused on the group stages of the tour-
nament. Altogether, this resulted in 48 group games,
players scoring 136 goals, coaches substituting 279
times, referees giving 124 yellow card and 9 red card
bookings. Altogether, 32 countries played against
each other each team making use of 23 players.
3.3 Facts
The fact classes (fact types) we chose to asses in this
paper must satisfy the following characteristics: they
are verifiable, they are objective, there must enough
Tweets containing that type of fact in our dataset and
there must be a decent amount of training data classi-
fied ’true’ and a decent amount classified ’false’. The
list of fact classes can be found in table 1.
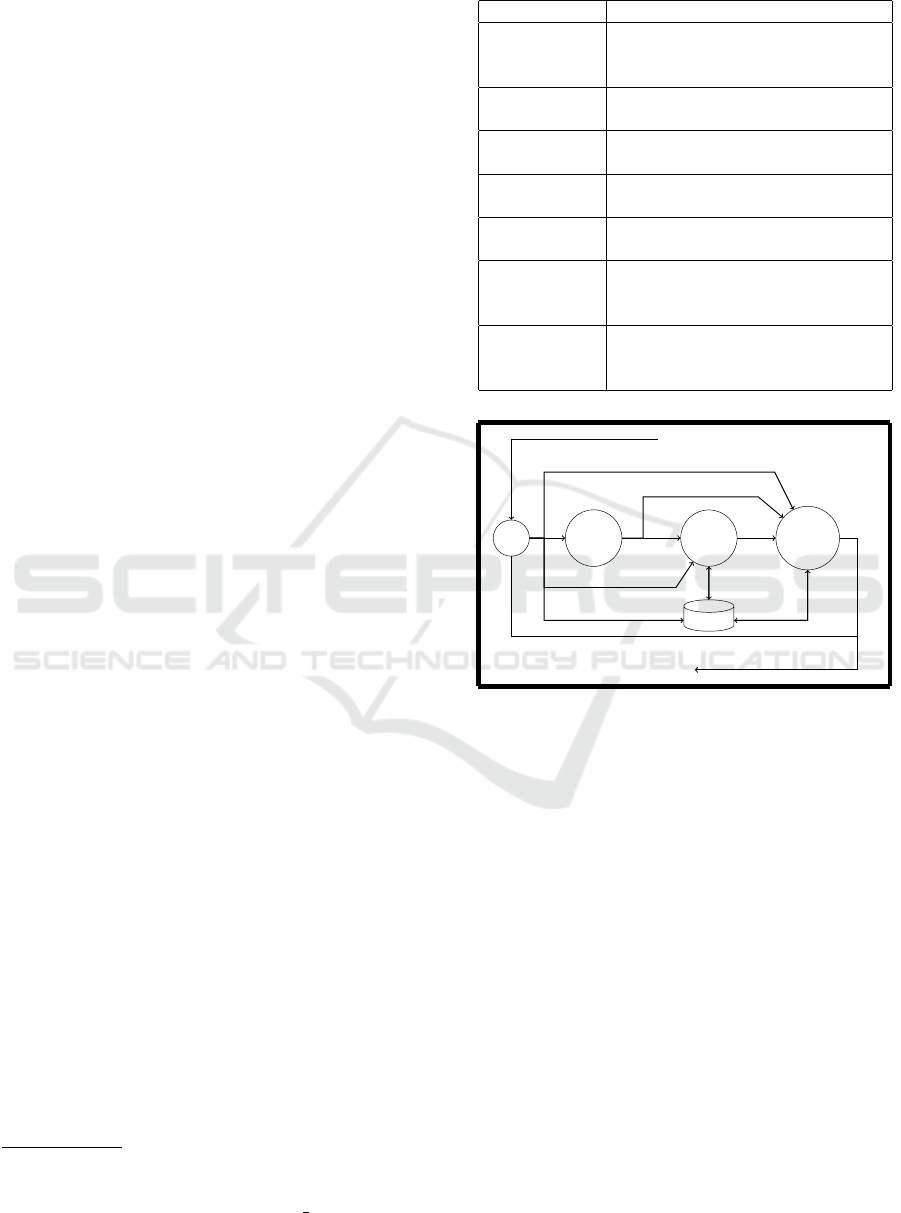
3.4 Architectural Model
To classify a tweet, we designed an architecture made
up of 5 phases (see figure 1). Each phase, except
for the filter phase, is supported by a database, which
saves and communicates critical information to each
part of the system.
Some tweets may harm the performance of the
system. For example tweets which predict future
events or are related to fantasy sport
6
. In the fil-
ter phase, we filter those Tweets out. The input of
the filter is the text of the tweet. The output of the
filter is the classification if the tweet is going to be
4
Open football - http://openfootball.github.io/
5
www.fifa.com
6
https://en.wikipedia.org/wiki/Fantasy sport
Table 1: List of the used fact classes.
Fact class Fact explanation
Red card
count (CRC)
The fact stating the count of red
cards in the whole tournament in
combination with the receiver.
Score final
time (FT)
The fact stating the final time score
of a match.
Score half
time (HT)
The fact stating the half time score
of a match.
Score other
time (OT)
The fact stating the score at a ran-
dom time of a match.
Score minute
(MS)
The fact stating in which minute a
goal was scored in a match.
Red card
minute
(MRC)
The fact stating in which minute a
red card was received by a player
on the field.
Yellow
card minute
(MYC)
The fact stating in which minute
a yellow card was received by a
player on the field.
Tweet
Result
Filter
Fact
classifier
Fact
extractor
Reliability
Classifier
Database
Figure 1: Overview of the system architecture.
used or filtered out. More information about the fil-
ter can be found in the thesis ’Determining truth in
tweets using feature based supervised statistical clas-
sifiers’(Janssen, 2016).
If the tweet has passed the filter, the tweet is fed
to the fact classifier. The fact classifier consists of
several parts; each fact class introduced in section 3.3
has its own trained fact classifier which determines if
the tweet contains that particular fact or not. Each part
of the system is made up a feature based supervised
learning classifier. The input of the classifier is the
text of the tweet. The output of the classifier is a list
of (zero or more) non-duplicate fact classes.
If any fact has been determined by the fact clas-
sifier, the tweet is fed to the fact extractor. The fact
extractor tries to extract one or more instances of each
fact type found, by making use of a numerous amount
of techniques, e.g. rule based classifiers and natural
language processing techniques. The input of the fact
extractor is the text and the meta-information of the
Truth Assessment of Objective Facts Extracted from Tweets: A Case Study on World Cup 2014 Game Facts
189

tweet, the ground truth and the output of the fact clas-
sifier. The output of the classifier is a list of (zero or
more) facts.
When the facts are extracted, all of the results of
previous steps are fed to the reliability classifier. In
this part of the system, the tweet is classified to con-
tain any ‘false facts’ or to contain only ‘true facts’.
The classifier is based on a feature based supervised
learning classifier which is further explained in sec-
tion 6. The input of the reliability classifier is the
text and meta-information of the tweet, the output fact
classes of the fact classifier and the extracted facts
from the fact extractor. The reliability classifier is also
able communicate with the database to save and load
attributes and facts from other Tweets. The output of
the reliability classifier is false if one of the extracted
facts is false or true if all extracted facts are true.
4 FACT CLASSIFIER
The central purpose of this part of the system is to de-
termine which kinds of facts (fact classes) are present
in a given tweet, which result we will use to achieve
three goals. The first goal is the creation of attributes
(features) which other parts of the system depend on.
The output of this classifier is directly used by the fact
extraction and the reliability classifier. For example,
the fact extractor makes use of the output of this clas-
sifier to know which fact classes it has to extract from
the tweet. The second goal is to be able to evaluate the
final system more precisely. For example, we are able
to draw conclusions regarding certain fact classes or
fact comparison types or fact scopes, instead of all
fact classes combined. The third goal is automation.
Our goal is to design a completely automatic system
which can, given a tweet as input, determine automat-
ically if the facts within the Tweets are correct or not,
resulting in a system which can operate and be trained
automatically.
We have chosen to use a feature based classifier,
which in our opinion will fit the needs of this problem
perfectly. We have decided to implement the classi-
fier by making use of supervised learning. To do so,
we have designed features, consisting of regular ex-
pressions leading into boolean features. An important
remark is that a match of an expression is as important
as the absence of match.
To train and evaluate the fact classifier, we have
manually labelled a total of 1883 unique Tweets. For
each fact class, we have randomly taken a few hun-
dred of Tweets (if possible) and manually labelled
the fact classes which were presented in the Tweets.
This resulted in 2341 fact classes being present in
1883 Tweets. For each fact class, a separate classi-
fier is trained and evaluated. By making use of the
Weka suite, we have experimented with several clas-
sifier algorithms and achieved the best performance
with the J48 classifier (Java-based implementation
of the C4.5 algorithm). By making use of 10-fold
cross-validation, we have accomplished the results
presented in table 2.
Table 2: List of performance results of the fact classifier.
Fact
class
Confusion ma-
trix
Precision Recall F-
measure
CRC
264 3
1 1614
0.996 0.989 0.992
FT
457 36
4 1385
0.991 0.927 0.960
HT
356 0
3 1523
0.992 1 0.995
OT
511 20
35 1316
0.936 0.962 0.949
MS
356 33
8 1485
0.978 0.915 0.945
MRC
66 2
1 1813
0.985 0.971 0.978
MYC
202 1
3 1676
0.985 0.995 0.990
5 FACT EXTRACTOR
The central purpose of this part of the system is to
determine the location of a fact and extract it. The
goal of this part of the system is automation. By
making use of the output of this part of the system, we
are able to build a training set which can be used to
train the classifier models of the reliability classifier,
by extracting the facts in tweets automatically and
determine their factual truth by making use of the
ground truth.
Due to space limitations we will only touch the
bare outskirts of the implementation of the fact extrac-
tor. More information about the implementation can
be found in the thesis (Janssen, 2016). The extrac-
tion of facts works in three stages. The fact extractor
receives a list of fact classes from the fact classifier.
For each fact class found in the tweet, the fact extrac-
tor internally calls an extraction mechanism dedicated
for that specific fact class (fact class extractor). At the
end, all the facts are combined in a list and passed on
to the reliability classifier and saved in the database.
Each fact, and therefore each fact class, has a fixed
number of information attributes. For example, a ’fi-
nal score’ fact always has a Match component and a
Score component. The Match component in a ’final
score’ fact is a unique link to a specific happening
WEBIST 2017 - 13th International Conference on Web Information Systems and Technologies
190

(namely the fact that a match has been played) and
the score is an attribute about the happening (namely
the fact that the match ended in 3-2 for example). Be-
cause of this fixed combination of information com-
ponents in each fact class, we are able to perform sev-
eral operations: we are able to identify happenings
(for example a match), we are able to compare facts
(for example a score) and we are able to verify facts
(with the ground truth).
We use a combination of extraction strategies,
such as algorithms which react differently on the pres-
ence and positions of certain information components
in a tweet and where to use fact specific extraction
functions, such as natural processing techniques to
parse, split and POS-tag sentences which all serve as
preprocessing tasks to make it possible for the fact
specific strategies to extract facts. We are able to ex-
tract the facts efficiently, the results can be viewed in
table 3.
To evaluate the fact extractor, we have manually an-
notated 578 facts in 412 Tweets. In total, the fact ex-
tractor extracted 461 facts of which 442 are correct.
More performance details can be found in table 3.
6 RELIABILITY CLASSIFIER
The main purpose of this component is to determine
truth in Tweets. There are different ways of imple-
menting the reliability classifier. One possible option
would be to let the classifier determine if a tweet con-
tains any untruths. In such implementation, the clas-
sifier aims to classify the tweet as false if one of the
facts is false and classify the tweet as true if all the
facts are true. This option is chosen in our imple-
mentation of the reliability classifier, presented in this
paper. Note that we only classify original Tweets in
the reliability classifier. We use replies and retweets
to build features, but we do not determine the truth of
those Tweets.
6.1 Implementation
The reliability classifier has five sources to establish
the features on: the tweet (the text of the tweet), the
corresponding meta-information, the fact classes ex-
tracted by the fact classifier in section 4, the facts
extracted by the fact extractor in section 5 and the
database, which stores the information of every step
in the process and enables the reliability classifier to
combine the data.
The three data types we use for the features are
Integer, boolean and category. The only type that
needs explanation is category which values are inte-
gers but they do not possess relationship which each
other such that 4 ’is bigger than’ 3; they only refer-
ence to a category which can be the same or not the
same. Note that not every feature is available for each
Tweet; for example ‘country sent’ is not always avail-
able because Twitter users are not obligated to declare
their location in their Tweets or user profile.
The hypothesis of the strategy is the following.
There is a relation between the popularity of a fact and
the truth of a fact. True facts are claimed more often
than false facts. True facts have a bigger reach, mea-
sured by the amount of users following the user post-
ing the tweet and the follower count of users retweet-
ing the original tweet. Twitter users with a bigger
reach are inclined to pay more attention to their mes-
sages and make less mistakes. Our reasoning behind
that thought is that those Tweets are more important
because those popular Twitter accounts are often from
professionals, official institutions such as the FIFA or
UEFA, or from famous sites which report news. If
people make mistakes or spread disinformation, peo-
ple will react to those facts. The chance of people
reacting to facts is a lot higher when the number of
followers is higher. Therefore, it is very important
to transition the attributes from one tweet to other
Tweets by using the knowledge that they contain the
same fact. This part of the hypothesis, the reply to
Tweets, can serve as a counter-balance to the first part
of the hypothesis which claims that true facts are pop-
ular. If a false facts gains popularity, for example
because a popular Twitter user claimed the fact, the
replies to that claim will counter the popularity. An
important part of this hypothesis is to check what pop-
ularity means, some facts for example will automat-
ically be more popular than other types of facts and
therefore need another popularity ‘score’ to be true or
false. This is the same with the number of replies.
One of the pillars of the strategy is finding the
reach of a tweet and the facts in a tweet. We explain
the following related features:
• Feature 42, ‘Count Tweets least popular facts’.
This feature counts the number of times the facts
in the Tweet appear in other Tweets. The feature
returns the number of times the least popular fact
appears in other Tweets.
• Feature 55 ‘Audience least popular fact’. This
feature counts the number of times Twitter users
could see this fact by calculating the reach of a
fact. If a Tweet contains a fact, its reach is cal-
culated by the number of followers of the author
of the tweet plus the number of followers of all
the Twitter users which have retweeted the origi-
nal tweet.
Truth Assessment of Objective Facts Extracted from Tweets: A Case Study on World Cup 2014 Game Facts
191

Table 3: List of results from the fact extractor.
Fact class # tweets # tweets # retrieved # correct Precision Recall F-measure
CRC 30 30 22 22 1 0.72 0.84
FT 134 142 122 118 0.97 0.83 0.89
HT 98 102 89 86 0.97 0.84 0.90
OT 102 104 71 66 0.93 0.63 0.75
MS 96 121 98 94 0.96 0.78 0.86
MRC 26 26 25 25 1 0.96 0.98
MYC 51 53 34 31 0.91 0.58 0.71
Total 412 578 461 442 0.96 0.76 0.85
• Feature 56, ‘Count Tweets least popular fact cat-
egory x’, is a collection of features with the same
name. The last number, denoted in the feature
name identifier with an x, is referring to the fact
class. Every fact class we have implemented in
the system has a corresponding feature which only
target the facts which belong to that class. Ev-
ery feature, like feature 42, counts the number of
Tweets that contain the fact, and return the num-
ber of times the least popular fact in that fact class
appears in the dataset.
Another pillar of the strategy is finding a reaction
and finding the number of reactions on a tweet or fact,
which we target in the following features:
• Feature 47 ‘Has reply regarding facts’ and feature
48 ‘Count replies regarding facts’. With these two
features, we try to find a way to link comments on
a Tweet to a fact, by checking if a fact contains a
fact comparison entity which is the same as the
facts in the Tweet. For example if the original
Tweet contains a Score final time, the fact com-
parison entity is a score entity.
• Feature 49, ‘Has reply facts tweet dataset’ and
feature 50 ‘Count replies facts tweet dataset’.
With these two features, we build upon the idea of
feature 47 and 48, but increase the search scope to
the whole dataset. We implement this feature by
using each reply to each tweet containing a fact
which is part of the original tweet.
• Feature 60 ‘Highest individual count replies facts
one fact group tweet dataset’. This feature is im-
plemented in the same way as feature 59 is, but
only returns the number of replies on one fact
in the tweet, namely the fact which has the most
replies.
A full list of features, including their calcula-
tions can be found in the thesis ’Determining truth in
tweets using feature based supervised statistical clas-
sifiers’(Janssen, 2016).
6.2 Evaluation
Because of the evaluation of the other components of
the system, we already have a test set which we can
use for evaluating the reliability classifier. Although
we have a test set, this set is not big enough to per-
form a proper evaluation on the reliability classifier.
Most of the features which are part of the strategy we
have set out for the reliability classifier are based on
facts in a lot of tweets in the dataset. To evaluate these
features, we would need to extract a lot more facts by
hand, which is not feasible. To test the reliability clas-
sifier, we make use of the results we have achieved
with the fact classifier and fact extractor, and there-
fore build a test set automatically. By making use of
the dataset in table 1, we have created a dataset con-
taining 17194 Tweets which contain 21367 facts. We
have also collected every retweet and reply on these
original Tweets. By making use of the ground truth,
we can now determine the truth of each fact and clas-
sify which Tweets contain untruths and which Tweets
contain only true facts.
Similar to the previous evaluations, we have tried
out several classifiers to maximize the performance
of the features. Again the J48 classifier performed
the best on our dataset. By using a combination of
wrapper based Correlation Feature Selection and the
J48 classifier, we have received an F1-score of 0.988
for class A; the Tweets which contain no false facts
and an F1-score of 0.818 on class B; the Tweets which
contain one or more false facts. The best subset of
Table 4: Performance results of the reliability classifier.
Class Precision Recall F-measure
A: Tweets with 0 false facts 0.983 0.993 0.988
B: tweet with >1 false
facts
0.923 0.818 0.867
Table 5: Reliability classifier’s confusion matrix.
Class Classified A Classified B
A: Tweets with 0 false facts 15590 102
B: tweet with >1 false facts 274 1228
WEBIST 2017 - 13th International Conference on Web Information Systems and Technologies
192

features which combine to the best performance can
be found in table 6.
Table 6: Set of features which resulted in the best perfor-
mance by the reliability classifier.
Feature
identifier
Feature name
42 Count Tweets least popular fact
44 Count minutes
45 Count scores
50 Count replies facts tweet dataset
55 Audience least popular fact
56-8 Count Tweets least popular fact category 8
57-8 Audience least popular fact category 8
The power of our feature design is the way of con-
necting Tweets by making use of the facts and com-
bining the information acquired from other Tweets in
the dataset and apply it as attributes for every tweet.
This strategy has worked well. This is shown in the
best performing features in table 6(no order implied).
One of the regrettable observations we can make is
that the features we have hoped for, feature 59 and
60, are not part of the resulting feature set. Never-
theless, these features do score high on feature selec-
tion methods (see information gain and chi-squared
statistic below) with a 4th and 5th place on both mea-
sures. One of the possible reasons of the absence
of the features in the final set is that the implemen-
tation of the features is not refined enough. One of
the surprising and interesting features in the set is the
‘count minutes’ and ‘count scores’. Both features do
not score high individually but are performing very
well in combination with other features. A possible
reason for that is that scores and minutes are really
good indicators for which fact classes are present in
a tweet and by making use of that, the classifier can
make a link between the count of the facts and the
reach of the facts, just like we tried to with feature 56
and 57. We think that a decision tree model, the con-
cluding model we use as reliability classifier, is very
applicable in this situation. An interesting discussion
is how we should interpret the two F1-scores of the
two result classes. There are several valid options,
but the most important condition is that the choice
has to be applicable for the goal of the application.
For example, if one would use the classifier to search
for false facts in a dataset, the F1-score of class B is
more interesting. On the contrary, for an application
which would filter out false facts in order to obtain
true facts, the F1-score would be leading. Every ap-
plication can in this way assign its own weight to the
F1-scores which would fit the use case of the applica-
tion. There are several ways to rank the performance
of each feature. Popular ways to rank features are fil-
ter methods; the information gain and the chi-squared
statistic
7
. Both methods determine the performance
of a single feature in respect to the class. The result-
ing list, the features sorted on the score of both meth-
ods, is used to plot the graph in figure 2 which shows
the F1 score of the classification using n number of
features starting from the best feature. As is shown
in the graph, the information gain selection method
and the chi-squared method are unable to detect the
best combination of features. As shown in table 6, 7
features resulted in the best F1-score and this perfor-
mance is only reached after +-20 features in the graph.
The rationale is quite obvious because although each
individual feature does not have to result in a good
performance, a combination of features could. The
graph is only used to give the reader an indication
about the performance development of the classifier
throughout the addition of features, and is not used in
the evaluation of the performance of the classifier.
20 40
60
0.6
0.8
1
Number of features
F1 score
F1 score Class A using the information gain
F1 score Class B using the information gain
F1 score Class A using chi-squared statistic
F1 score Class B using chi-squared statistic
Figure 2: The performance of the classifier using a the infor-
mation gain filter feature selection method. On the x-axis,
the number of features available for the classifier is shown,
where the features are sorted and added to the feature set
based on the feature score of the feature selection method.
7 DISCUSSION & FUTURE
RESEARCH
7.1 System Module Performance
The performance of the reliability classifier is based
on the other system’s modules like the fact classifier
and fact extractor. Improving the precision and recall
7
http://weka.sourceforge.net/doc.dev/weka/
attributeSelection/ASEvaluation.html
Truth Assessment of Objective Facts Extracted from Tweets: A Case Study on World Cup 2014 Game Facts
193

of those systems will improve the reliability classifier.
Various suggested improvements are listed in the cor-
responding module sections and discussion chapter in
the thesis.
7.2 Performance on Other Datasets
In this paper, we have shown that we achieved a
good performance on the dataset and fact classes we
have introduced in this paper. A very interesting, and
maybe the most important question after this conclu-
sion is how these features and performance would re-
late to other datasets and other types of facts. Our hy-
pothesis states that our features work well on datasets
similar to the dataset. Our features aim for datasets
in which facts are repeated and originate from dif-
ferent (independent) sources. In this way, the false
facts are countered by a lot of independent other ‘cor-
rect’ sources. Because there are many sources our
facts can originate from, and the facts can be veri-
fied by many sources, the false facts can be countered
by replies. Criticizing falsities can be universal, but
we think there is a lot of difference when people re-
act to fact and when they do not. For example, in this
dataset we have seen that reactions on false scores are
a lot more common than reactions on incorrect min-
utes. A reason for that could be that people see these
errors to be too insignificant to react on, or that they
are unaware of the falsity because they do not know
the exact truth. Another important observation is that
people are more likely to react to authoritative and
popular Twitter users. A lot of unknown users could
spread false facts without getting a reaction from their
small group of followers. In contrast to the popular
and authoritative users which, in the eyes of their fol-
lower base, should be right. If they are incorrect, they
have a lot of users which potentially could react to an
error.
7.3 Performance in a Real-time
Situation
A very interesting scenario is how this prototype, if
minimally altered, would perform in a live situation.
In the thesis(Janssen, 2016), we describe this scenario
and (most interestingly) alter the reliability classifier
in such a way it will reevaluate its verdict over time.
More details can be found in the thesis.
8 CONCLUSION
Research on veracity in social media extremely im-
portant. By making use of this research, systems
can be designed which can serve as a tool to fil-
ter out misinformation in times of crisis, or serve as
filter applications for systems who make use of so-
cial media messages as a source of information. Re-
search relating to this is still very scarce, but recent
research done such as ClaimFinder(Cano et al., 2016)
and the Pheme project show the increasing interest in
this field. Due to the realization of impact of fake
news, society has currently pressured social media
websites to address this problem and multiple have
responded, for example Facebook has reported it will
use AI and user reports to counter the problem.(Tech
Crunch, 2016) Although we did not actively look into
the detection of fake news, our recommendation on
an approach would be to keep our architecture (and
some features) and add features related to the work of
Vakulenko et al. (Vakulenko et al., 2016).
In this paper, we have shown a system consist-
ing of four parts which are trained specifically on a
dataset containing Tweets about the World Cup. The
first component of the system is a filter which prevents
tweets from entering the rest of the system by mak-
ing use of a rule based classifier. From the original
64 million tweets, 3 million tweets are filtered. The
second component is the fact classifier, which is able
to recognize which types of facts the tweet contains.
This component is implemented by building a feature
based classifier using a J48 classifier. The third com-
ponent is the fact extractor, which is able to extract the
facts in the tweet. The main components are the en-
tity locators and extractors and the fact class specific
extractors which all use different strategies and tools
to extract their respective facts. The fourth and final
component of the system is the reliability classifier; a
feature based classifier which can determine if a tweet
contains a false fact. The classifier is implemented
by using features which determine the popularity and
reach of the facts in a Tweet as well as the number of
replies on a Tweet. The fact classifier scores an F1-
score of 0.96, the fact extractor an F1-score of 0.85
and the reliability classifier an F1-score on class A,
Tweets with zero false facts, of 0.988 and an F1-score
on class B, Tweets with 1 or more false facts, of 0.867.
As shown in various parts of the thesis, there is much
room for improvement, especially an improved entity
extraction can give the recall of several systems a big
performance increase.
REFERENCES
Bram Koster, M. (2014). Journalisten: social media niet
betrouwbaar, wel belangrijk #sming14.
Cano, A. E., Preotiuc-Pietro, D., Radovanovi
´
c, D., Weller,
WEBIST 2017 - 13th International Conference on Web Information Systems and Technologies
194

K., and Dadzie, A.-S. (2016). # microposts2016: 6th
workshop on making sense of microposts: Big things
come in small packages.
Castillo, C., Mendoza, M., and Poblete, B. (2011). Infor-
mation credibility on twitter.
Declerck, T. and Lendvai, P. (2015). Processing and nor-
malizing hashtags. Proc. of RANLP 2015.
Derczynski, L., Str
¨
otgen, J., Maynard, D., Greenwood,
M. A., and Jung, M. (2016). Gate-time: Extraction
of temporal expressions and events.
Gupta, A., Kumaraguru, P., Castillo, C., and Meier, P.
(2014). Tweetcred: Real-time credibility assessment
of content on twitter.
Hamidian, S. and Diab, M. T. (2016). Rumor identification
and belief investigation on twitter.
Inc., N. H. (2012). State of the media - the social medai
report 2012.
Janssen, B. (2016). Determining truth in tweets using fea-
ture based supervised statistical classifiers. Master’s
thesis, University of Twente.
Kang, M. (2010). Measuring social media credibility: A
study on a measure of blog credibility. Institute for
Public Relations, pages 59–68.
Reuters Institute for the Study of Journalism (2013).
Reuters institute digital news report 2013.
Tech Crunch (2016). Facebook chose to fight fake news
with ai, not just user reports.
Twitter (2015). Insights into the WorldCup conversation on
Twitter.
Vakulenko, S., G
¨
obel, M., Scharl, A., and Nixon, L. (2016).
Visualising the propagation of news on the web.
Zhao, Z., Resnick, P., and Mei, Q. (2015). Enquiring minds:
Early detection of rumors in social media from en-
quiry posts.
Zubiaga, A., Liakata, M., Procter, R., Hoi, G. W. S., and
Tolmie, P. (2016). Analysing how people orient to
and spread rumours in social media by looking at con-
versational threads. PloS one, 11(3):e0150989.
Truth Assessment of Objective Facts Extracted from Tweets: A Case Study on World Cup 2014 Game Facts
195
