
Fault Tolerance Analysis for Dependable Autonomous Agents using
Colored Time Petri Nets
Lan Anh Trinh, Baran C¨ur¨ukl¨u and Mikael Ekstr¨om
School of Innovation, Design and Technology, M¨alardalen University, V¨aster˚as, Sweden
Keywords:
Dependability, Fault Tolerance, Colored Time Petri Nets, Autonomous Agents.
Abstract:
Fault tolerance has become more and more important in the development of autonomous systems with the aim
to help the system to recover its normal activities even when some failures happen. Yet, one of the concerns
is how to analyze the reliability of a fault tolerance mechanism with regards to the collaboration of multiple
agents to complete a complicated task. To do so, an approach of fault tolerance analysis with the colored time
Petri net framework is proposed in this work, where a task can be represented by a tree of different concurrent
and dependent subtasks to assign to agents. Different subtasks and agents are modeled by color tokens in
Petri network. The time values are added to evaluate the processing performance of the whole system with
respect to its ability to solve a task with fault tolerance ability. The colored time Petri nets are then tested
with simulation of centralized and distributed systems. Finally the experiments are performed to show the
feasibility of the proposed approach. From the basics of this study, a generalized framework in the future can
be developed to address the fault tolerance analysis for a set of agents working with a sophisticated plan to
achieve a common target.
1 INTRODUCTION
Until recently, robots have played an important role
mainly in controlled processes such as manufactur-
ing. However, nowadays there is a shift which points
in the direction of having various types of (semi-
)autonomous agents, or robots, in our daily activities.
This paradigm shift also means that these agents will
most likely interact with each other, sometimes for
collaboration, in most case without having human su-
pervision. In short this is a shift to replace a conven-
tional automatic system with its autonomous coun-
terpart. Unlike an automatic robot that usually per-
forms repetitive tasks within a well-controlled envi-
ronment, an autonomous robot must perform its tasks
with a very high level of automation and may col-
laborate with other robots and human to complete in-
tended tasks. In this work, it is assumed that building
a trustworthy system of collaboration raises a num-
ber of challenging questions, that could be addressed
with the definition of dependability. Originally, de-
pendability is devised from software development ar-
eas and can be stated by Aviˇzienis et al. (Aviˇzienis
et al., 2004) as ”the ability to deliver service that can
justifiably be trusted”. To realize this idea, the de-
pendability is measured by attributes such as avail-
ability, reliability, safety, integrity, or maintainability.
In general, the dependability of a system is assessed
by one, several, or all above attributes. Within the
scope of this paper, the dependability is implemented
with the reliability which presents the continuity of a
system to provide correct services. It is noted that the
things affecting dependability consist of failures, er-
rors, and faults. The link between the above factors
is known as the fault-error-failure chain: The failure
happens when the service provided by a system does
not comply with its specification; The error affects the
services and leads to the failure of the system; The hy-
pothesized cause of an error is a fault. However, the
failures are only detected at the system boundary. As
a system contains a number of interconnected parts,
the system boundary is defined to decide which el-
ements are inside and which are outside the system.
In some cases, the faults cause errors inside the sys-
tem boundary and thus the errors may be not observ-
able immediately but lead to a failure later. There-
fore, the fault is the key that leads to a system fail-
ure and the approach to protect the system’s depend-
ability is to develop means of fault analysis and of
fault removal to prevent failures from the system. For
the sake of simplicity, the concept of agent is used in
this paper to refer to software or hardware (robot) sys-
228
Trinh L., CÃijrÃijklÃij B. and EkstrÃ˝um M.
Fault Tolerance Analysis for Dependable Autonomous Agents using Colored Time Petri Nets.
DOI: 10.5220/0006196002280235
In Proceedings of the 9th International Conference on Agents and Artificial Intelligence (ICAART 2017), pages 228-235
ISBN: 978-989-758-219-6
Copyright
c
2017 by SCITEPRESS – Science and Technology Publications, Lda. All rights reserved

tems which perform actions to interact with an envi-
ronment. Extensive literature reviews of conventional
works to deal with the means to remain dependabil-
ity of autonomous agents are presented by Guiochet
(Guiochet, 2015). It is noted that not all the faults
from the system always can be analyzed and removed.
Fault tolerance therefore aims at continuing agent ser-
vices even with the presence of faults during the op-
erational stages of autonomous agents. Usually, fault
tolerance is implemented by using redundant agents,
i.e., once a failure is present, the backup agent is acti-
vated to replace the failed one. One limitation of most
conventional works is that there is a lack of investi-
gation on the analysis of fault tolerance mechanism
within the scope of system dependability. Obviously,
the evaluation on the fault tolerance ability of a sys-
tem could provide valuable information to improve
the system performance. This paper therefore pro-
poses a fault tolerance analysis for autonomousagents
within the context of agent-agent collaboration. By
the means of fault analysis, different methods such as
Petri net (PN), fault tree analysis (FTA), failure modes
effects and criticality analysis (FMECA), and hazard
operability (HAZOP) have been developed (Bernardi
et al., 2013). Yet, the PN framework has received a
lot of attention from research community due to its
wide applications for fault prevention in both devel-
opment and operational stages of an agent architec-
ture. Which also includes support for mitigation of
the implementation progress. With regards to those
advantages, an extended PN with colored time PN
(CTPN) for the analysis of fault tolerance mechanism
of collaborative agents has been chosen.
The rest of the paper is organized as follows. Sec-
tion 2 presents extensive literature reviews related to
this work. The analyses of fault tolerance in both cen-
tralized and decentralized approaches together with
PN background are described in Section 3. Exper-
imental results are illustrated in Section 4. Finally,
Section 5 concludes the paper with discussion of fu-
ture works.
2 RELATED WORKS
As aforementioned,the assessment of system depend-
ability is based on the basic attributes. Depending on
the specific applications, different attributes are used
to measure the dependability of a system. In the early
developments of software platforms, a multi-level
view of dependable computing was first developed by
Parhami (Parhami, 1994), in which most dependabil-
ity attributes were implemented. For robotics, with
regards to the safety to assess the dependability, an
intelligent home care robot to assist elderly people
was introduced by (Graf and Gele, 2001). The pro-
posed home care system was equipped with alterna-
tive levels of safety to prevent accidents caused by a
person being hit by the robot. The safety navigation
system consisted of user interface, path planning, and
obstacle avoidance with extensive sensors for motion
detection. In the work of (Mustapic et al., 2004), a
safe platform for industrial robotics has been devel-
oped. The authors have initialized the architectural
level of how to open a platform for quality constraints
and how to implement fault prevention. Although the
aspect of dependability was of major interest, these
papers did not address issues related to collaborative
robots.
For reliability analysis, PN has been applied as
an effective technique to model dependability (Mal-
hotra and Trivedi, 1995). Recently, reliability assess-
ment was introducedwith time PN and Markov chains
(Kohl´ık, 2009). The analysis of fault tolerance in
manufacturing systems by using PN was developed
by (Miyagi and Riascos, 2004). In their study, the
hierarchical and modular integration of PN was com-
bined to analyze production process, fault detection
process, and fault treatment process. Meanwhile, the
application of the generalized stochastic PN used on
the navigation of a single service agent was presented
by (Kim and Chung, 2007). The coordination of mul-
tiple controllers for agent navigation was then intro-
duced by (Moon and Chung, 2012). Similarly, PN
was used for the control of a group of robotic agents
(Joaquin et al., 2011).
In another aspect, the development of fault toler-
ance aims at increasing the reliability of a system. In
the work of (Troubitsyna and Javed, 2014), adaptive
fault tolerance was developed with regards to the sys-
tem dependability. A research on fault tolerance for
a group of agents in a cooperative environment was
described by (Haddad and Haddad, 2004). In their re-
search, the authors proposed a communication mech-
anism between the agents in a team to coordinate and
allocate the resources. The PN was used to illustrate
the model of the whole system. However, the research
is limited to a scheduling protocol for an agent team.
Close to our study, the fault tolerance analysis with
PN for a coordination of multi agents was developed
by (Acharya et al., 2014). However the approach pro-
posed by Acharya et al. has just initialized a picture
of how the system may look like. The study lacked
experimental setup for validation. Moreover, the non-
colored and non-hierarchy PN structure used in the
approach made the design complicated and unclear.
In this paper, the colored time PN enhanced with a
hierarchy structure is utilized to analyze the depend-
Fault Tolerance Analysis for Dependable Autonomous Agents using Colored Time Petri Nets
229

ability of cooperative autonomous agents. The ef-
fectiveness of color tokens helps to distinguish mul-
tiple agents working together to address a compli-
cated tasks of multiple subtasks. Unlike the origi-
nal Petri nets, the hierarchy structure of colored PN
combined with time value lacks for well-define math-
ematical tools for analysis. To deal with difficulty, the
repeated experiments and recorded data at interested
places and transitions of PN are applied for statistical
analysis. Finally, the proposed approach are exam-
ined with centralized and distributed studies.
3 BACKGROUND AND
PROPOSED APPROACH
3.1 Background of Petri Nets
Petri net (PN)(Yen, 2006) was described as a se-
quence of place-transition-place to move tokens
within a PN network. Well defined mathematic mod-
els with a set of theory and linear algebra have been
developed to analyze the state-transition of PN. Be-
sides, a graphical presentation of PN helps to have a
clear visualization of the modeled system, which may
consist of synchronization, concurrency, and confu-
sion stage within distributed manners.
In mathematical aspect, PN is a bipartite graph de-
fined as a set of three tuples (Γ,Σ,Θ), where Γ and Σ
are the set of finite places and transitions in such a
way that there is no element belonging to both Γ and
Σ,i.e, Γ and Σ are disjoint sets. Θ is the set of arcs
so that an arc connects from a place to a transition
and vice versa and the connections between places or
between transitions are unacceptable. The arcs go-
ing out from a place to a transition are named input
places of transitions, while the arcs going out from a
place are defined as output places of transitions. An
extension of PN adds the weight on the input and out-
put flows of each transition. With regards to the set
of output weights W
−
and input weights W
+
, PN is
refined with a set of five tuples (Γ,Σ,Θ,W
−
,W
+
).
A marking M of PN assigns a number of tokens to
each place. Let the marking M be expressed by a vec-
tor [M(p
1
),M(p
2
),...,M(p
i
),...,M(p
n
)], where p
i
is
a place, n the number of places in PN, and M(p
i
)
the number of tokens at the place p
i
. Let W
−
be a
two dimensional matrix of weights W
−
(p
i
,t
j
) from
the place p
i
to the transition t
j
. W
+
is defined in a
similar way with the weight W
+
(t
j
, p
i
) from the tran-
sition t
j
to the place p
i
. Note that 1 ≤ j ≤ m, where m
is the number of transition. With regards to the tran-
sition t, the change of the marking vector from M to
M
′
is expressed by
M
′
(p) = M(p) + W
+
(t, p) −W
−
(p,t),∀p. (1)
The tuple (Γ,Σ,Θ,W
−
,W
+
) of PN is extended to
(Γ,Σ,Θ,W
−
,W
+
,M
0
) with M
0
as the initial mark-
ing. Applying linear algebra based on equation (1),
the reachability from the marking M to M
′
can be
checked. Moreover, a full graph of all markings and
possible transition from one marking to another are
described by state-space analysis. As the number of
vertices and edges of the state-space graph increase
dramatically with regards to the number of places and
transitions, state-space analysis is limited to a small
PN network.
The colored PN (CPN) is an extension of PN,
in the sense that CPN has different types of token
marked with color (Jensen, 2003). The transition fires
separately with respect to each kind of token. The
arc expressions built from operators and functions are
further used to decide the transition behavior of differ-
ent colors. Unlike conventional PN, only backward-
compatible CPN is able to be analyzed with avail-
able mathematical models. Other CPNs must rely on
simulation with statical analysis to reveal the visiting
frequencies of tokens at places and availability of a
marking state.
Another extension is the stochastic PN which adds
a time delay at each transition where the firing rate
is determined by a random variable. The state-space
analysis is performed by probabilistic inference in a
Markov chain. Generalized stochastic PN extended
the stochastic PN with the possibility of immediate
transition to forward to token without any time delay.
In this paper, the generalized framework with colored
time PN (CTPN) is utilized to deal with the time de-
lay of both non-deterministic and deterministic vari-
ables. CPNTools (Jensen, 2003) are used to create
CTPN and perform the analysis.
3.2 Fault Tolerance with Cooperative
Agents
In the proposed system, it is supposed that there is
a pool of agents A = {a
1
,a
2
,...,a
i
,...,a
N
}, where N
is the number of agents. A sequence of tasks T =
{T
1
,T
2
,...,T
i
...,T
t
} are assigned to the set of agents
A to be processed one by one where t is the time
index. For a complicated task, it is convenient to
separate each task into a number of subtasks T
i
=
{t
i1
,t
i2
,...,t
iG
}, where iG is the number of subtasks
of the task T
i
. The subtasks are categorized into inde-
pendent subtasks and dependent subtasks. The inde-
pendent subtasks can be processed independently and
concurrently by different agents. Meanwhile, the de-
ICAART 2017 - 9th International Conference on Agents and Artificial Intelligence
230
pendent subtasks, like t
ij
→ t
ik
, requires that the sub-
task t
ij
must be completed before t
ik
.
For fault tolerance, the definition of peer agent is
introduced. The two agents a
i
and a
j
are peer agents
if they are able to solve the common subtask. Thanks
to the availability of multiple peer agents, once an
agent fails to do a subtask, other peer agents with the
similar function are used to continue the tasks. In
this model, the agents {a
1
,a
2
,a
3
} and the subtasks
{t
1
,t
2
,t
3
} are available. Agent a
1
is assigned with the
subtasks {t
1
,t
2
}, agent a
2
with the subtasks {t
2
,t
3
},
and a
3
with the subtasks {t
1
,t
3
} respectively.
3.3 CPN Models of Agents for Fault
Tolerance Analysis of Centralized
Systems
In this model, all subtasks are managed by a super-
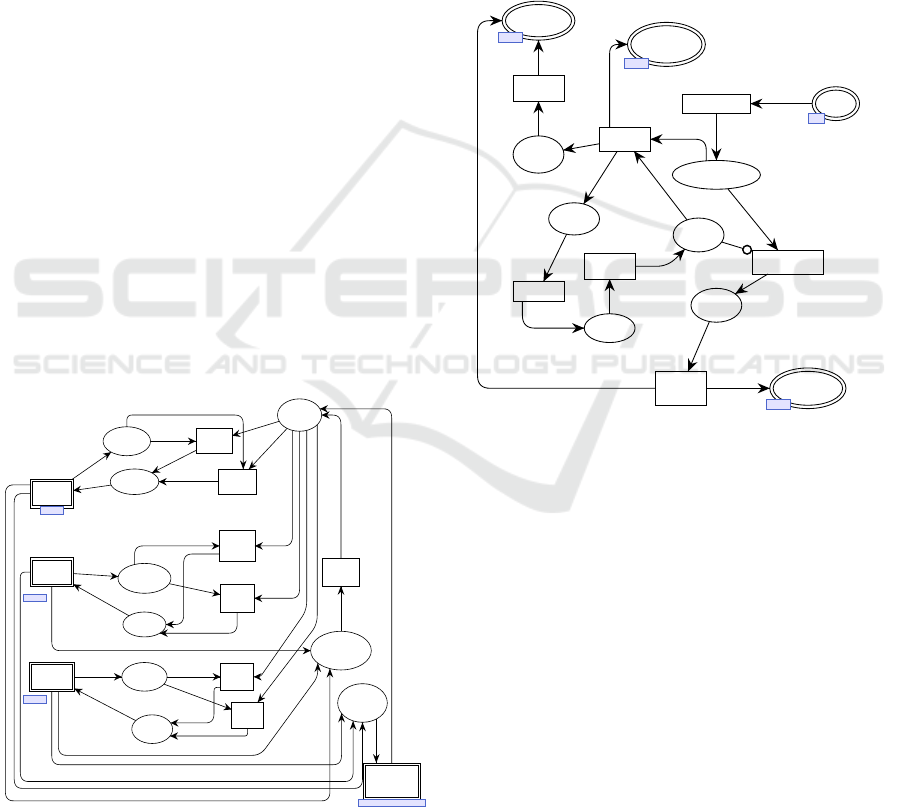
vision module (SM) (Figure 1) with the tokens t(1),
t(2), and t(3). Once the SM receives a request to
perform a set of subtasks from a task management
module (TMM), it will send the subtasks to available
agents according to the description provided in Sec-
tion 3.2. If one of the agents fails to complete the sub-
task, the SM will assign the subtask to another peer
agent. Meanwhile, the SM will collect all finished
subtasks and send them to the TMM. For each sub-
task tree, the TMM is respectively designed. In this
paper, the design of the TMM for a combined subtask
tree is introduced as an example.
Subtasks
TSK
Completed
subtasks
TSK
Uncompleed
subtasks
TSK
For a(1)
AGxTSK
For a(2)
AGxTSK
For a(3)AGxTSK
Available
a(1)
AG
1`a(1)
Available
a(2)
AG
1`a(2)
Available
a(3)
AG1`a(3)
Agent(1)
Agent
Try
again
Agent(2)
Agent
Agent(3)
Agent
(a1xt1)
(a1xt2)
(a2xt2)
(a2xt3)
(a3xt1)
(a3xt3)
Task
Management
Task Management
tk
tk
tk
tk
(tk,ag)
ag
(tk,ag)
ag
tk
tk
ag
(tk,ag)
tk
tk
a(1)
t(1)
(t(1),a(1))
t(2)
a(1)
(t(2),a(1))
t(2)
a(2)
(t(2),a(2))
t(3)
a(2)
(t(3),a(2))
t(1)
t(3)
a(3)
a(3)
(t(1),a(3))
(t(3),a(3))
tk
tk
Agent
Agent
Agent
Task Management
Figure 1: Design of a supervision module in centralized sys-
tems.
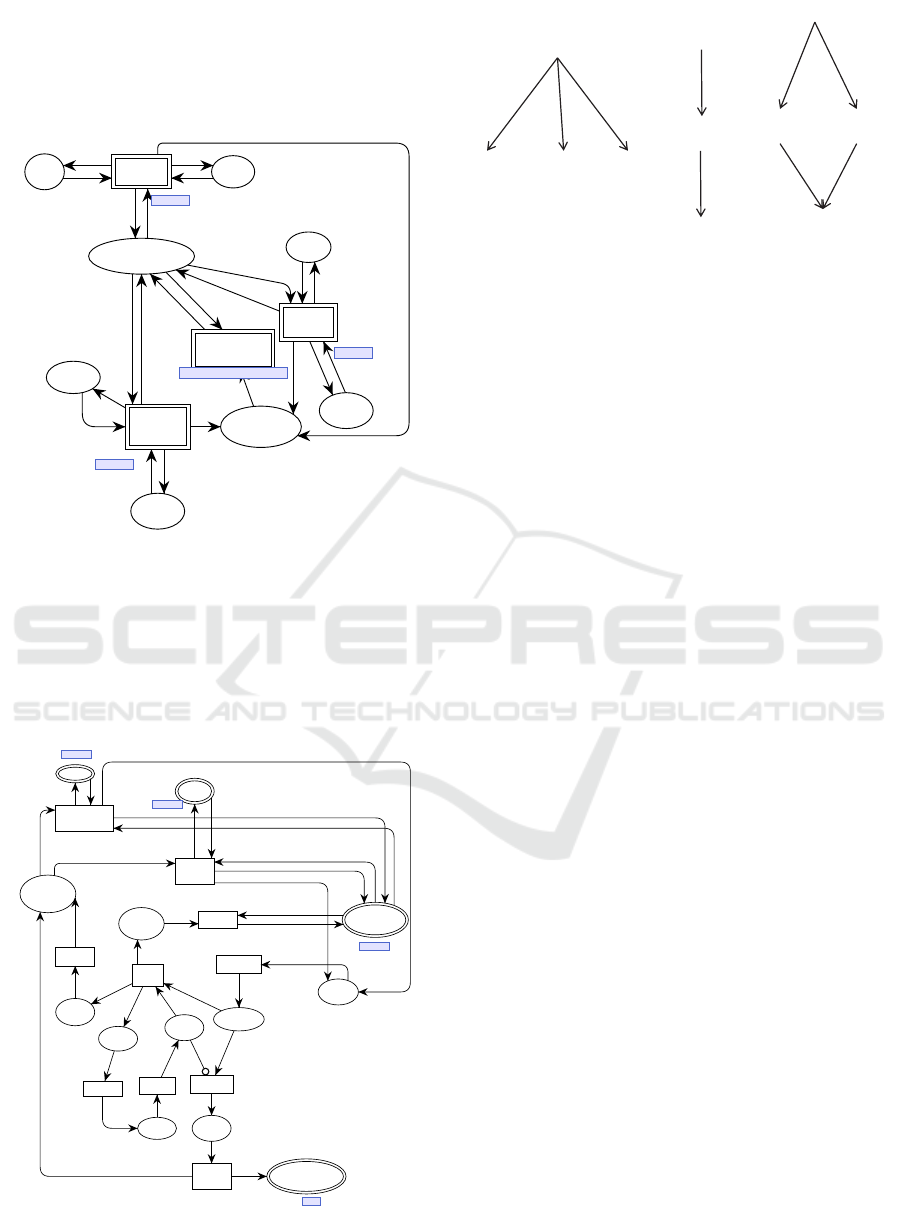
The agents a
1
, a
2
, and a
3
(Figure 2) share the same
structure. It can be noted that this structure models
the agent modules (AMs) in the SM. If there is an
available agent, that agent will receive a subtask from
the SM. The approximate processing time to finish the
subtask is assumed to be τ
p
(value proctime in agent).
Meanwhile, the fail event of an agent is modeled by
a random variable of the exponential distribution with
the rate λ
e
(value failrate in agent). Once the agent
fails, the failed subtask will be returned to the SM and
it requires a time τ
r
(value fixtime in agent) to recover
the normal activity of the agent. The tokens a(1),
a(2), and a(3) are used to reveal the availability of
the agents. Obviously, the performance of fault toler-
ance mechanism will depend on the tuples (τ
p
,λ
e
,τ
r
)
and the further analyses are presented in Section 4.
Tasks
In
AGxTSK
Return
agents
Out
AG
Processing
AGxTSK
Done
AGxTSK
Completed
tasks
Out
TSK
Failures
F
Locked
F
Failed
agents
AG
Returned
tasks
Out
TSK
Failed
token
F
1`f
start
transition
after
finished
failed
move
repair
fire
1`(tk,ag)@+
proctime
1`(tk,ag)
1`(tk,ag)
1`(tk,ag)
1`tk1`ag
1`f
1`f
1`(tk,ag)
1`ag
1`ag
1`ag@+
fixtime
1`f
1`tk
1`f
1`f
1`f@+exp(failrate)
1`(tk,ag)
Out
Out
Out
In
Figure 2: Design of an agent module in centralized systems.
3.4 CPN Models of Agents for Fault
Tolerance Analysis of Distributed
Systems
For a distributed system, in the SM (Figure 3), each
agent will share the information of which subtasks
have been completed and which subtasks are un-
finished by broadcasting messages for any updates.
Whenever an agent decides to do a subtask, it will
send a broadcast message to the other agents. If there
are no conflicts, the agent will start the subtask and
remove the subtask from an uncompleted subtasks
(USs) place to process. Once the subtask is accom-
plished, the agent broadcasts a message to inform the
others to update and append the list in a completed
subtasks (CSs) place with the new completed subtask.
The agent, while doing a task, is being checked for its
availability and will frequently send an ”alive” mes-
sage. All agents will be noticed of the failures of an
Fault Tolerance Analysis for Dependable Autonomous Agents using Colored Time Petri Nets
231
agent and the information is updated in the USs place.
In our system, it is assumed that the copy of the list
USs and CSs are available in the memory of every
agents. The design of an AM (Figure 4) is developed
Uncompleted
subtasks
TSKlist
Completed
subtasks
TSK
t(1)
TSK
1`t(1)
t(2)
TSK
1`t(2)
t(3)
TSK
1`t(3)
t(1) TSK
1`t(1)
t(2)
TSK
1`t(2)
t(3)
TSK
1`t(3)
Agent(1)
Agent
Agent(2)
Agent
Agent(3)
Agent
Task
Management
Task Management
tk
tk
tk
tk
tlist
tlist
tlist
tlist
tk
tk
tk
tk
tlist
tlist
tlist
tk
tk
tk
tk
tk
tk
tk
tk
tlist
Agent
Agent
Task Management
Agent
Figure 3: Design of a supervision module in distributed sys-
tems.
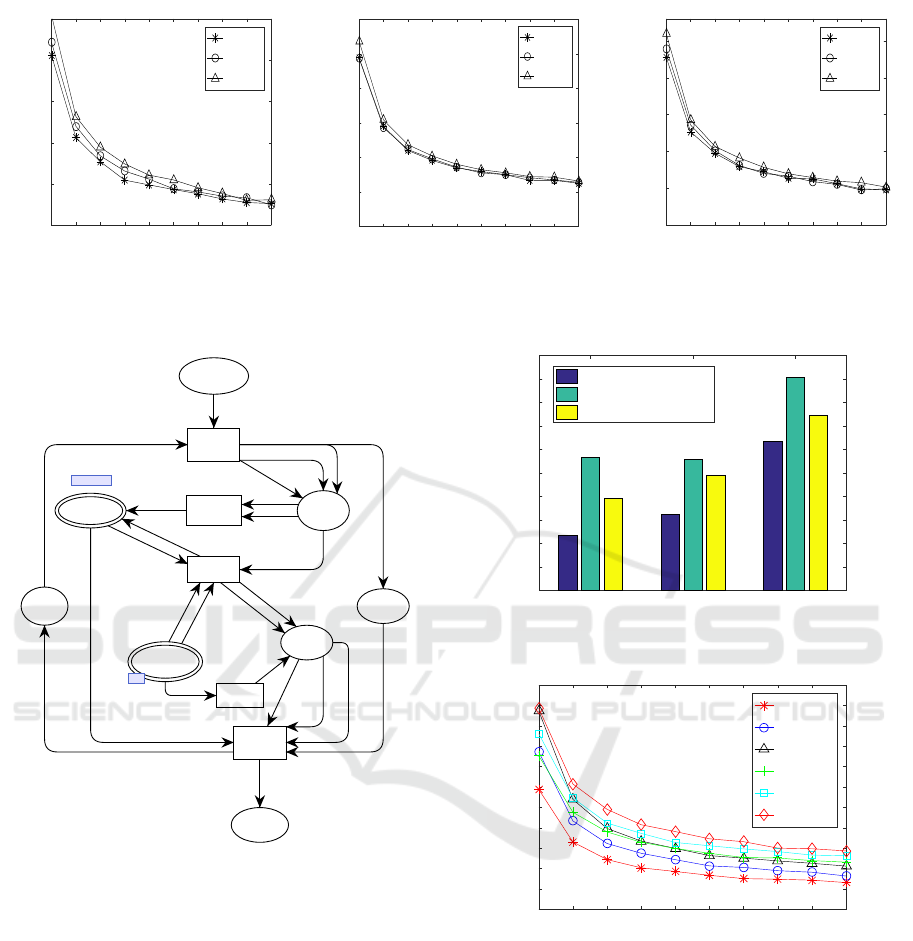
from the centralized systems. Yet, the module is ad-
vanced with the ability to choose and process the sub-
tasks from the USs by itself. Besides, the time delay
with a variable τ
b
(value broadcast in agent) is intro-
duced for the broadcast process.
Tasks
AGxTSK
Available
agents
AG
1`a(1)
Processing
AGxTSK
Done AGxTSK
Completed
tasks
Out
TSK
Failures
F
Locked
F
Failed
agents
AG
Returned
tasks
TSK
Failed
token
F
1`f
Uncompleted
tasks
In/Out
TSKlist
Test1
In/Out
TSK
Test2
In/Out
TSK
start
transition
after
finished
@+broadcast
failed
move
repair
fire
add
@+broadcast
check
@+broadcast
[mem tlist tk]
check
@+broadcast
[mem tlist tk]
1`(tk,ag)@+
proctime
1`(tk,ag)
1`(tk,ag)
1`(tk,ag)
1`tk
1`ag
1`f
1`f
1`(tk,ag)
1`ag1`ag
1`ag@+
fixtime
1`f
1`tk
1`f
1`f
1`f@+exp(failrate)
1`(tk,ag)
tk
tlist
tlist^^[tk]
tk
tlist
ag
(tk,ag) rm tk tlist
tk
ag
tk
tk
tlist
rm tk tlist
(tk,ag)
In/Out
Out
In/Out
In/Out
Figure 4: Design of an agent module in distributed systems.
t
1
t
2
t
3
t
1
t
2
t
3
t
1
t
2
t
3
(a) (b) (c)
(a) (b) (c)
Figure 5: Subtask trees. (a) Three subtasks t
1
, t
2
, and t
3
are
independent. (b) The order of processing subtasks is t
1
, t
2
,
and then t
3
. (c) Two subtasks t
1
and t
2
must be completed
before the subtask t
3
is processed.
4 RESULTS
As it is depicted in Figure 5, the differentsubtask trees
including independent subtasks, dependent subtasks,
and the combination of independent and dependent
subtasks are used for testing CPN models for both
centralized and distributed systems.
4.1 Fault Tolerance Analysis of
Centralized Systems
The TMM (Figure 6) is utilized to handle the com-
plicated tasks requiring the subtask t
3
to follow the
accomplishment of the subtask t
1
and t
2
. The TMMs
are designed similarly for the independent subtasks
and dependent subtasks. One hundred tasks are gen-
erated to test the fault tolerance ability of the coop-
erative agents. Each task consists of three concur-
rent subtasks t
1
, t
2
, and t
3
. Once all the subtasks are
completed, the TMM checks the results to confirm
the accomplishment of the task and requires a new
task for the set of agents. The performance of fault
tolerance is evaluated by the average processing time
needed to process each task. The processing time of
each agent for a subtask is assumed τ
p
= 20. The
longer recovering time τ
r
needed of each agent after
a fail appears, the more time the whole system will
need to finish a task in general. Therefore, three cases
τ
r
/τ
p
= 0.5, τ
r
/τ
p
= 1, and τ
r
/τ
p
= 1.5 were evalu-
ated respectively. The fail rate varies from 10 to 100,
(10 ≤ λ
e
≤ 100).
The results (Figure 7(a)) reflect what is expected
that the processing time increases when τ
r
/τ
p
in-
creases. Meanwhile, the processing time decreases
when the intervals between two fail events are pro-
ICAART 2017 - 9th International Conference on Agents and Artificial Intelligence
232
10 20 30 40 50 60 70 80 90 100
Fail rate
1.5
2
2.5
3
3.5
4
Processing time
τ
r
/τ
p
=0.5
τ
r
/τ
p
=1
τ
r
/τ
p
=1.5
10 20 30 40 50 60 70 80 90 100
Fail rate
1.5
2
2.5
3
3.5
4
Processing time
τ
r
/τ
p
=0.5
τ
r
/τ
p
=1
τ
r
/τ
p
=1.5
10 20 30 40 50 60 70 80 90 100
Fail rate
1.5
2
2.5
3
3.5
4
Processing time
τ
r
/τ
p
=0.5
τ
r
/τ
p
=1
τ
r
/τ
p
=1.5
(a) (b) (c)
Figure 7: The average processing time to finish a task with respect to τ
r
/τ
p
in centralized systems. (a) Independent subtasks,
(b) Dependent subtasks, and (c) Mixtures of independent and dependent subtasks.
Generate
tasks
TSKx
100`(t(1),t(2),t(3))
Subtasks
Out
TSK
Finish
1 task
1
Completed
subtasks
In
TSK
Finish
tasks
TSKx
Process
1 task
Input
buffer
TSK
Output
buffer
TSK
divide
check
1st
2nd
3rd
done
(t(1),t(2),t(3))
(t(1),t(2),t(3))
t(3)
t(2)
t(1)
t(1)
t(1)
t(2)
t(2)
t(2)
t(3)
t(3)
t(1)
t(2)
t(3)
t(2)
t(3)
t(3)
t(1)
t(1)
Out
In
Figure 6: Design of task management module for mixtures
of independent and dependent subtasks in centralized sys-
tems.
longed. Logarithm scale is utilized to present the pro-
cessing time as it is very high with respect to the low
fail rate λ
e
. For dependent subtasks, the same con-
figurations of parameters τ
p
, τ
r
, and λ
e
are used to
perform the simulation results. The similar results
(Figure 7(b)) are obtained that the average processing
time increases according to rising τ
r
/τ
p
and the de-
creasing interval between two fail events. However,
there are not many differences between τ
r
/τ
p
= 1 and
τ
r
/τ
p
= 1.5. This may be due to the similar probabil-
ity of one of all three agents available to take care of
a subtask each time in the two cases. In the case of
combined subtask tree, the similar performance anal-
ysis of the processing time to complete all the tasks
with regards to the ratio τ
r
/τ
p
is acquired as given
in Figure 7(c). In conclusion, the dependency of dif-
ferent subtask within a task will require more time to
complete the task. Besides, the processing time in-
creases with respect to the increasing ratio τ
r
/τ
p
in
all the above studies.
4.2 Fault Tolerance Analysis of
Distributed Systems
As there are not many differences in the design of the
TMM between centralized and distributed systems, an
example of the TMM to deal with the complicated
tasks consisting of independent and dependent tasks
is shown in Figure 8. The configuration parameters of
τ
p
, τ
r
, and λ
e
are similar to those used in Section 4.1,
thus τ
b
= 2 is used in the following experiments.
The evaluation of fault tolerance performance of
distributed agents to process the independent subtasks
is given in Figure 9(a). Similarly, the average pro-
cessing time to complete a task is proportional to the
ratio τ
r
/τ
p
. However, due to the delay of broadcast-
ing messages, in overall, the processing time in dis-
tributed system is higher than that in centralized sys-
tem.
The results (Figure 9(b)) show the fault tolerance
performance of the distributed system to deal with
the tasks of dependent subtasks. However, the differ-
ences of the processing time with regards to the ratio
τ
r
/τ
p
in the cases 0.5, 1.0, and 1.5 are not significant.
Because all agents take time to deliver the broadcast
messages, a failed agent may be recovered before a
new subtask arrives. Therefore, the distributed system
is less dependent on the recovering time rather than
the centralized system. However, more experiments
must be performed to validate this conclusion. The
Fault Tolerance Analysis for Dependable Autonomous Agents using Colored Time Petri Nets
233
10 20 30 40 50 60 70 80 90 100
Fail rate
1.5
2
2.5
3
3.5
4
Processing time
τ
r
/τ
p
=0.5
τ
r
/τ
p
=1
τ
r
/τ
p
=1.5
10 20 30 40 50 60 70 80 90 100
Fail rate
1.5
2
2.5
3
3.5
4
4.5
Processing time
τ
r
/τ
p
=0.5
τ
r
/τ
p
=1
τ
r
/τ
p
=1.5
10 20 30 40 50 60 70 80 90 100
Fail rate
1.5
2
2.5
3
3.5
4
Processing time
τ
r
/τ
p
=0.5
τ
r
/τ
p
=1
τ
r
/τ
p
=1.5
(a) (b) (c)
Figure 9: The average processing time to finish a task with respect to τ
r
/τ
p
in distributed systems systems. (a) Independent
subtasks, (b) Dependent subtasks, and (c) Mixtures of independent and dependent subtasks.
Genere
tasks
TSKx
100`(t(1),t(2),t(3))
Subtasks
In/Out
TSKlist
Finish
1 task
1
Completed
subtasks
In
TSK
Finish
tasks
TSKx
Process
1 task
Input
buffer
TSK
Output
buffer
TSK
divide
check
3rd
done
1st&2nd
(t(1),t(2),t(3))
(t(1),t(2),t(3))
tlist
t(1)
t(2)
t(3)
t(3)
t(2)
tlist^^[t(3)]
t(2)
t(3)
t(3)
t(1)
t(2)
t(3)
t(1)
t(2)
[t(1),t(2)]
t(1)
t(1)
tlist
In/Out
In
Figure 8: Design of task management module for mixtures
of independent and dependent subtasks in distributed sys-
tems.
last experimental results (Figure 9(c)) present how
the distributed systems process the tasks of mixed in-
dependent and dependent subtasks. There are simi-
lar conclusions to those presented in previous simula-
tions.
Finally, an overall evaluation (Figure 10) is used
to assess the fault tolerance ability of cooperative dis-
tributed agents. It can be seen that the appearances of
more dependent subtasks will prolong the whole pro-
cess to perform the task. Besides, the time required
by communication protocol used in distributed pro-
tocol also affected the fault tolerance performance.
In order to investigate further on this concern, the
processing time is evaluated with regards to the time
0.5 1.0 1.5
Ratio τ
r
/τ
p
0
200
400
600
800
1000
1200
1400
1600
1800
2000
Processing time
Independent subtasks
Dependent subtasks
Combined subtasks
Figure 10: Overall evaluation of distributed systems.
10 20 30 40 50 60 70 80 90 100
Fail rate
1.5
2
2.5
3
3.5
4
4.5
5
5.5
6
6.5
7
Processing time
τ
b
/τ
p
=0.25
τ
b
/τ
p
=0.5
τ
b
/τ
p
=0.75
τ
b
/τ
p
=1
τ
b
/τ
p
=1.25
τ
b
/τ
p
=1.5
Figure 11: Correlation of time to deliver broadcast message
with the fault tolerance performance.
needed to broadcast messages among agents. Sim-
ilarly, the fixed ratio is in a range τ
r
/τ
p
= 1 and
0.25 ≤ τ
b
/τ
p
≤ 1.5. The results in Figure 11 clearly
showthe effects of communicationtime with fault tol-
erance ability of the system.
5 CONCLUSIONS
In this paper, the formulation of CTPN has been in-
troduced for the fault tolerance analysis for a group
ICAART 2017 - 9th International Conference on Agents and Artificial Intelligence
234

of agents cooperating to solve complicated tasks. The
fault tolerance is performed by replacing a failed
agent to continue the unfinished tasks. The CTPN
models have been designed to validate this method
for both centralized and distributed approaches. In
simulations, different trees of independent and depen-
dent subtasks were evaluated. From the experimental
results, the analysis has shown the correlation of the
processing time to finish a complicated task with the
failure rates of an agent. Besides, the experiments re-
vealed that for distributed agents, the communication
protocol also played an important role on the fault tol-
erance success of the whole system.
In future, the proposed approach will be extended
to deal with a more complicated tree of subtasks.
Other fault tolerance mechanisms for the group of
agents are also concerned. Furthermore, experiments
with real robots will be planned to compare the fault
tolerance analysis provided by PN with that acquired
from realistic setup.
ACKNOWLEDGEMENTS
The research leading to the presented results has
been undertaken within the research profile DPAC -
Dependable Platforms for Autonomous Systems and
Control project, funded by the Swedish Knowledge
Foundation.
REFERENCES
Acharya, S., Upadhyay, P. D., and Dutta, A. (2014). Fault
tolerance multi agent co-ordination: A petri net based
approach. In Proceedings on International Confer-
ence on Recent Advances and future Trends in Infor-
mation Technology.
Aviˇzienis, A., Laprie, J., Randell, B., and Landwehr, C.
(2004). Basic concepts and taxonomy of dependable
and secure computing. IEEE Transactions on Depend-
able and Secure Computing, 1(1).
Bernardi, S., Merseguer, J., and Petriu, D. C. (2013).
Model-Driven Dependability Assessment of Software
Systems. SPRINGER.
Graf, B. and Gele, M. (2001). Dependable interation with
an intelligent home care robot. In In proceedings of
ICRA - Workshop on Technical Challenge for Depend-
able Robots in Human Environments. IEEE.
Guiochet, J. (2015). Trusting robots : Contributions to de-
pendable autonomous collaborative robotic systems.
Technical report, LAAS - Laboratoire d’analyse et
d’architecture des systmes [Toulouse].
Haddad, J. and Haddad, S. (2004). A fault-tolerant commu-
nication mechanism for cooperative robots. Interna-
tional Journal of Production Research, 42(14):2793–
2808.
Jensen, K. (2003). Coloured Petri Nets: Basic Concepts,
Analysis Methods and Practical Use. Springer Verlag.
Joaquin, L., Diego, P., and Eduardo, Z. (2011). A frame-
work for building mobile single and multi-robot ap-
plications. Robotics and Autonomous Systems, 59(3-
4):151–162.
Kim, G. and Chung, W. (2007). Navigation behavior se-
lection using generalized stochastic petri nets for a
service robot. IEEE Transactions on Systems, Man,
and Cybernetics part C: Applicactions and Reviews,
37(4).
Kohl´ık, M. (2009). Dependability models based on petri
nets and markov chains. In Information Science and
Computer Engineering, 1st Class, Full-time study.
Malhotra, M. and Trivedi, K. (1995). Dependability model-
ing using Petri-nets. IEEE Transactions on Reliability,
44(3).
Miyagi, P. and Riascos, L. (2004). Modeling and analy-
sis of fault-tolerant systems for machining operations
based on petri nets. Control Engineering Practice,
14(4):397–408.
Moon, C. and Chung, W. (2012). Coordination of multi-
ple control schemes for mobile robot navigation on
the basis of the generalized stochastic petri-nets. Ad-
vanced Robotics, 26(5-6):581–603.
Mustapic, G., Anderson, J., Norstrom, C., and Wall, A.
(2004). A Dependable Open Platform for Industrial
Robotics - A Case Study. SPRINGER.
Parhami, B. (1994). A multi-level view of dependable
computing. Computers and Electrical Engineering,
20(4):347–368.
Troubitsyna, E. and Javed, K. (2014). Towards systematic
design of adaptive fault tolerant systems. In ADAP-
TIVE 2014, The Sixth International Conference on
Adaptive and Self-Adaptive Systems and Applications.
IARIA.
Yen, H. (2006). Introduction to petri net theory, in recent ad-
vances in formal languages and applications. In Stud-
ies in Computational Intelligence, volume 25, pages
343–373.
Fault Tolerance Analysis for Dependable Autonomous Agents using Colored Time Petri Nets
235
