
Which Saliency Detection Method is the Best to Estimate the Human
Attention for Adjective Noun Concepts?
Marco Stricker
1
, Syed Saqib Bukhari
1
, Mohammad Al Naser
1
, Saleh Mozafari
1
,
Damian Borth
1
and Andreas Dengel
1, 2
1
German Research Center for Artificial Intelligence (DFKI), Trippstadter Straße 122, 67663 Kaiserslautern, Germany
2
Technical University of Kaiserslautern, Erwin-Schr
¨
odinger-Straße 1, 67663 Kaiserslautern, Germany
Keywords:
Saliency Detection, Human Gaze, Adjective Noun Pairs, Eye Tracking.
Abstract:
This paper asks the question: how salient is human gaze for Adjective Noun Concepts (a.k.a Adjective Noun
Pairs - ANPs)? In an existing work the authors presented the behavior of human gaze attention with respect
to ANPs using eye-tracking setup, because such knowledge can help in developing a better sentiment classi-
fication system. However, in this work, only very few ANPs, out of thousands, were covered because of time
consuming eye-tracking based data gathering mechanism. What if we need to gather the similar knowledge
for a large number of ANPs? For example this could be required for designing a better ANP based senti-
ment classification system. In order to handle that objective automatically and without using an eye-tracking
based setup, this work investigated if there are saliency detection methods capable of recreating the human
gaze behavior for ANPs. For this purpose, we have examined ten different state-of-the-art saliency detection
methods with respect to the ground-truths, which are human gaze pattern themselves over ANPs. We found
very interesting and useful results that the Graph-Based Visual Saliency (GBVS) method can better estimate
the human-gaze heatmaps over ANPs that are very close to human gaze pattern.
1 INTRODUCTION
In this work (Al-Naser et al., 2015), the authors pre-
sented a study of ANPs and their attention pattern as
analyzed from eye-tracking experiments. In particular
they were interested in gaze behavior of subjects dur-
ing ANP assessment to infer (1) the ANP’s objectivity
vs. subjectivity, which is derived from the correlation
of fixations in context of positive or negative assess-
ment, and (2) the implicit vs. explicit assessment of
ANPs to study their holistic or localizable character-
istics. This was realized by explicitly asking the sub-
ject to identify regions of interest (ROI) specific to the
adjective during their eye-tracked ANP annotation.
Once equipped with this knowledge, approaches can
be developed to enhance the characteristic ROIs re-
sponsible for the adjectives to increase or decrease its
sentiment for classification. However, in the previous
work, they only targeted 8 out of 3000 ANPs (Borth
et al., 2013) and they used only 11 human partici-
pants. What if we need to investigate the same for
all ANPs? For example to design an improved ANP
based sentiment classification system. Through our
previous eye-tracking based setup, a manual creation
of such a database is not feasible.
The goal of the previous work was to extract the
information on how emotions and sentiment affect hu-
man fixation. Now, in this paper, we want to investi-
gate if there are saliency detection methods capable of
recreating the human gaze behaviour for ANPs and if
specific methods are better suited to capture features
of a specific ANP. That would be more efficient for
applications, like sentiment classification, to predict
this behavior automatically.
We used in total ten different state-of-the-art saliency
detection methods from the research literature (as de-
scribed in Section 2). We select four different ANPs:
(a) stormy landscape, (b) damaged building, (c) beau-
tiful landscape and (d) cute baby (as shown in Fig-
ure 1). In the previous work (Al-Naser et al., 2015),
the authors already gathered human gaze information
in the from of heatmaps for these ANPs with respect
to the user’s decision on agreement, disagreement and
combination of both which are also shown in Figure 1.
This work uses these results as ground-truth. The cre-
ation of the ground truth is described in Section 3. Fi-
nally, we compared the result of each saliency detec-
tion method for each ANP with the ground truth using
different evaluation metrics, where different evalua-
tion metrics are described in Section 4 and the com-
Stricker M., Bukhari S., Al Naser M., Mozafari S., Borth D. and Dengel A.
Which Saliency Detection Method is the Best to Estimate the Human Attention for Adjective Noun Concepts?.
DOI: 10.5220/0006198901850195
In Proceedings of the 9th International Conference on Agents and Artificial Intelligence (ICAART 2017), pages 185-195
ISBN: 978-989-758-220-2
Copyright
c
2017 by SCITEPRESS – Science and Technology Publications, Lda. All rights reserved
185

parison is described in Section 5, respectively. The
comparison clearly demonstrates which saliency de-
tection method is able to recreate an agreement with
positive sentiment ANPs while another performs bet-
ter in regard of negative sentiment ANPs, with respect
to corresponding ground-truth information. Finally
we discuss the results in Section 6.
2 STATE-OF-THE-ART
SALIENCY DETECTION
METHODS
A large number of saliency detection methods have
been proposed in the literature. In this paper, we
selected ten different state-of-the-art saliency detec-
tion methods from the literature. These methods are
briefly described here as follows.
1. Attention Simple Global Rarity (Mancas et al.,
2006)(M1
1
.): it is a global approach where no
local information or spatial orientation are used.
The authors describe, that it may be interesting for
images with rare defects which have low contrast.
2. Attention Simple Local Contrast (Mancas
et al., 2007)(M2): it is similar to the first one
but uses a local approach instead of a global one.
Therefore it is interesting for images where the lo-
cal contrast is the most important.
3. Context Aware Saliency (Goferman et al.,
2010)(M3): detects image regions that represent
the scene instead of detecting dominant objects.
This approach is based on four principles of psy-
chology.
4. Graph-Based Visual Saliency (Harel et al.,
2006)(M4): it starts with forming activation maps
on certain feature channels. After that, they are
normalized so that they highlight conspicuity and
admits combination with other maps. The goal of
this approach was to create a simple model which
is naturally parallelized and therefore biological
plausible.
5. Itti and Koch (Itti and Koch, 2000)(M5): they
are describing a neuromorphic model to visualize
attention. It is based on psychological tasks com-
bined with a visual processing front-end.
6. Random Center Surround Saliency (Vikram
et al., 2011)(M6): it calculates the saliency based
on local saliencies. The local saliencies are calcu-
lated over random rectangular regions of interest.
1
Methods will be annotated with these shorter identifier
7. Rare 2007 (Mancas, 2009)(M7): it is a bottom-
up saliency method that only considers color in-
formation for the calculation.
8. Rare 2012 (Riche et al., 2013)(M8): it uses like
Rare 2007 color information but unlike Rare 2007
it also takes orientation information into account.
9. Saliency based Image Retargeting (Fang et al.,
2011)(M9): it is reading the features like inten-
sity, color and texture features from DCT coeffi-
cients in a JPEG bitstream. Combining the Haus-
dorff distance calculation and feature map fusion
the saliency value of a DCT block can be calcu-
lated.
10. Saliency Detection Method by Combining Sim-
ple Priors (Zhang et al., 2013)(M10): it includes
three simple priors. First band-pass filtering mod-
els the way a human would detect salient objects.
For the second prior, the center is focused due to
humans paying attention at the center of an image.
Lastly cold colors are less attractive than warm
ones.
Each of these saliency detection methods pro-
duces an intensity map, same like a heatmap, where
high to low range of saliency is represented by the
dark red to dark blue color range respectively. The
heatmap of each saliency detection method was com-
pared with the ground-truth heatmaps, that were gen-
erated using human gaze attention (Al-Naser et al.,
2015). The next section will briefly summarize the
previous work to show how the ground truth for ANPs
was created.
3 GROUND TRUTH CREATION
OF HUMAN GAZE ANP
First the ground truth images were created for four
ANPs (”Beautiful Landscape”, ”Cute Baby”, ”Dam-
aged Building” and ”Stormy Landscape”) from the
eye gaze data that had been gathered in this publica-
tion (Al-Naser et al., 2015). Each ANP contained ten
different sample images and gaze data of 11 partici-
pants with their responses; for example if a participant
was shown a ”beautiful landscape” sample image, we
recorded his gaze data plus his response whether he
agreed that it is a beautiful landscape or disagreed and
stated that it is not a beautiful landscape. Therefore
for each ANP, each sample image had three differ-
ent forms of ground-truths: (i) one for the gaze data
where the people agreed with the ANP, (ii) one for
disagreement and (iii) one for both agreement and dis-
agreement combined, as shown in Figure 1.
ICAART 2017 - 9th International Conference on Agents and Artificial Intelligence
186
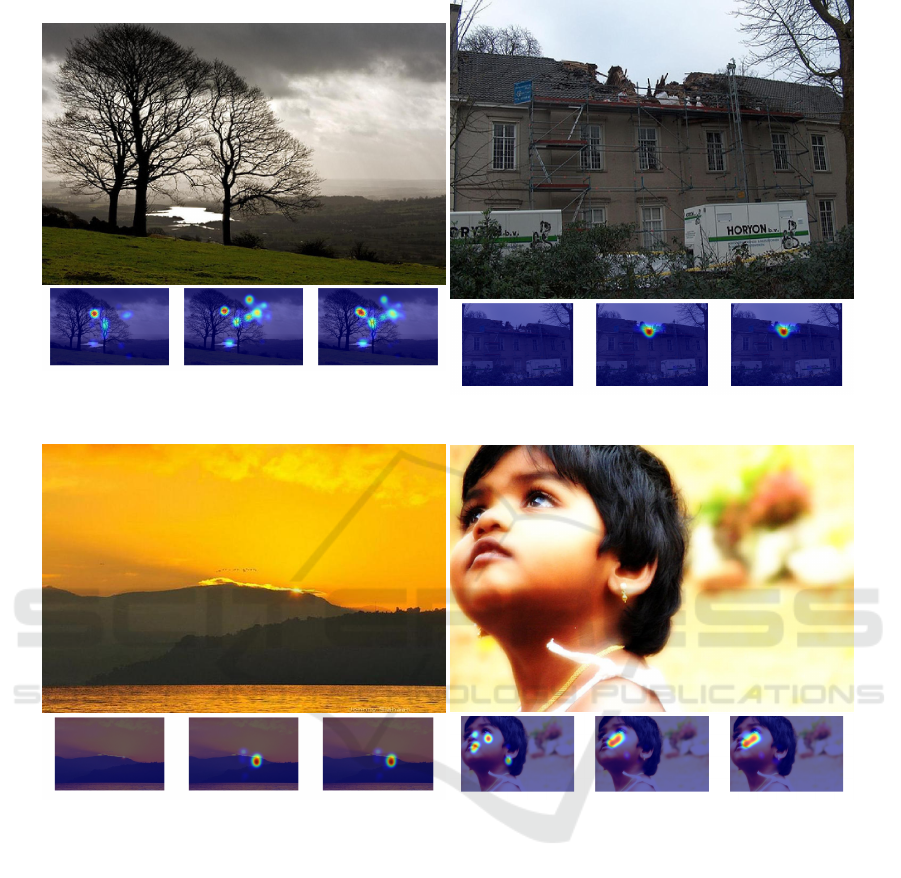
(a) Stormy Landscape (Holistic, Objective)
(b) Damaged Building (Localized, Objective)
(c) Beautiful Landscape (Holistic, Subjective)
(d) Cute Baby (Localized, Subjective)
Figure 1: Four Adjective Noun Pair samples illustrating the spectrum of objective vs. subjective ANPs and hollistic vs.
localizable ANPs. Under each ANP are their ground truths in the following order from left to right: disagreement, agreement
and combination of user-agreement and user-disagreement. The reason why not all ground truths are indicating any eye-gaze
data is because in this case no participant agreed with this ANP. For example the disagreement image for beautiful landscape
doesn’t show any eye-gazes because no participant disagreed with this landscape being beautiful.
4 COMPARISON METRICS
In the literature, there are a large number of per-
formance evaluation metrics proposed for comparing
structures like heatmaps. These comparison metrics
are briefly described here as follows:
• Simple Difference based Comparison (SD): As
the first comparison method we used a simple dif-
ference method. In detail, we first applied the dif-
ferent saliency techniques to the images and bina-
rized the result as well as the ground truth, where
intensity value ’1’ means high saliency/attention
and ’0’ means no saliency/attention. The binariza-
tion was done in an global approach with a thresh-
old determined by Otsu’s method(Otsu, 1975).
After that we substracted the ground truth from
the resulting map. From this result we summed up
all the absolute values and divided it by a value D,
where D was calculated with counting the pixels
of the binarization where at least the ground truth
or the result were 1. If at a position both images
were 1, this pixel was nevertheless counted once.
Which Saliency Detection Method is the Best to Estimate the Human Attention for Adjective Noun Concepts?
187

It calculates the difference between saliency map
as compared to ground-truth heatmap. In order
to calculate the similarity between them, the re-
sult was negated, which makes it easier to analyze
with other comparison metrics.
• Area under Curve based Comparison (AUC
Judd & AUC Borji): We also used two Area
under Curve methods to compare saliency maps
with the ground truths. The first one is AUC
Judd (Judd et al., 2012) and the second one is
AUC Borji (Borji et al., 2013). As in the first pro-
cedure this was done for a binarization where the
threshold is determined by Otsu’s method.
5 COMPARISON BETWEEN
SALIENCY AND HUMAN GAZE
For each saliency method, we calculated the saliency
maps for each image within each ANP and com-
pared it with the corresponding three different forms
of ground-truth using the different comparison met-
rics which were described in Section 4. Finally all the
results for each ANP and for each different form of
ground-truth were averaged. The results can be seen
in Table 1 for an agreement form of ground-truth, Ta-
ble 2 for a disagreement form of ground-truth, and
Table 3 for an agreement and disagreement combined
form of ground-truth. Highlighted are the best values
corresponding to the winners of each ANP case.
Additionally, figures 2, 3, 4 and 5 are showing the best
and worst saliency detection method for each of the
four ANPs depending on agreement (annotated with
yes), disagreement (annotated with no) and combina-
tion. In the middle the ground truth is shown. In these
Figures, the results of the saliencies were overlayed
with a heatmap. On the right side are the best images
and on the left side the worst ones. The order from
top to bottom is: agreement, disagreement and com-
bination, also the saliency method responsible for this
image is noted.
Furthermore to investigate the impact of binarization
we repeated the above mentioned procedure after bi-
narizing each of the saliency maps and ground truths.
The results can be seen in Table 4 for agreement form
of ground-truth, Table 5 for disagreement form of
ground-truth, and Table 6 for agreement and disagree-
ment combined form of ground-truth.
Lastly we investigated if a combination of two
saliency detection techniques can further improve the
current results. We experimented by combining a pair
of saliency methods corresponding to two different
saliency detection methods. All possible combina-
tions of ten different saliency detection methods were
tried out.
The combination of two ground truth images was
achieved in two different ways resulting in two dif-
ferent results. First we used the union to combine
them, meaning that if a single pixel in one of the two
maps was marked, the same pixel was marked in the
resulting map. For the other combination we used the
intersection, meaning that a pixel in the result will
only be marked if the same pixel is marked in both
saliency maps. The results for the union combination
can be seen in Table 7. Table 8 represents the inter-
section combination. These results were only calcu-
lated by the AUC Judd method. Results are shown for
the combination of the methods GBVS(M4), Itti(M5)
and Saliency detection method by combining simple
Priors(M10). We decided to show only the results
of these three methods because showing all possible
combinations and their results would be simply too
many entries for the scope of this paper. The decision
of which combinations are shown is based on the re-
sults of Table 1 to 6 where these methods belong to
the best. Furthermore the combinations of these three
methods also belong to the best overall compared to
the other possible combinations.
6 DISCUSSION
In this paper we investigated ten different saliency de-
tection methods as compared to human gaze behavior
as ground-truths to find out if there are saliency de-
tection methods capable of recreating the human gaze
behavior for different ANPs.
We determined that overall of the ten different
saliency detection methods, a clear best method could
not emerge. There are some trends like the saliency
detection method by combining simple priors(M10)
being quite good in the agreement case or Itti(M5)
being good for the ANP damaged building.
Another interesting observation, is that Attention
Simple Global Rarity(M1) scores consistently best
according to the simple difference method, but be-
longs to the worst according to both AUC methods.
We conclude that some evaluation metrics may fa-
vor certain circumstances. Therefore we need to ex-
pand our experiment for future research and include
more evaluation metrics to provide a fair result for all
saliency detection methods.
Contrary to the earlier results, the binarized environ-
ment favors GBVS(M4) which now emerges as the
best method to recreate the human gaze for all ANPs
including three different forms of ground-truths, i.e.
agreement, disagreement and both agreement and dis-
ICAART 2017 - 9th International Conference on Agents and Artificial Intelligence
188

agreement combined. We think that GBVS scores
that good, because of its graph based approach which
may correlate to human eye movements. Therefore
the question how binarization can positively affect
saliency detection methods poses to be interesting and
needs to be investigated.
Unfortunately a combination of two saliency methods
didn’t yield much improvements. Nevertheless the
combinations containing GBVS(M4) often resulted in
the best scores.
These results are very interesting and can be used for
many different applications, such as developing a bet-
ter sentiment classifier for ANPs using salient regions
for feature extractions.
REFERENCES
Al-Naser, M., Chanijani, S. S. M., Bukhari, S. S., Borth,
D., and Dengel, A. (2015). What makes a beautiful
landscape beautiful: Adjective noun pairs attention by
eye-tracking and gaze analysis. In Proceedings of the
1st International Workshop on Affect & Sentiment in
Multimedia, pages 51–56. ACM.
Borji, A., Sihite, D. N., and Itti, L. (2013). Quantitative
analysis of human-model agreement in visual saliency
modeling: a comparative study. IEEE Transactions on
Image Processing, 22(1):55–69.
Borth, D., Ji, R., Chen, T., Breuel, T., and Chang, S.-F.
(2013). Large-scale visual sentiment ontology and de-
tectors using adjective noun pairs. In Proceedings of
the 21st ACM international conference on Multime-
dia, pages 223–232. ACM.
Fang, Y., Chen, Z., Lin, W., and Lin, C.-W. (2011).
Saliency-based image retargeting in the compressed
domain. In Proceedings of the 19th ACM international
conference on Multimedia, pages 1049–1052. ACM.
Goferman, S., Zelnik-manor, L., and Tal, A. (2010).
Context-aware saliency detection. In in [IEEE Conf.
on Computer Vision and Pattern Recognition.
Harel, J., Koch, C., and Perona, P. (2006). Graph-based vi-
sual saliency. In Advances in neural information pro-
cessing systems, pages 545–552.
Itti, L. and Koch, C. (2000). A saliency-based search mech-
anism for overt and covert shifts of visual attention.
Vision research, 40(10):1489–1506.
Judd, T., Durand, F., and Torralba, A. (2012). A benchmark
of computational models of saliency to predict human
fixations.
Mancas, M. (2009). Relative influence of bottom-up and
top-down attention, attention in cognitive systems: 5th
international workshop on attention in cognitive sys-
tems, wapcv 2008 fira, santorini, greece, may 12, 2008
revised selected papers.
Mancas, M., Couvreur, L., Gosselin, B., Macq, B., et al.
(2007). Computational attention for event detection.
In Proc. Fifth Intl Conf. Computer Vision Systems.
Mancas, M., Mancas-Thillou, C., Gosselin, B., and Macq,
B. (2006). A rarity-based visual attention map - ap-
plication to texture description. In 2006 International
Conference on Image Processing, pages 445–448.
Otsu, N. (1975). A threshold selection method from gray-
level histograms. Automatica, 11(285-296):23–27.
Riche, N., Mancas, M., Duvinage, M., Mibulumukini, M.,
Gosselin, B., and Dutoit, T. (2013). Rare2012: A
multi-scale rarity-based saliency detection with its
comparative statistical analysis. Signal Processing:
Image Communication, 28(6):642–658.
Vikram, T. N., Tscherepanow, M., and Wrede, B. (2011).
A random center surround bottom up visual attention
model useful for salient region detection. In Applica-
tions of Computer Vision (WACV), 2011 IEEE Work-
shop on, pages 166–173. IEEE.
Zhang, L., Gu, Z., and Li, H. (2013). Sdsp: A novel saliency
detection method by combining simple priors. In 2013
IEEE International Conference on Image Processing,
pages 171–175. IEEE.
Which Saliency Detection Method is the Best to Estimate the Human Attention for Adjective Noun Concepts?
189
APPENDIX
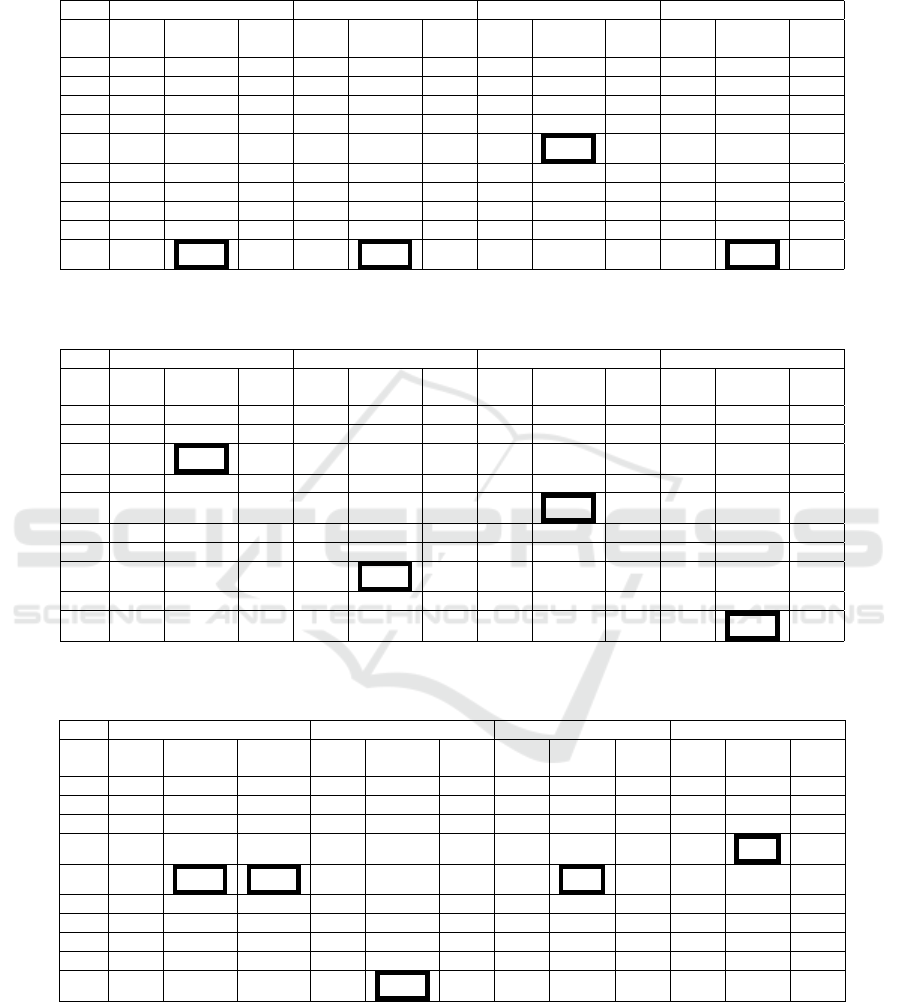
Table 1: Comparison between Agreement-Yes form of ground-truth and each saliency method and using different comparison
metrics. (Note: Close to 1 is the best match).
Beautiful Landscape Cute Baby Damaged Building Stormy Landscape
SD
AUC
Judd
AUC
Borji
SD
AUC
Judd
AUC
Borji
SD
AUC
Judd
AUC
Borji
SD
AUC
Judd
AUC
Borji
M1 0.052 0.503 0.504 0.017 0.5 0.499 0.024 0.501 0.5 0.017 0.512 0.512
M2 0.03 0.513 0.514 0.009 0.51 0.509 0.007 0.519 0.519 0.013 0.528 0.528
M3 0.008 0.612 0.613 0.003 0.571 0.57 0.003 0.61 0.608 0.004 0.606 0.605
M4 0.008 0.665 0.664 0.005 0.593 0.592 0.003 0.725 0.723 0.003 0.668 0.666
M5 0.007 0.648 0.649 0.004 0.597 0.595 0.002 0.757 0.755 0.002 0.63 0.629
M6 0.015 0.648 0.648 0.007 0.554 0.554 0.007 0.598 0.597 0.004 0.637 0.636
M7 0.033 0.517 0.516 0.007 0.512 0.511 0.01 0.506 0.507 0.008 0.532 0.532
M8 0.017 0.537 0.538 0.004 0.642 0.64 0.005 0.612 0.612 0.004 0.582 0.582
M9 0.013 0.613 0.609 0.004 0.586 0.584 0.002 0.569 0.57 0.003 0.644 0.642
M10 0.011 0.678 0.676 0.003 0.708 0.706 0.003 0.594 0.592 0.003 0.687 0.686
Table 2: Comparison between Disagreement-No form of ground-truth and each saliency method and using different compar-
ison metrics. (Note: Close to 1 is the best match).
Beautiful Landscape Cute Baby Damaged Building Stormy Landscape
SD
AUC
Judd
AUC
Borji
SD
AUC
Judd
AUC
Borji
SD
AUC
Judd
AUC
Borji
SD
AUC
Judd
AUC
Borji
M1 0.045 0.503 0.502 0.022 0.504 0.504 0.019 0.509 0.507 0.017 0.504 0.501
M2 0.03 0.552 0.549 0.009 0.533 0.532 0.006 0.502 0.502 0.011 0.509 0.509
M3 0.007 0.775 0.774 0.003 0.578 0.577 0.004 0.554 0.554 0.003 0.556 0.556
M4 0.006 0.728 0.727 0.009 0.62 0.62 0.004 0.573 0.571 0.003 0.657 0.657
M5 0.007 0.735 0.732 0.005 0.635 0.634 0.001 0.723 0.721 0.002 0.506 0.507
M6 0.019 0.602 0.599 0.009 0.553 0.552 0.007 0.5 0.499 0.004 0.644 0.643
M7 0.028 0.514 0.512 0.009 0.531 0.533 0.007 0.518 0.517 0.008 0.507 0.507
M8 0.018 0.564 0.56 0.003 0.647 0.646 0.003 0.603 0.599 0.003 0.542 0.542
M9 0.014 0.536 0.539 0.006 0.532 0.53 0.001 0.503 0.503 0.003 0.532 0.531
M10 0.012 0.586 0.587 0.003 0.604 0.604 0.003 0.506 0.508 0.002 0.707 0.705
Table 3: Comparison between Combined (Agreement-Yes and Disagreement-No) form of ground-truth and each saliency
method and using different comparison metrics. (Note: Close to 1 is the best match).
Beautiful Landscape Cute Baby Damaged Building Stormy Landscape
SD
AUC
Judd
AUC
Borji
SD
AUC
Judd
AUC
Borji
SD
AUC
Judd
AUC
Borji
SD
AUC
Judd
AUC
Borji
M1 0.048 0.502 0.504 0.018 0.499 0.5 0.022 0.501 0.501 0.017 0.512 0.512
M2 0.029 0.525 0.524 0.009 0.515 0.515 0.007 0.521 0.52 0.013 0.534 0.534
M3 0.008 0.647 0.648 0.003 0.571 0.57 0.003 0.616 0.615 0.004 0.627 0.626
M4 0.008 0.667 0.665 0.006 0.604 0.603 0.003 0.746 0.743 0.003 0.71 0.707
M5 0.007 0.673 0.673 0.004 0.61 0.61 0.002 0.79 0.786 0.002 0.636 0.634
M6 0.016 0.639 0.637 0.007 0.561 0.559 0.006 0.59 0.589 0.005 0.651 0.649
M7 0.033 0.515 0.516 0.007 0.516 0.515 0.01 0.512 0.511 0.008 0.531 0.531
M8 0.017 0.535 0.536 0.004 0.647 0.645 0.005 0.615 0.616 0.004 0.601 6
M9 0.013 0.583 0.584 0.004 0.581 0.579 0.002 0.569 0.57 0.003 0.643 0.642
M10 0.011 0.64 0.638 0.003 0.706 0.704 0.003 0.588 0.588 0.003 0.709 0.707
ICAART 2017 - 9th International Conference on Agents and Artificial Intelligence
190
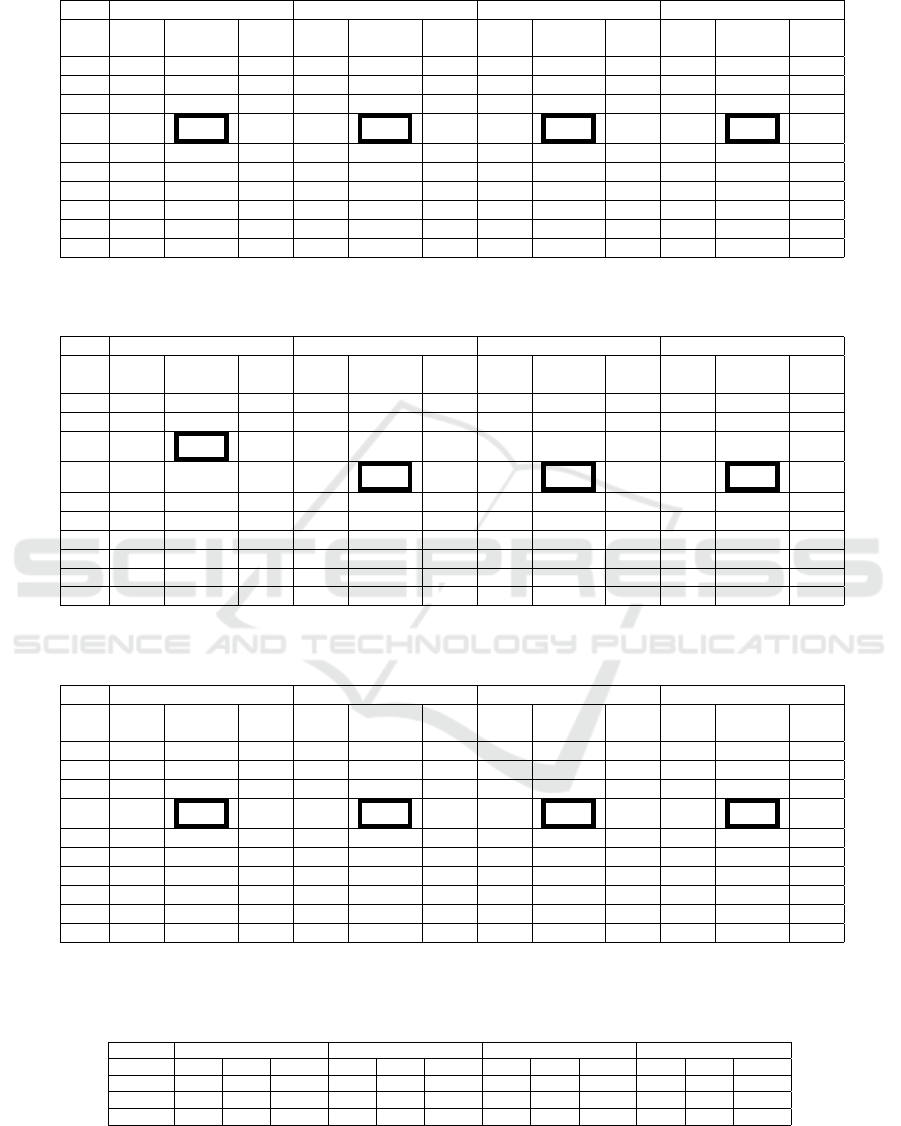
Table 4: Comparison between Agreement-Yes form of ground-truth and each saliency method and using different comparison
metrics in a binarized environment. (Note: Close to 1 is the best match).
Beautiful Landscape Cute Baby Damaged Building Stormy Landscape
SD
AUC
Judd
AUC
Borji
SD
AUC
Judd
AUC
Borji
SD
AUC
Judd
AUC
Borji
SD
AUC
Judd
AUC
Borji
M1 0.039 0.574 0.572 0.028 0.536 0.536 0.039 0.571 0.569 0.052 0.606 0.602
M2 0.045 0.603 0.599 0.023 0.523 0.521 0.05 0.618 0.614 0.05 0.565 0.563
M3 0.069 0.705 0.7 0.042 0.607 0.605 0.065 0.689 0.683 0.07 0.615 0.611
M4 0.07 0.783 0.775 0.053 0.785 0.778 0.091 0.756 0.749 0.081 0.709 0.702
M5 0.068 0.752 0.746 0.04 0.619 0.616 0.063 0.752 0.745 0.062 0.635 0.632
M6 0.067 0.748 0.742 0.046 0.677 0.673 0.066 0.717 0.711 0.091 0.681 0.674
M7 0.036 0.587 0.585 0.032 0.604 0.602 0.035 0.56 0.559 0.051 0.641 0.636
M8 0.066 0.669 0.664 0.076 0.725 0.72 0.063 0.667 0.663 0.072 0.651 0.646
M9 0.067 0.726 0.72 0.05 0.732 0.728 0.048 0.617 0.614 0.071 0.673 0.667
M10 0.059 0.711 0.704 0.058 0.756 0.751 0.051 0.631 0.628 0.92 0.694 0.687
Table 5: Comparison between Disagreement-No form of ground-truth and each saliency method and using different compar-
ison metrics in a binarized environment. (Note: Close to 1 is the best match).
Beautiful Landscape Cute Baby Damaged Building Stormy Landscape
SD
AUC
Judd
AUC
Borji
SD
AUC
Judd
AUC
Borji
SD
AUC
Judd
AUC
Borji
SD
AUC
Judd
AUC
Borji
M1 0.046 0.613 0.609 0.033 0.568 0.567 0.028 0.519 0.518 0.057 0.602 0.599
M2 0.053 0.624 0.622 0.028 0.529 0.528 0.024 0.517 0.516 0.062 0.604 0.601
M3 0.071 0.753 0.747 0.03 0.533 0.532 0.04 0.593 0.591 0.045 0.554 0.553
M4 0.068 0.735 0.728 0.049 0.708 0.703 0.104 0.744 0.737 0.078 0.739 0.732
M5 0.073 0.751 0.745 0.05 0.601 0.598 0.054 0.742 0.735 0.057 0.597 0.595
M6 0.068 0.685 0.678 0.045 0.667 0.664 0.041 0.587 0.584 0.092 0.736 0.728
M7 0.044 0.65 0.646 0.035 0.628 0.626 0.026 0.495 0.495 0.056 0.632 0.628
M8 0.083 0.735 0.729 0.052 0.663 0.661 0.074 0.727 0.721 0.07 0.668 0.663
M9 0.056 0.645 0.641 0.045 0.668 0.663 0.031 0.535 0.534 0.069 0.677 0.67
M10 0.052 0.599 0.595 0.05 0.691 0.688 0.043 0.584 0.58 0.084 0.717 0.709
Table 6: Comparison between Combined (Agreement-Yes and Disagreement-No) form of ground-truth and each saliency
method and using different comparison metrics in a binarized environment. (Note: Close to 1 is the best match).
Beautiful Landscape Cute Baby Damaged Building Stormy Landscape
SD
AUC
Judd
AUC
Borji
SD
AUC
Judd
AUC
Borji
SD
AUC
Judd
AUC
Borji
SD
AUC
Judd
AUC
Borji
M1 0.047 0.57 0.566 0.028 0.536 0.536 0.04 0.567 0.566 0.06 0.616 0.612
M2 0.052 0.6 0.597 0.024 0.52 0.52 0.051 0.612 0.609 0.058 0.578 0.575
M3 0.08 0.702 0.696 0.042 0.606 0.603 0.066 0.688 0.682 0.075 0.616 0.612
M4 0.084 0.789 0.78 0.053 0.786 0.779 0.1 0.778 0.769 0.087 0.723 0.715
M5 0.078 0.739 0.732 0.041 0.619 0.616 0.07 0.764 0.755 0.069 0.632 0.628
M6 0.08 0.733 0.726 0.046 0.68 0.676 0.072 0.721 0.714 0.102 0.704 0.697
M7 0.044 0.586 0.583 0.032 0.606 0.604 0.038 0.56 0.558 0.06 0.66 0.655
M8 0.078 0.666 0.661 0.075 0.725 0.72 0.066 0.673 0.669 0.081 0.674 0.669
M9 0.076 0.713 0.705 0.049 0.732 0.727 0.05 0.623 0.62 0.079 0.681 0.675
M10 0.067 0.693 0.688 0.056 0.753 0.749 0.057 0.642 0.638 0.097 0.707 0.7
Table 7: Comparison between Agreement-Yes, Disagreement-No, Combined (Agreement-Yes and Disagreement-No)
form of ground-truth and three union combination of saliency methods which generally belong to the best. Lastly AUC Judd
was used. (Note: Close to 1 is the best match).
Beautiful Landscape Cute Baby Damaged Building Stormy Landscape
Yes No Yes/No Yes No Yes/No Yes No Yes/No Yes No Yes/No
M4 M5 0.773 0.767 0.76 0.76 0.76 0.715 0.732 0.723 0.718 0.68 0.662 0.7
M4 M10 0.78 0.776 0.757 0.785 0.785 0.76 0.746 0.736 0.7 0.744 0.721 0.769
M5 M10 0.76 0.754 0.75 0.764 0.758 0.74 0.718 0.71 0.689 0.682 0.661 0.707
Which Saliency Detection Method is the Best to Estimate the Human Attention for Adjective Noun Concepts?
191
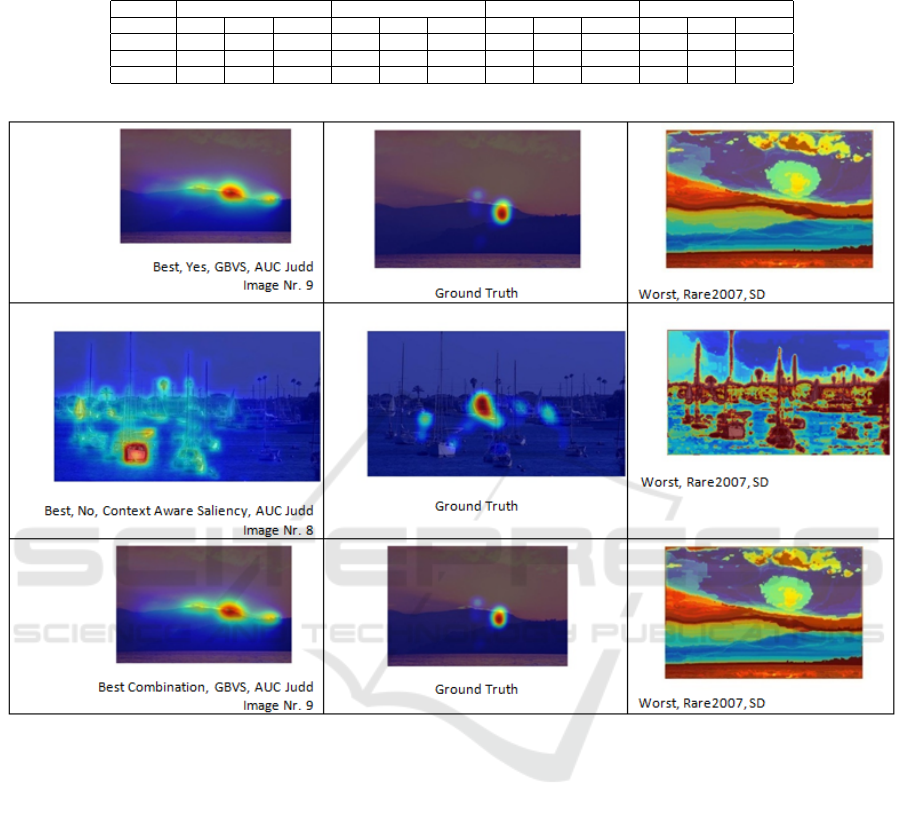
Table 8: Comparison between Agreement-Yes, Disagreement-No, Combined (Agreement-Yes and Disagreement-No)
form of ground-truth and three intersection combination of saliency methods which generally belong to the best. Lastly AUC
Judd was used. (Note: Close to 1 is the best match).
Beautiful Landscape Cute Baby Damaged Building Stormy Landscape
Yes No Yes/No Yes No Yes/No Yes No Yes/No Yes No Yes/No
M4 M5 0.765 0.756 0.737 0.655 0.652 0.624 0.772 0.763 0.691 0.626 0.624 0.634
M4 M10 0.775 0.773 0.744 0.8 0.8 0.713 0.705 0.692 0.617 0.691 0.672 0.727
M5 M10 0.757 0.749 0.726 0.66 0.655 0.613 0.739 0.726 0.689 0.6 0.596 0.615
Figure 2: Beautiful Landscape: Examples showing the best (left) and the worst (right) saliency detection methods as com-
pared to the ground-truth (middle) human attention map for different sample images with different user responses (Aggrement-
Yes, Disagreement-No, and Combination of both Aggrement-Yes and Disagreement-No).
ICAART 2017 - 9th International Conference on Agents and Artificial Intelligence
192
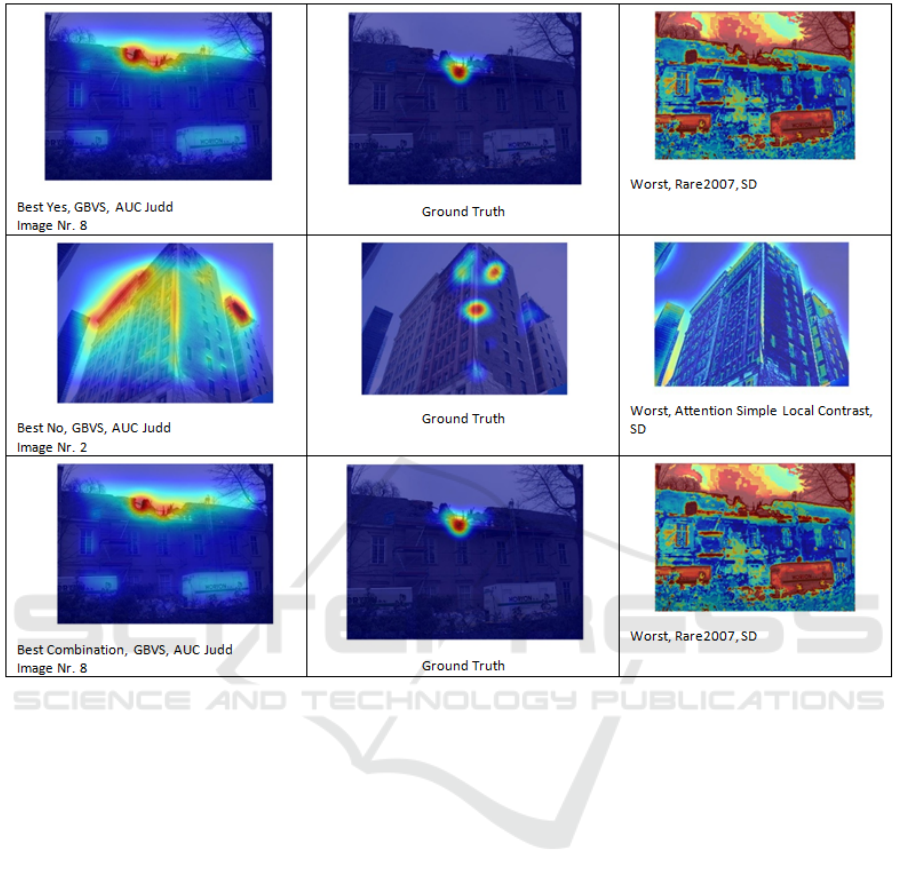
Figure 3: Damaged Building: Examples showing best (left) and worst (right) saliency detection methods as compared
to ground-truth (middle) human attention map for different sample images with different user responses (Aggrement-Yes,
Disagreement-No, and Combination of both Aggrement-Yes and Disagreement-No).
Which Saliency Detection Method is the Best to Estimate the Human Attention for Adjective Noun Concepts?
193
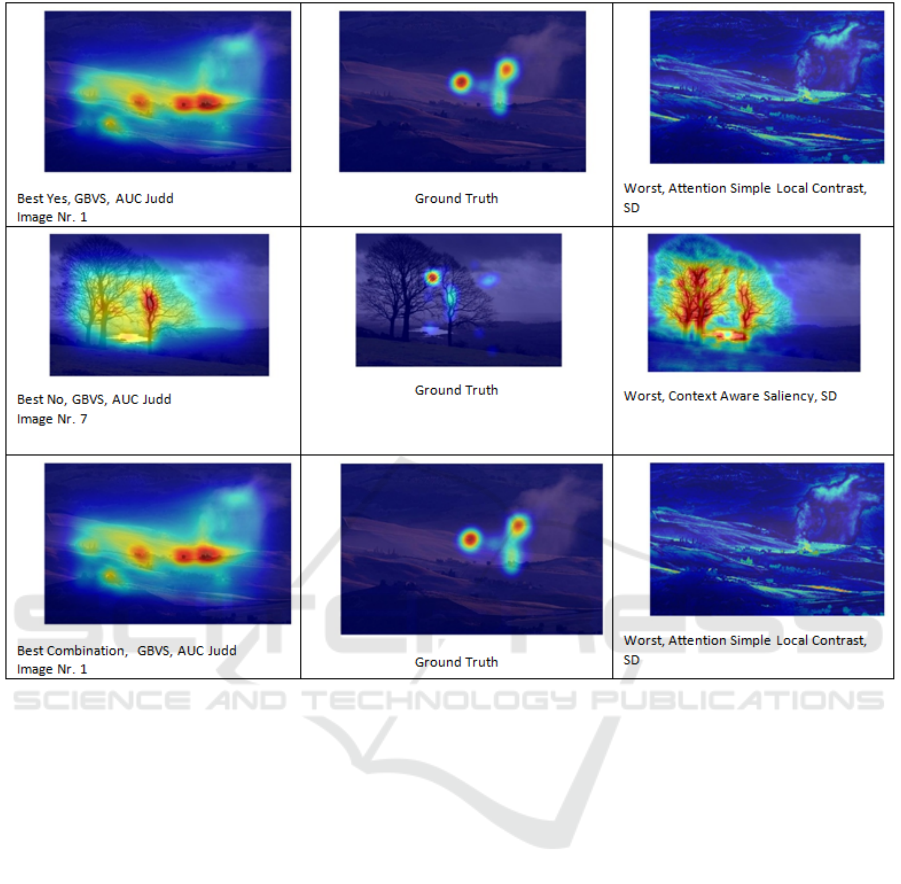
Figure 4: Stormy Landscape: Examples showing best (left) and worst (right) saliency detection methods as compared to
ground-truth (middle) human attention map for different sample images from Stormy Landscape with different user responses
(Aggrement-Yes, Disagreement-No, and Combination of both Aggrement-Yes and Disagreement-No).
ICAART 2017 - 9th International Conference on Agents and Artificial Intelligence
194
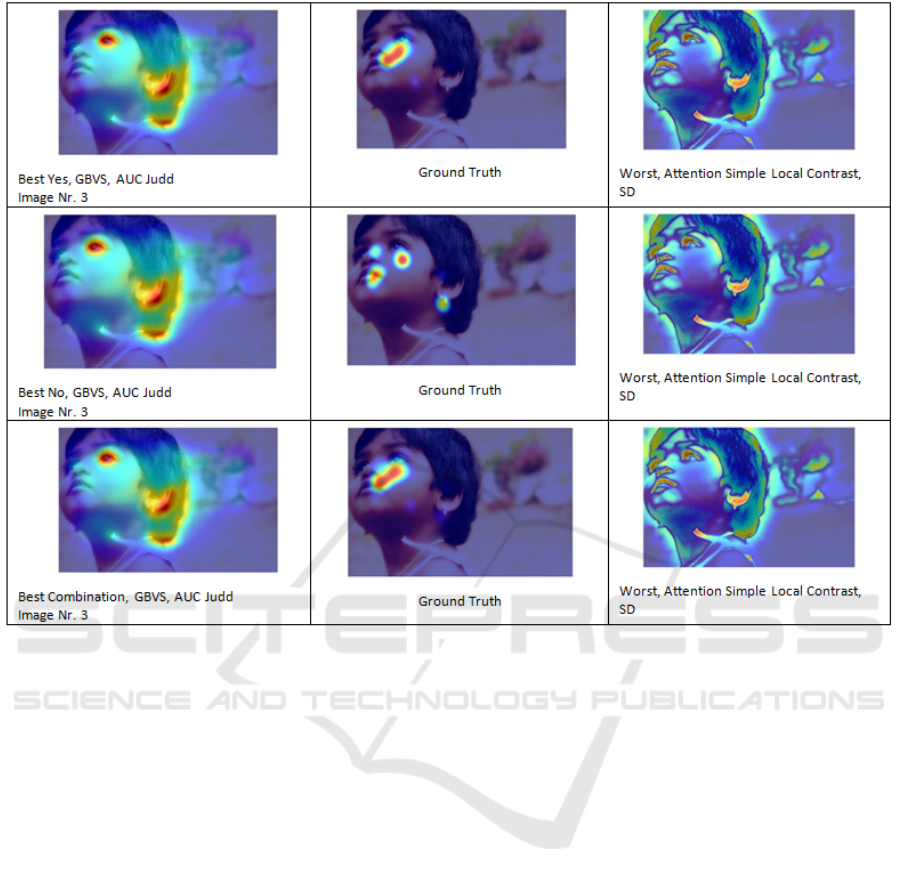
Figure 5: Cute Baby: Examples showing best (left) and worst (right) saliency detection methods as compared to ground-truth
(middle) human attention map for different sample images with different user responses (Aggrement-Yes, Disagreement-No,
and Combination of both Aggrement-Yes and Disagreement-No).
Which Saliency Detection Method is the Best to Estimate the Human Attention for Adjective Noun Concepts?
195
