
An Off-line Evaluation of Users’ Ranking Metrics
in Group Recommendation
Silvia Rossi
1
, Francesco Cervone
1
and Francesco Barile
2
1
Dipartimento di Ingegneria Elettrica e delle Tecnologie dell’Informazione,
Universit
`
a degli Studi di Napoli Federico II, Napoli, Italy
2
Dipartimento di Matematica e Applicazioni, Universit
`
a degli Studi di Napoli Federico II, Napoli, Italy
Keywords:
Group Recommendations, Weighted Utilities, Off-line Testing.
Abstract:
One of the major issue in designing group recommendation techniques relates to the difficulty of the evaluation
process. Up-today, no freely available dataset exists that contains information about groups, like, for example,
the group’s choices or social aspects that may characterize the group’s members. The objective of the paper
is to analyze the possibility to make an evaluation of ranking-based groups recommendation techniques by
using offline testing. Typically, the evaluation of group recommendations is computed, as in the classical
single user case, by comparing the predicted group’s ratings with respect to the single users’ ratings. Since the
information contained in the datasets are mainly such user’s ratings, here, ratings are used to define different
ranking metrics. Results suggest that such an attempt is hardly feasible. Performance seems not to be affected
by the choice of ranking technique, except for some particular cases. This could be due to the averaging effect
of the evaluation with respect to the single users’ ratings, so a deeper analysis or specific dataset are necessary.
1 INTRODUCTION
Group recommendation systems (GRSs) aim to re-
commend items or activities in domains where it is
expected that more than a person will participate in
the suggested activity. Examples include the choice
of a restaurant, a vacation package or a movie to wa-
tch (Rossi et al., 2016). Recently, several interesting
approaches to group recommendation have been pro-
posed in literature (Amer-Yahia et al., 2009; Baltru-
nas et al., 2010; Berkovsky and Freyne, 2010; Gar-
trell et al., 2010; O’Connor et al., 2001; Pera and Ng,
2013; Rossi and Cervone, 2016), and most of these
studies are based on collaborative filtering, employing
some aggregation strategies (Masthoff, 2011).
One of the major issue in this research area re-
lates to the difficulty of evaluating the effectiveness
of group recommendations, i.e., comparing the ge-
nerated recommendations for a group with the true
preferences of the individual members. One gene-
ral approach for such an evaluation consists in in-
terviewing real users. However, on-line evaluations
can be performed on a very limited set of test cases
and cannot be used to extensively test alternative al-
gorithms. A second approach consists in performing
off-line evaluations, but up today, no freely available
dataset exists that consider groups choices. Hence,
when evaluating group recommendations, such evalu-
ation is computed, as in the classical single user case,
by comparing the predicted group ratings with the ra-
tings observed in the test set of the users. As shown
in (Baltrunas et al., 2010), the most popular datasets
(e.g. Movielens or Netflix) that contain just evaluati-
ons of individual users can be used to evaluate GRS.
Moreover, the simple aggregation of the indivi-
dual preferences cannot always lead to a good result.
Groups can be dynamic, and so the behavior of the
various members in different situations. For example,
the users’ personality, the relationships between them
and their experience in the domain of interest can be
decisive in the group decision phase. When aggrega-
ting the data of individual users, it is natural to allow
for some users to have more influence than others, so
considering a users’ ranking in the aggregation pro-
cess. Anyway, in order to keep the possibility of an
offline evaluation for a GRS, it is necessary to design
techniques for user rankings based on the available
information in a dataset. Since the information con-
tained in the datasets are mainly the user’s preferences
or the ratings that they gave to the various items, the
idea, here, is to use such preferences to define diffe-
rent ranking metrics.
252
Rossi S., Cervone F. and Barile F.
An Off-line Evaluation of Usersâ
˘
A
´
Z Ranking Metrics in Group Recommendation.
DOI: 10.5220/0006200702520259
In Proceedings of the 9th International Conference on Agents and Artificial Intelligence (ICAART 2017), pages 252-259
ISBN: 978-989-758-219-6
Copyright
c
2017 by SCITEPRESS – Science and Technology Publications, Lda. All rights reserved

In this paper, starting from the generation of synt-
hetic groups (with various criteria), different ranking
aggregation methods and two aggregation strategies
are used to generate group recommendations. We eva-
luate how good this integrated ranking is, with respect
to the individual ratings contained in the users’ pro-
file (without any ranking process). We performed an
analysis of the generated group recommendations via
ranking varying the size of the groups, the inner group
members similarity, and the rank aggregation mecha-
nism.
The aim of the paper is to evaluate whether or not
the ranking mechanisms may have an impact on the
goodness of GRSs and whether this can be evaluated
in off-line testing. The first results show that this kind
of evaluation is not very simple, and it seems not to
provide significant information. Indeed, a more deep
analysis shows some correlation between the charac-
teristics of the groups and the evaluation of the re-
commendations. This suggests extending the analysis
crossing the data and evaluating the impact of each
ranking technique with respect to the internal charac-
teristics of each group.
2 RELATED WORKS
Typically, GRSs are obtained by merging the single
users’ profiles in order to obtain a preferences pro-
file for the whole group, and then, by using a sin-
gle user recommendation system on this virtual pro-
file to obtain the recommendations for the group.
On the contrary, a second approach relies on firstly
using a single user recommendation system on each
user’s profile and merging these recommendations
using some group decision strategy (Masthoff, 2011).
In both cases, there is the problem to decide how to
combine preferences or recommendations.
Only few approaches considered that the decisions
taken within a group are influenced by many factors,
not only by the individual user preferences. PolyLens
(O’Connor et al., 2001) has been one of the first ap-
proaches to include social characteristics (such as the
nature of a group, the rights of group members, and
social value functions for groups) within the group
recommendation process. Also in (Ardissono et al.,
2003), intra-group roles, such as children and the di-
sabled were contemplated; each group is subdivided
into homogeneous subgroups of similar members that
fit a stereotype, and recommendations are predicted
for each subgroup and an overall preference is built
considering some subgroups more influential than ot-
hers.
The results on group recommendation, presented
in the literature, showed that there is no strategy that
can be defined as the “best”, but different approa-
ches are better suited in different scenarios, depen-
ding from the characteristics of the specific group
(Masthoff, 2011). Besides, traditional aggregation
techniques do not seem to capture the features of real-
world scenarios, as, for example, the possibility of
weighting/ranking the users in the group in order to
compute the recommendation. On the contrary, in
(Gartrell et al., 2010), the authors started to evalu-
ate the group members’ weights, in terms of their
influence in a group relying on the concept of “ex-
pertise” (how many items they rated on a set of 100
popular movies) and “group dissimilarity” (a pair-
wise dissimilarity on ratings), and selecting a diffe-
rent aggregation function starting from a “social va-
lue” (that models the intra-group relationships) deri-
ved from questionnaires. The proposed approach was
tested on real groups and not on a dataset. In (Amer-
Yahia et al., 2009), the authors propose to use the
disagreement among users’ ratings to implement an
efficient group recommendation algorithm. In (Ber-
kovsky and Freyne, 2010), an approach that provi-
des group recommendations with explicit relations-
hips within a family is proposed, investigating four
different models for weighting user data, related to
user’s function within a family or on the observed user
interactions. In (Rossi et al., 2015), the authors aimed
at identifying dominant users within a group by analy-
zing users’ interactions on social networks since their
opinions influence the group decision. The authors
developed a model weighed for group recommendati-
ons that calculates the leadership among users using
their popularity as a measure, and evaluated the sy-
stem with real users.
Finally, concerning the problem of group recom-
mendation evaluation, in the work of (Baltrunas et al.,
2010), the authors analyzes the effectiveness of group
recommendations obtained aggregating the individual
lists of recommendations produced by a collaborative
filtering system. It is observed that the effectiveness
of a group recommendation does not necessarily de-
crease when the group size grows. Moreover, when
individual recommendations are not effective a user
could obtain better suggestions looking at the group
recommendations. Finally, it is shown that the more
alike the users in the group are, the more effective the
group recommendations are.
An Off-line Evaluation of Usersâ
˘
A
´
Z Ranking Metrics in Group Recommendation
253

3 RANKING-BASED
AGGREGATIONS
We decide to use the merging recommendations
technique to generate groups recommendations. Ge-
nerally speaking, the aim of a Recommendation Sy-
stem (RS) is to predict the relevance and the impor-
tance of items (for example movies, restaurants and
so on) that the user never evaluated. More formally,
given a set U of n users and a set I of m items, the
RS aims at building, for each user u ∈ U, a Rating
Profile
u
over the complete set I, starting from some
ratings each user explicitly provides on a subset of
items (Rossi et al., 2017). We denote as r
u,i
∈ R the
rating given by the user u on an item i. Furthermore,
we denote as U
i
the set of users who explicitly evalu-
ated the item i and with I
u
the set of items evaluated
by the user u.
Once is evaluated a rating profile
u
for each user
u ∈ U, the goal of a GRS is to obtain, given a group
of users G ⊂ U, a rating profile for the whole group
G
= {r
G,1
, . .. , r
G,m
}, where r
G,i
is the correspondent
ranking for the movie i as evaluated for the group.
Typically, this is obtained by implementing a social
choice function SC :
n
→
G
, that aggregates all the
ratings profiles in
G
= {r
G,1
, . . . , r
G,m
}.
3.1 Ranking Metrics
To obtain an offline evaluation based on a specific da-
taset, we must define users’ ranking metrics starting
from the available data. We decided to use the Mo-
vieTweetings dataset (Dooms et al., 2013), that con-
tains movie ratings derived from tweets on the Twit-
ter.com social network. So, the information available
are mainly related to the individual preferences (i.e.,
users’ rating profiles). Here, we identify four diffe-
rent ranking metrics. We will, then, use these me-
trics to obtain two different aggregation strategies, na-
mely, a Weighted Average Satisfaction (WAS), and a
Fairness-based algorithm (FAIR). These two techni-
ques will be evaluated with respect to two bench-
mark strategies: Least Misery (LM) and Average Sa-
tisfaction (AS).
3.1.1 Experience
The first metric is inspired by the work of (Gartrell
et al., 2010), and it aims at giving a higher rank to
the users with respect to their experience, quantified
in the number of provided ratings. Hence, the score
assigned to each user is given by his experience de-
gree, and is computed on the number of his ratings in
the system, in this way:
w
u
= |I
u
| (1)
Since the computed weight is an integer greater
or equal to 0, the ranking is considered in descending
order.
3.1.2 Popularity
It can also be interesting to assess the popularity of
a user. We define a popular user if he/she evaluated
popular movies that are rated by many. Hence, in this
ranking strategy, the score of each user is given by the
sum of the number of users that evaluated each movie
the considered user evaluates too, as in the following
formula:
w
u
=
∑
i∈I
u
|U
i
| (2)
In this case, the evaluated weight is an integer gre-
ater or equal to 0. As in the previous case, greater is
the score, greater will be the position of the user in the
ranking.
3.1.3 Total Distance
In this case, the weight of a user is computed on how
its ratings deviate from their average in the whole da-
taset. Therefore, it is given by the standard deviation
between his ratings and the average values, as follow:
ˆw
u
=
s
∑
i∈I
u
(r
u,i
− avg(i))
2
|I
u
|
(3)
where avg(i) is the average rating for the movie i
on the whole dataset. Differently from the previous
techniques, the ranking ordering is ascending with re-
spect to the scores because this value represents the
distance from the total average. Hence, if a user has a
great deviation from this average, he/she must have a
smaller influence on the final decision. To align with
respect to the other techniques we inverted the obtai-
ned values.
Since ˆw
u
is the standard deviation between rating
pairs, the maximum value that it could have is the dif-
ference between the maximum rating r
max
and the mi-
nimum r
min
in the dataset. Therefore, we compute the
scores as in the following formula:
w
u
= (r
max
− r
min
) − ˆw
u
(4)
In this way, greater is the score w
u
of a user, smal-
ler will be the distance of his/her ratings with respect
to the average ratings in the dataset.
ICAART 2017 - 9th International Conference on Agents and Artificial Intelligence
254

Table 1: Test results for individual recommendation
algorithms item-based.
precision@10 recall@10 nDCG
Cosine 8.394E-5 1.119E-4 7.500E-5
Pearson 2.518E-4 3.637E-4 3.022E-4
Euclidean 8.394E-5 1.119E-4 7.399E-5
Tanimoto 8.394E-5 1.119E-4 7.249E-5
City block 7.017E-2 0.117 0.113
Log likelihood 8.394E-5 1.119E-4 6.979E-5
Table 2: Test results for individual recommendation
algorithms user-based.
precision@10 recall@10 nDCG
Cosine 1.119E-4 1.376E-4 1.163E-4
Pearson 4.499E-4 8.117E-4 5.444E-4
Euclidean 1.119E-4 1.337E-4 1.476E-4
Tanimoto 1.399E-4 1.737E-4 1.897E-4
City block 1.567E-3 2.463E-3 2.051E-3
Log likelihood 1.679E-4 2.016E-4 2.095E-4
3.1.4 Group Distance
This last measure is very similar to the previous one
and it is based on the hypothesis that members who
give a rating that is too much different from the
average of the group may leading the RS to choose
a movie that the group will not like at all with a high
probability. The only difference, with respect to the
total distance, is that the average value is computed
using only the group members’ evaluations, as follow:
ˆw
i
=
s
∑
i∈I
u
(r
u,i
− avg
G
(i))
2
|I
u
|
(5)
where avg
G
(i) is the average rating for the movie
i in the group G. Also, in this case, the weights are
reversed in the following way:
w
u
= (r
max
− r
min
) − ˆw
u
(6)
3.1.5 Ranking Normalization
For each ranking technique, we obtain a value that
needs to be normalized, so that the sum of all weights
in a group will be equal to 1. This normalization is
obtained by the following formula:
¯w
u
=
w
u
∑
v∈G
w
v
(7)
For simplicity, we will refer as w
u
indicating ¯w
u
in
the rest of the paper.
3.2 Aggregation Strategies
Since the aim of the paper is not to evaluate the best
strategy to be used in a GRS, but to evaluate whet-
her or not the ranking mechanisms may have an im-
pact on the goodness of a decision and whether this
can be evaluated in off-line testing, we decided to use
two common aggregation strategies, namely a Weig-
hted Average Satisfaction (WAS) and a Fairness stra-
tegy (FAIR), that use the ranking process in a diffe-
rent way. In particular, the WAS treats the rankings
as multiplicative weights in the aggregation process,
while FAIR, that builds the recommendation with an
iterative process on individual users, uses the ranking
to order such users. Moreover, we decided to com-
pare them with two classical aggregation algorithms,
Average Satisfaction (AS), that simply computes the
groups rating averaging on each members ratings, and
Least Misery (LM), that assigns as group rating the
minimum in the group.
The WAS is given by the following equation:
r
G,i
=
∑
u∈G
w
u
· r
u,i
∑
u∈G
w
u
(8)
where w
u
is the weight of the generic user u within
the group.
Instead, the FAIR strategy uses also the same
weights to define a ranking within the group’s mem-
bers. Supposing we want to determine the K-best mo-
vies for the group G, the algorithm proceeds in an ite-
rative way as follows. Starting from the user u with
the highest weight w
u
, in the generic i − th step:
1. the t items with higher values for the user u are
considered (note that the choice of the number t is
not fixed);
2. from these, the item that produces the higher least
misery for the other group’s members is selected;
3. we select the next user in the ranking, if there is
one. If the current user is the last in the ranking,
we select the first one;
4. we repeat from the first step until we have selected
k items.
On the basis of the defined strategies and of
the ranking measures previously specified, we de-
fine the effective strategies evaluated, and the re-
spective acronym, used for simplicity in the rest of
the paper. We use the Least Misery (LM), a not
weighted Average satisfaction strategy (AS), the re-
spective ranking weighted version, Total Distance
(TD-AS), Group Distance (GD-AS), Experience (EX-
AS) and Popularity (P-AS), and, finally, the ran-
ked fairness based strategies, Total Distance Fairness
(TD-FAIR), Group Distance Fairness (GD-FAIR),
Experience Fairness (EX-FAIR) and Popularity Fair-
ness (P-FAIR).
An Off-line Evaluation of Usersâ
˘
A
´
Z Ranking Metrics in Group Recommendation
255

Table 3: F1 and nDCG scores: grouping by ranking strategy.
Ranking Average Total Distance Group Distance Popularity Experience ANOVA (F) p-value
Average F1 0.043 ± 0.021 0.043 ± 0.021 0.043 ± 0.021 0.043 ± 0.021 0.044 ± 0.022 0.022 0.999
Average nDCG 0.626 ± 0.150 0.626 ± 0.150 0.626 ± 0.150 0.625 ± 0.161 0.620 ± 0.161 0.018 0.999
Fairness F1 - 0.037 ± 0.019 0.037 ± 0.019 0.037 ± 0.019 0.037 ± 0.019 0.001 1.000
Fairness nDCG - 0.577 ± 0.176 0.578 ± 0.154 0.588 ± 0.165 0.581 ± 0.159 0.085 0.968
Table 4: F1 evaluation: grouping by aggregation strategy.
Aggregation Average Fairness ANOVA (F) p-value
Total Distance 0.043 ± 0.021 0.037 ± 0.019 4.399 0.037
Group Distance 0.043 ± 0.021 0.037 ± 0.019 4.389 0.038
Popularity 0.043 ± 0.021 0.037 ± 0.019 4.755 0.031
Experience 0.044 ± 0.022 0.037 ± 0.019 5.373 0.022
4 OFFLINE EVALUATION
As stated above, we decide to use the dataset MovieT-
weetings. The dataset does not contain information
about groups, and we decided to automatically ge-
nerate groups in a way that could provide relevant
results. The techniques used for the generation of
groups will be analyzed afterward. Firstly, the genera-
tion of the individual recommendations is illustrated
and then the determination of the group recommenda-
tions is explained. Finally, the group’s generation is
explained; in this step, an ad hoc algorithm is used, in
order to generate groups with different levels of cohe-
sion within the members.
4.1 Individual Recommendations
Since we use the merging recommendations techni-
que, we need to firstly use an individual recommen-
dation system to provide recommendations for each
group’s member. We conduct tests to determine the
most appropriate algorithm to produce these recom-
mendations in order to avoid errors that could be pro-
pagated in the group’s recommendations.
We analyze collaborative filtering strategies, eva-
luating the effectiveness using both the item-based
and the user-based rating prediction, and, for each of
them, we evaluate different distance measures, in or-
der to find the better one. In each test, for each user,
we remove part of the ratings, and then we generate
the individual recommendations; at the end, we com-
pute precision, recall and nDCG on the previously
removed elements. Recall that the Normalized Dis-
counted Cumulative Gain (nDCG) is an evaluation
metric that evaluates the goodness of a recommended
list taking into account the order of the recommenda-
tions.
Tables 1 and 2 contain, respectively, the results for
the item-based and for the user-based strategy, grou-
ped with respect to the distance measure used. We can
notice that the CityBlock has the best results in both
cases, so we decides to use the City block item-based
algorithm.
4.2 Group Recommendations
In order to create the group recommendation, we
should calculate the scores for all the items of the
data set that have not been previously evaluated by
users, and then aggregate those predictions and build
the recommendation list for the group. Since the da-
taset contains tens of thousands of items, this solution
would be computationally inefficient. Hence, we de-
cided to generate the group’s recommendation only
for the k-best movies for each user, with respect to
the ratings evaluated by the individual recommenda-
tion system. Formally, we assume that the group G
is composed by |G| members. For each user u of the
group, we generate a list L
u
of k items to recommend.
Then, we construct the list L
G
of the whole group, by
merging the lists for all the group’s members.
4.3 Groups Generation
We generate groups with different levels of inner co-
hesion. We use the Pearson correlation to deter-
mine the cohesion between two group members, in-
dicated as ρ
XY
(where X and Y are two statistic va-
riables). The value of ρ
XY
is included in the clo-
sed interval [−1, 1], where a value close to 0 indica-
tes that the variables are no correlated, while a value
close to 1 indicates a positive correlation, and simi-
larly a value close to −1 indicates a negative one.
Hence, we distinguish three intervals of correlation,
weak correlation, if 0.1 ≤ ρ
XY
≤ 0.3, moderate cor-
relation, if 0.3 ≤ ρ
XY
≤ 0.7, and strong correlation,
when 0.7 ≤ ρ
XY
≤ 1.
In the specific case, the two variables represent
ICAART 2017 - 9th International Conference on Agents and Artificial Intelligence
256

Table 5: nDCG evaluation: grouping by aggregation strategy.
Aggregation Average Fairness ANOVA (F) p-value
Total Distance 0.626 ± 0.150 0.577 ± 0.176 3.818 0.052
Group Distance 0.626 ± 0.150 0.578 ± 0.154 4.096 0.045
Popularity 0.625 ± 0.161 0.588 ± 0.165 2.074 0.152
Experience 0.620 ± 0.161 0.581 ± 0.159 2.538 0.113
Table 6: F1 evaluation: grouping by correlation.
Correlation Random Weak Moderate Strong ANOVA (F) p-value
AS 0.037 ± 0.006 0.054 ± 0.014 0.054 ± 0.019 0.027 ± 0.026 12.8 < 0.01
EX-AS 0.038 ± 0.007 0.055 ± 0.015 0.055 ± 0.019 0.027 ± 0.027 12.323 < 0.01
EX-FAIR 0.031 ± 0.006 0.046 ± 0.013 0.046 ± 0.017 0.024 ± 0.023 10.371 < 0.01
GD-AS 0.037 ± 0.006 0.055 ± 0.014 0.054 ± 0.019 0.027 ± 0.026 12.853 < 0.01
GD-FAIR 0.031 ± 0.006 0.046 ± 0.013 0.046 ± 0.017 0.024 ± 0.023 10.432 < 0.01
LM 0.037 ± 0.007 0.053 ± 0.015 0.051 ± 0.019 0.028 ± 0.028 8.983 < 0.01
P-AS 0.037 ± 0.007 0.055 ± 0.015 0.054 ± 0.018 0.027 ± 0.027 12.196 < 0.01
P-FAIR 0.031 ± 0.006 0.046 ± 0.013 0.046 ± 0.017 0.024 ± 0.023 10.326 < 0.01
TD-AS 0.037 ± 0.007 0.055 ± 0.014 0.054 ± 0.019 0.027 ± 0.026 12.795 < 0.01
TD-FAIR 0.031 ± 0.006 0.046 ± 0.013 0.046 ± 0.017 0.024 ± 0.023 10.517 < 0.01
two users and are defined as the vector of ratings of
the movies rated by both the users. Starting from
these correlations, we create groups from two to eight
members, and for each dimension, we associate users
with weak, moderate and strong correlation. To gene-
rate the groups, we define a sequential algorithm that
uses groups of size k to generate groups of size k + 1
(with k ≥ 2), adding a user to the group according to
the corresponding cohesion degree.
5 RESULTS ANALYSIS
We evaluate the effectiveness of aggregation stra-
tegies with respect to the different ranking mea-
sures, by varying dimensions and inner correlati-
ons of the groups. Hence, for each group size
m, with 2 ≤ m ≤ 8, and for each correlation x ∈
{random, weak, moderate, strong}, we evaluate the
F-measure (also known as F1-score) and the nDCG,
for recommendation lists of size 5, 10 and 20 movies.
5.1 Ranking Techniques
In this first analysis, we evaluate the changing in
the F-measure and nDCG by fixing the aggregation
strategy, and we compare the used ranking techni-
ques. Results are reported in Table 3 together with
the ANOVA values. Notice that the average values are
very similar for each technique and the p-values con-
firm that there are not significant differences between
the different ranking strategies. Since the results seem
to be not significant, we conduct a deeper analysis by
analyzing the results in relation to the used aggrega-
tion strategies, and to the type of groups, in terms of
internal cohesion and group size.
5.2 Aggregation Strategies
As second analysis, we compare the aggregation stra-
tegies (AVG and FAIR), by fixing the ranking techni-
ques. Results of F1 measure are shown in Table 4.
In general, we can see that the weighted average stra-
tegy performs better than the fairness strategy. The
significance of these conclusions is confirmed by the
ANOVA test and the computed p-value. Similar re-
sults are obtained by evaluating the nDCG parame-
ters, as showed in Table 5. However, in the case of
nDCG significant results are only in case of Total and
Group Distances, that are indeed ranking strategies
that rely on the difference in the individual ratings.
5.3 Group Correlation
Table 6 shows results of the F1 evaluation conside-
ring grouping by correlation. Also, in these analy-
ses, we can observe that the user ranking does not
seem to have an impact on the aggregation strategy
while keeping fixed the group correlation. All the al-
gorithms show the best results in weak and moderate
correlation groups. The average extent of the worst F1
concerns the strong correlation groups. After a deeper
analysis on the groups, we believe that this could be
due to the fact that users with strong correlations eva-
An Off-line Evaluation of Usersâ
˘
A
´
Z Ranking Metrics in Group Recommendation
257
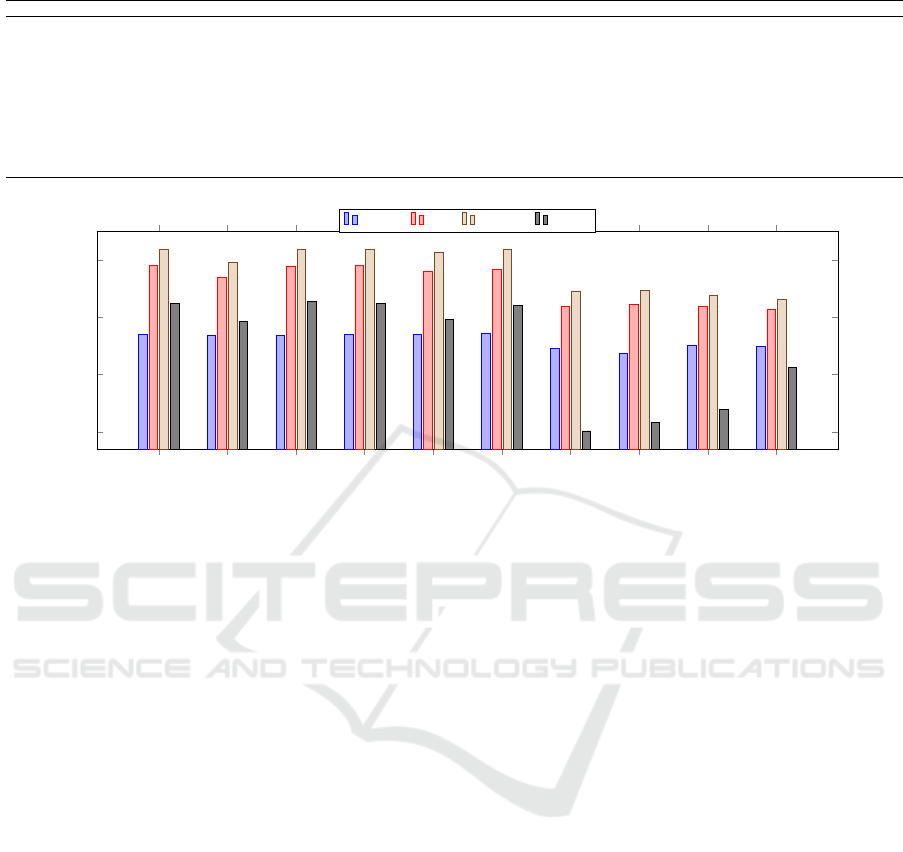
Table 7: F1 evaluation: grouping by group size.
Size 2 3 4 5 6 7 8 ANOVA (F) p-value
AS 0.054 ± 0.019 0.057 ± 0.018 0.053 ± 0.016 0.043 ± 0.017 0.035 ± 0.022 0.031 ± 0.02 0.028 ± 0.018 5.167 < 0.01
EX-AS 0.056 ± 0.02 0.058 ± 0.018 0.054 ± 0.016 0.044 ± 0.017 0.036 ± 0.022 0.031 ± 0.02 0.028 ± 0.019 4.931 < 0.01
EX-FAIR 0.05 ± 0.016 0.05 ± 0.016 0.045 ± 0.013 0.036 ± 0.014 0.029 ± 0.018 0.025 ± 0.016 0.022 ± 0.015 6.666 < 0.01
GD-AS 0.055 ± 0.019 0.057 ± 0.018 0.053 ± 0.016 0.043 ± 0.017 0.035 ± 0.022 0.031 ± 0.02 0.028 ± 0.019 5.112 < 0.01
GD-FAIR 0.049 ± 0.016 0.05 ± 0.016 0.045 ± 0.013 0.036 ± 0.014 0.029 ± 0.018 0.025 ± 0.016 0.022 ± 0.015 6.656 < 0.01
LM 0.057 ± 0.02 0.057 ± 0.017 0.053 ± 0.014 0.042 ± 0.016 0.033 ± 0.021 0.029 ± 0.019 0.026 ± 0.017 6.641 < 0.01
P-AS 0.055 ± 0.02 0.057 ± 0.018 0.054 ± 0.016 0.044 ± 0.017 0.035 ± 0.022 0.031 ± 0.02 0.028 ± 0.018 5.123 < 0.01
P-FAIR 0.049 ± 0.016 0.05 ± 0.016 0.045 ± 0.013 0.036 ± 0.014 0.029 ± 0.018 0.025 ± 0.016 0.022 ± 0.015 6.708 < 0.01
TD-AS 0.054 ± 0.019 0.057 ± 0.018 0.054 ± 0.016 0.043 ± 0.017 0.035 ± 0.022 0.031 ± 0.02 0.028 ± 0.019 5.107 < 0.01
TD-FAIR 0.049 ± 0.016 0.05 ± 0.016 0.045 ± 0.013 0.036 ± 0.014 0.029 ± 0.018 0.025 ± 0.016 0.022 ± 0.015 6.735 < 0.01
P-ASEX-ASGD-ASAS LM TD-AS EX-FAIR P-FAIRTD-FAIR GD-FAIR
0.5
0.55
0.6
0.65
Random Weak Moderate Strong
Figure 1: nDCG evaluation: grouping by correlation.
luated, on average, only five movies in common that
are too few to describe the correlation of the group.
Once set the algorithm, there are no significant
differences between weak and moderate correlation
groups. In all other cases (i.e., the correlation between
random and weak, moderate and random, random and
strong, weak and strong, moderate and strong) the
differences are significant. This implies that each
algorithm, by varying the correlation of the groups,
obtains different results. Hence, we can say that, in
general, the group cohesion affects the satisfaction of
its members. We also analyze the nDCG measure as
shown in Figure 1. Still, in this case, we can note that
the Fairness algorithms are worse than others. Ana-
lyzing each algorithm individually, there are signifi-
cant differences in the case of AS, GD-AS and TD-AS
varying the correlation, particularly between random
and weak correlation and weak and moderate.
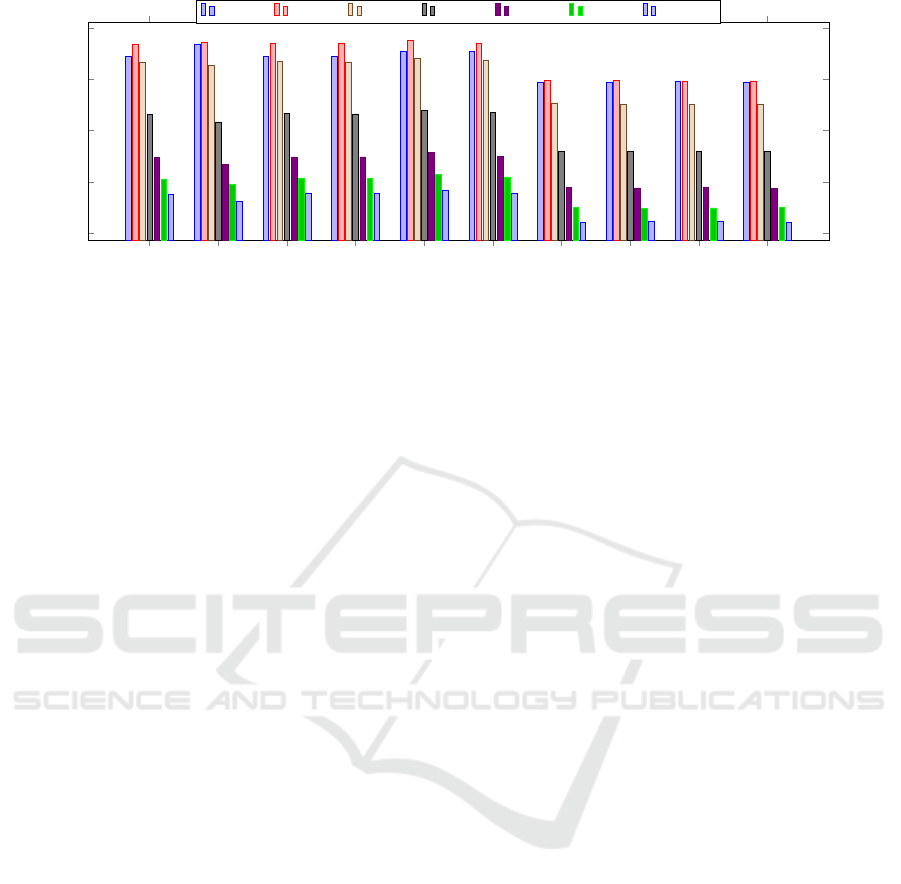
5.4 Group Size
At least, we analyze the results related to the size of
the group. Figure 2 shows the results. Also, in this
case, we can see that the Fairness strategies have the
worst results. Fixing the size of the groups and ana-
lyzing the average between the various algorithms in
pairs, the p − value resulting from the ANOVA sta-
tistical test is greater than 0.1, which means that all
differences are due to chance. So, we can state that
no algorithm prevails over by fixing the number of
members. Fixing the algorithm, and varying the size
of the groups, there are many cases where the ANOVA
test shows significant differences, as showed in Table
7. The best results are obtained for all the strategies
in groups composed of three members. We can see
that increasing the group’s size, the algorithms shows
worst results, as expected.
6 CONCLUSIONS
When designing group recommendation strategies
one of the major problems to address is the evaluation
process, since an offline evaluation is difficult because
a dataset containing information about individual ra-
tings and group’s choices is missing, and online eva-
luations are usually conducted only on a small set of
cases and cannot be executed extensively.
In this work, we try to define ranking measures,
defined on the basis of the information contained in
a well-known dataset for individual recommendati-
ons, the MovieTweetings dataset, that consists of mo-
vie ratings contained in tweets on the Twitter.com so-
cial network. We define two ranking-based aggrega-
tion strategies, a weighted average satisfaction and a
fairness based strategy, to generate groups recommen-
dations on groups automatically generated from the
users in the dataset to obtain an evaluation of the de-
fined ranking measures.
ICAART 2017 - 9th International Conference on Agents and Artificial Intelligence
258
AS
EX-AS
EX-FAIR
GD-AS
GD-FAIR
LM
P-AS
P-FAIR
TD-AS
TD-FAIR
2
3
4
5
6
·10
−2
Gr. size 2 Gr. size 3 Gr. size 4 Gr. size 5 Gr. size 6 Gr. size 7 Gr. size 8
Figure 2: F1 evaluation: grouping by group size.
To evaluate the strategies, measures like F1-score
and nDCG are computed, and then the results are ag-
gregated with different criteria to analyze different as-
pects of the group’s recommendations generated. Re-
sults suggest that in the case of off-line evaluation
classical aggregation strategies may produce different
results once applied on small groups, and so has the
cardinality of the group. More specifically, average
satisfaction based strategies seem to have best perfor-
mances than the fairness based. This could be related
to the evaluation metrics used, and so this should be
most deeply analyzed.
However, recent studies on small groups sho-
wed that their decision making relies on mechanisms
(e.g., interpersonal relationships and mutual influen-
ces) that are different with respect to the ones adopted
for larger groups (Levine and Moreland, 2008) that
are based on social choice functions. However, in this
case, off-line testing to show such differences seem to
be an impractical solution.
REFERENCES
Amer-Yahia, S., Roy, S. B., Chawlat, A., Das, G., and Yu,
C. (2009). Group recommendation: Semantics and
efficiency. Proc. VLDB Endow., 2(1):754–765.
Ardissono, L., Goy, A., Petrone, G., Segnan, M., and To-
rasso, P. (2003). Intrigue: Personalized recommenda-
tion of tourist attractions for desktop and handset de-
vices. Applied Artificial Intelligence, 17(8):687–714.
Baltrunas, L., Makcinskas, T., and Ricci, F. (2010). Group
recommendations with rank aggregation and collabo-
rative filtering. In Proc. of the Fourth ACM RecSys
’10, pages 119–126. ACM.
Berkovsky, S. and Freyne, J. (2010). Group-based recipe
recommendations: Analysis of data aggregation stra-
tegies. In Proc. of the Fourth ACM RecSys ’10, pages
111–118. ACM.
Dooms, S., De Pessemier, T., and Martens, L. (2013). Mo-
vietweetings: a movie rating dataset collected from
twitter. In Workshop on Crowdsourcing and human
computation for recommender systems, volume 2013,
page 43.
Gartrell, M., Xing, X., Lv, Q., Beach, A., Han, R., Mishra,
S., and Seada, K. (2010). Enhancing group recom-
mendation by incorporating social relationship inte-
ractions. In Proceedings of the 16th ACM Internatio-
nal Conference on Supporting Group Work, GROUP
’10, pages 97–106. ACM.
Levine, J. M. and Moreland, R. L. (2008). Small groups:
key readings. Psychology Press.
Masthoff, J. (2011). Recommender Systems Handbook,
chapter Group Recommender Systems: Combining
Individual Models, pages 677–702. Springer US, Bos-
ton, MA.
O’Connor, M., Cosley, D., Konstan, J. A., and Riedl, J.
(2001). Polylens: A recommender system for groups
of users. In Proc. of the 7th European Conf. on CSCW,
pages 199–218.
Pera, M. S. and Ng, Y.-K. (2013). A group recommender
for movies based on content similarity and popularity.
Inf. Process. Manage., 49(3):673–687.
Rossi, S., Barile, F., Caso, A., and Rossi, A. (2016). Web
Information Systems and Technologies: 11th Interna-
tional Conference, WEBIST, Revised Selected Papers,
volume 246, chapter Pre-trip Ratings and Social Net-
works User Behaviors for Recommendations in Tou-
ristic Web Portals, pages 297–317. Springer Interna-
tional Publishing.
Rossi, S., Barile, F., Di Martino, S., and Improta, D. (2017).
A comparison of two preference elicitation approa-
ches for museum recommendations. Concurrency and
Computation: Practice and Experience, to appear.
Rossi, S., Caso, A., and Barile, F. (2015). Combining users
and items rankings for group decision support. Advan-
ces in Intelligent Systems and Computing, 372:151–
158.
Rossi, S. and Cervone, F. (2016). Social utilities and perso-
nality traits for group recommendation: A pilot user
study. In Proceedings of the 8th International Confe-
rence on Agents and Artificial Intelligence, pages 38–
46.
An Off-line Evaluation of Usersâ
˘
A
´
Z Ranking Metrics in Group Recommendation
259
