
Evaluating a New Conversive Hidden non-Markovian Model Approach
for Online Movement Trajectory Verification
Tim Dittmar, Claudia Krull and Graham Horton
Faculty of Computer Science, Otto-von-Guericke-University Magdeburg, Magdeburg, Germany
{tim.dittmar, claudia.krull, graham.horton}@ovgu.de
Keywords:
Online Signature Verification, Conversive Hidden non-Markovian Model, DTW, HMM, Movement Trajecto-
ries.
Abstract:
This paper presents further research on an implemented classification and verification system that employs
a novel approach for stochastic modelling of movement trajectories. The models are based on Conversive
Hidden non-Markovian Models that are especially suited to mimic temporal dynamics of time series as in
contrast to Hidden Markov Models(HMM) and the dynamic time warping(DTW) method, time stamp infor-
mation of data are an integral part. The system is able to create trajectory models from examples and is tested
on signatures, doodles and pseudo-signatures for its verification performance. By using publicly available
databases, comparisons are made to evaluate the potential of the system. The results reveal that the system
already performs similar to a general DTW approach on doodles and pseudo-signatures but does not reach
the performance of specialized HMM systems for signatures. Further possibilities to improve the results are
discussed.
1 INTRODUCTION
In our daily life, movements of the human body play
an important role. They are part of our nature and
they are required to interact in this world whether it
be with objects, other humans and creatures or more
recently also with computers. Hence, there are a lot
of fields where the computational analysis of human
movements is of interest, e.g. for Human-Computer-
Interaction, sport science, forensic science, security,
gaming etc. For a lot of applications, mainly the shape
of the path of a certain movement (trajectory) and its
temporal dynamics are relevant, but due to spatial and
temporal variations between e.g. repeated executions
of a certain consciously performed movement, a clas-
sification or verification poses to be a difficult task.
In this article we present further research on a
new approach to model movement trajectories that
is based on a novel model class: Conversive Hidden
non-Markovian Model (CHnMM). In previous work
(see Section 2.1) the idea to use CHnMM was eval-
uated and a first system that automatically creates
CHnMM based trajectory models from several train-
ing examples has been developed, implemented and
tested for classification performance on touch ges-
tures. However, the CHnMM trajectory models are
also applicable for verification tasks. With the ex-
periments described in this paper their potential and
performance in this area is analysed.
A typical application for verification is the authen-
tication of persons and a very common method that
involves a movement trajectory is the verification of
signatures. In order to be able to compare the ver-
ification performance of the CHnMM based system
to other methods publicly available databases are em-
ployed that contain a sufficient amount of data from
real users. Instead of only evaluating the performance
on normal pen-drawn signatures, also finger-drawn
doodles and pseudo-signatures are used, because the
developed CHnMM system is not specifically created
for signatures but for any spatio-temporal trajectory
that only slightly varies in shape and temporal dy-
namics. As a result, we do not expect the CHnMM
system to significantly outperform other specialised
systems. The goal of this work is to prove that our
developed approach is applicable for movement tra-
jectory verification tasks using data of possible real
world applications.
We believe that CHnMM are especially suitable to
model temporal dynamics, hence, the discrimination
of trajectories that resemble in shape but differ in tem-
poral execution was a main goal of the developed sys-
tem. This trait could turn out to be useful in deciding
whether a signature is valid. A forgery attempt may
Dittmar, T., Krull, C. and Horton, G.
Evaluating a New Conversive Hidden non-Markovian Model Approach for Online Movement Trajectory Verification.
DOI: 10.5220/0006212502490258
In Proceedings of the 6th International Conference on Pattern Recognition Applications and Methods (ICPRAM 2017), pages 249-258
ISBN: 978-989-758-222-6
Copyright
c
2017 by SCITEPRESS – Science and Technology Publications, Lda. All rights reserved
249

have the same trajectory shape as the genuine one, but
probably will exhibit different temporal dynamics.
2 RELATED WORK
2.1 Previous Work
In (Krull and Horton, 2009) an extension to the pop-
ular Hidden Markov Models (HMM) has been pre-
sented: the so-called Hidden non-Markovian models
(HnMMs) that allow more realistic modelling of pro-
cesses. The solution algorithms (Evaluation, Decod-
ing and Training (Rabiner and Juang, 1986)) are com-
putationally very demanding and consequently Buch-
holz defined and researched a subclass called Con-
versive HnMM (CHnMM) that still provide detailed
modelling possibilities while significantly improving
the efficiency of the solution algorithms.
Since CHnMM and HMM are related, studies
have been conducted by Bosse et al.(Bosse et al.,
2011) and Dittmar et al. (Dittmar et al., 2013) to eval-
uate the general applicability of CHnMM to Wiimote
and touch gesture recognition respectively, which is
often done by means of HMM classifiers. Both stud-
ies revealed that CHnMM outperform HMM espe-
cially if the shape of the gestures is not the discrimi-
nating factor but its temporal dynamics.
However, a problem of both approaches is the fact
that the gesture models are required to be manually
created by an expert who extracted a model struc-
ture and calculated model parameters from several ex-
ample traces. This greatly reduces the practicability
of the approach in real world applications and there-
fore an automatic model creation approach has been
developed that covers general movement trajectories
that spatially and temporally behave similar on each
repetition. In (Dittmar et al., 2015) this approach is
explained in detail and it has been implemented and
tested on touch gesture recognition tasks with promis-
ing results.
2.2 Related Work
The discipline of online signature verification is
well established and manifold methods and tech-
niques have been applied. There are two main cat-
egories of systems: ’feature-based’ and ’function-
based’ (Martinez-Diaz et al., 2014). The CHnMM
system would belong to the ’function-based’ systems,
as it mainly operates on the time-discrete functions
describing the pen movement trajectory, instead of
calculating a number of global features. Two main
representatives of this category are HMM and DTW
based systems of which plenty exist.
Examples of HMM based systems include work
by Fierrez et al. (Fierrez et al., 2007) where a lot
of features are extracted from the signatures (from
MCYT database) to learn continuous HMM from ex-
amples with each representing the signature. Simi-
larly, Muramatsu et al. (Muramatsu and Matsumoto,
2003) learned discrete HMM only utilizing the quan-
tized direction angle to model Chinese signatures.
However, HMM tend to require more training ex-
amples than for example DTW (Fierrez et al., 2007)
and the training process needs a significant amount of
time to create the models. However, the computation
of the verification score is comparably fast.
DTW methods, which represent a template match-
ing approach, are very common and the system by
Kholmatov et al. (Kholmatov and Yanikoglu, 2005)
even won the First International Signature Verifica-
tion Competition, interestingly, without using further
information like pressure, azimuth or elevation. Other
examples are described by Faundez-Zanuy (Faundez-
Zanuy, 2007) and Martinez-Garcia et al. (Martinez-
Diaz et al., 2013) but the latter employed the DTW
method on doodles and pseudo-signatures that were
finger-drawn on a mobile touch device. The DTW
method requires to save all training examples as tem-
plates and in order to verify an input a DTW distance
score has to be determined for each available tem-
plate.
Although the temporal dynamics are essential to
verify a signature, neither HMM nor DTW utilize any
time information in the calculations. They assume
a regular time series like a fixed frequency from a
recording device. Both methods could unveil prob-
lems in cases where this frequency changes for exam-
ple because of different recording devices. CHnMM
explicitly need the timestamp of each observation but
are not bound to regular signals.
3 THE CHnMM VERIFICATION
SYSTEM
The following paragraphs summarise important as-
pects of the developed CHnMM based classification
and verification system for spatio-temporal move-
ment trajectories.
3.1 CHnMM - Formal Definition
Firstly, in order to understand the descriptions, the
formal definition of a CHnMM is presented.
ICPRAM 2017 - 6th International Conference on Pattern Recognition Applications and Methods
250

A CHnMM contains the following elements that
are similar to the elements of HMM:
• a set of states S of size N
• a set of output symbols V of size M
• an initial probability vector Π = (π
1
, . . . , π
N
)
• a NxN matrix A containing the state change be-
haviour, but with more complex elements a
i j
.
Additionally, a CHnMM contains the set T R =
{tr
1
, tr
2
, . . . , tr
K
} of K transitions that define the
model behaviour. Each transition tr
i
is a tuple con-
sisting of the following three elements:
• dist represents the continuous probability distri-
bution that specifies the duration of the transition
which causes a discrete state change.
• b(v) is a function that returns the output probabil-
ity of symbol v when the transition causes a state
change. It is the semantic equivalent of the out-
put probabilities in B for HMM, but associated
to transitions for CHnMM instead of states as in
HMM.
• aging is a Boolean value that determines if the
time that the transition has been active for is saved
(aging = true) or reset to 0 (aging = f alse) if it is
deactivated prior to firing, i.e. if the current ac-
tive transition is interrupted by the triggering of
another one. This property will not be of further
relevance in this article as the models will always
default it to f alse.
All elements a
i j
in A are either elements of T R
or empty if no transition between states s
i
and s
j
ex-
ist. A CHnMM λ is fully defined as a tuple λ =
(S, V, A, T R, Π) that contains all previously described
elements. (Lambda ist normalerweise nur A,TR und
PI)
3.2 Trajectory Model Structure
The basic idea of the developed trajectory model is to
split the stochastic process into its spatial and tem-
poral stochastics. The reason behind this is to fa-
cilitate the automatic CHnMM creation by utilising
the spatial information of the trajectories to define the
CHnMM states S and output symbols V and their be-
haviour tr.b(v). The temporal stochastics of the pro-
cess are represented by the transitions of the CHnMM
(tr.dist).
For representing the spatial stochastics of the pro-
cess, the so-called StrokeMap was introduced. It con-
sists of circular areas that each trajectory path will
reach successively. In Figure 1 the general model
concept is visualised with two exemplary trajectories
that represent the stochastic process. The examples
are used to generate the StrokeMap first, which there-
upon serves as the base for the layout of the CHnMM.
Afterwards, the time distributions for each CHnMM
transition are estimated from the examples. The de-
tails of how the StrokeMap and the CHnMM are cre-
ated are explained in the following two sections.
3.3 Creating the StrokeMap
The StrokeMap is an ordered set of circular areas
(SM = {Ar
1
, . . . , Ar
n
}) that represent the locations
that every trajectory has to pass through successively.
They hold the spatial stochastics by defining proba-
ble locations of where the trajectory points will oc-
cur and each area consists of its position, its radius
and its tolerance radius (Ar = (x, y, r, r
tol
)). The ar-
eas are created from a set of example trajectories
I = {tr j
1
, . . . , tr j
m
} where each trajectory is a chrono-
logically ordered sequence of tuples that contains the
position and timestamp of each recorded point (tr j =
((x
1
, y
1
, t
1
), . . . , (x
m
, y
m
, t
m
))).
In Algorithm 1 a formal definition of the gen-
eration process is given that describes how the
StrokeMap areas A
1
to A
n
are determined. Firstly,
each trajectory in I is linearly interpolated to approx-
imate the continuous trajectory path. Afterwards, a
fixed number of spatially equidistant points is sam-
pled from the interpolated trajectory, defined by the
parameter nAreas. The arc distance between the
points ∆s
tr j
depends on the arc length of the trajec-
tory.
∀tr j ∈ I :
Int
tr j
(s) = Interpolation(tr j)
∆s
tr j
=
Length(LI
tr j
)
nAreas
∀i ∈ N, 1 ≤ i ≤ nAreas :
AP
i
= {ap
i,tr j
| Int
tr j
(∆s
tr j
∗ i)}
D
i
= {∆t | ap
i,tr j
.t − ap
i−1,tr j
.t}
Ar
i
= CreateArea(AP
i
, minRadius)
Ar
i
.r
tol
= Ar
i
.r ∗toleranceFactor
Algorithm 1: StrokeMap generation.
The sampled points are grouped together in AP
i
according to their area index. Each set AP
i
of area
points is used to create an individual area A
i
of the
StrokeMap. The CreateArea function determines the
radius and the position of a minimal circular area that
contains all the points of a set AP
i
. To counter areas
that are too small due to a small number of examples,
Evaluating a New Conversive Hidden non-Markovian Model Approach for Online Movement Trajectory Verification
251
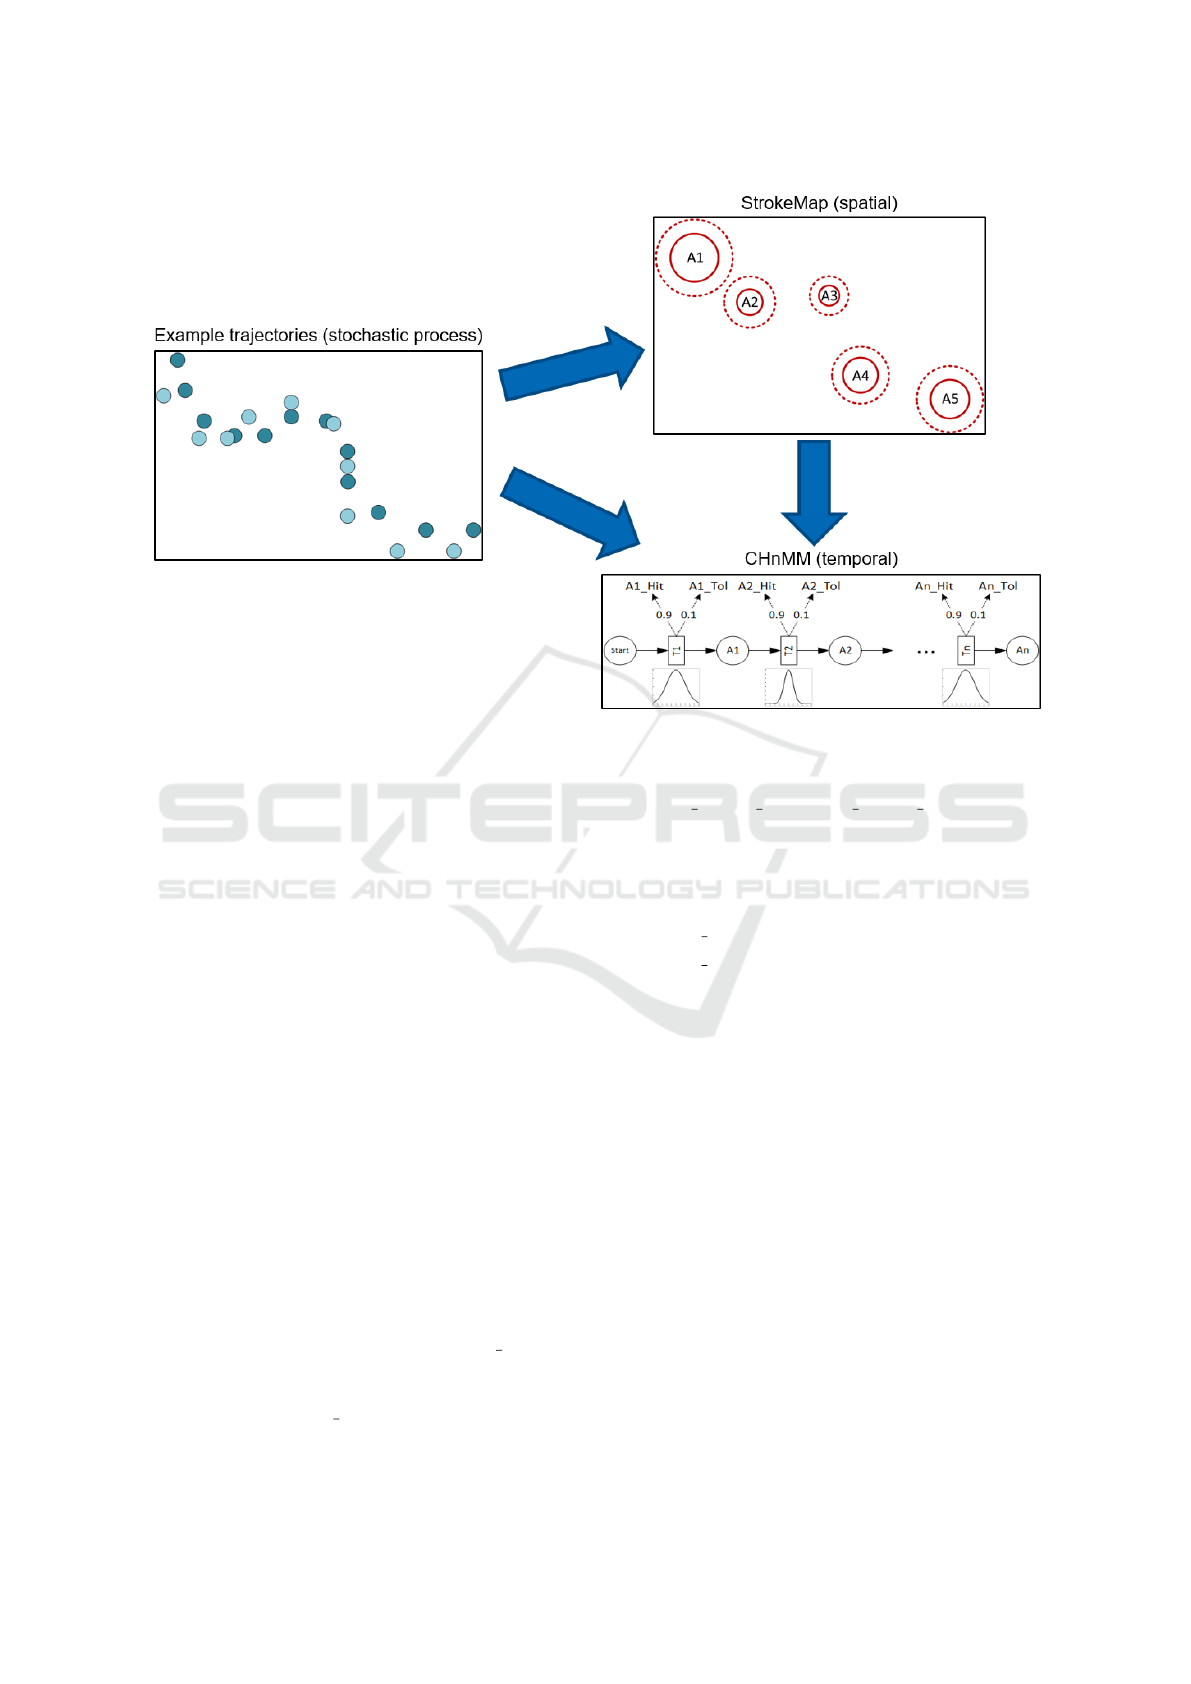
Figure 1: The concept: Split the stochastic process given by example trajectories into its spatial and temporal stochastics.
the parameter minRadius is implemented that defines
the minimal radius that is returned by CreateArea.
Furthermore, it is expected that unknown exam-
ples of the trajectory will not always pass through the
calculated areas and therefore, the parameter toler-
anceFactor is employed to determine a tolerance area
radius by multiplying the factor with the original cir-
cle radius. The set D
i
contains the times needed to
travel the ∆s
tr j
distance from area A
i−1
to A
i
and will
be used in the CHnMM creation process.
3.4 Creating the CHnMM
As already stated the StrokeMap is the base the
CHnMM, especially for its layout. In Algorithm 2 it is
formally shown how all the elements of the CHnMM
are determined and it can be clearly seen that the sets
S, V, A of the CHnMM, which basically represent the
layout, are already determined by knowing nAreas. A
linear topology is employed to connect the states with
transitions as it is known from HMM (Fink, 2014) and
the graphical visualization of this layout is shown in
Figure 1.
Subsequently, each transition tr
i
is defined. For
the output probabilities a parameter hitProbability ex-
ists that specifies the probability that the Ai Hit sym-
bol is generated by a trajectory, indicating that the
according sampling point ap
i
lies within the circu-
lar core area, while Ai Tol that the point lies within
the tolerance area, which is penalized by applying
S = {Start, A
1
, . . . , A
n
}
V = {A1 Hit, A1 Tol, . . . , An Hit, An Tol}, n = nAreas
A = T R
nAreas×nAreas
, a
i j
=
(
tr
j
if j = i + 1
/
0 otherwise
∀i ∈ N, 1 ≤ i ≤ nAreas :
tr
i
.b(Ai Hit) = hitProbability
tr
i
.b(Ai Tol) = 1 − hitProbability
tr
i
.aging = f alse
tr
i
.dist = CreateDistribution(D
i
, distType)
Algorithm 2: CHnMM generation.
a smaller probability. Ergo, hitProbability is always
greater than 0.5.
For the probability distribution of a transition
tr
i
.dist that defines the temporal behaviour, the set D
i
from the StrokeMap creation is passed to the Create-
Distribution function that estimates a fitting distribu-
tion according to the given distType.
3.5 Trajectory Verification
After a trajectory model, consisting of the StrokeMap
and the CHnMM, has been created, it can be used to
verify unknown trajectory examples. Therefore, the
evaluation task, which is known from HMM systems,
needs to be solved. Formally this means to calculate
ICPRAM 2017 - 6th International Conference on Pattern Recognition Applications and Methods
252

P(O|λ) given a symbol trace O = (o
1
, . . . , o
T
) and a
CHnMM λ. The symbol trace O is generated from the
unknown input trajectory by using the point sampling
method from Section 3.3. If a point lies within its
corresponding StrokeMap area either Ai Hit or Ai Tol
is emitted as an observation o
i
at the interpolated time
of the sample point. If there is a single sample point
that does not lie within its area the result for P(O|λ) is
0, otherwise the probability that the model λ created
the trace O is calculated according to the evaluation
algorithm presented in (Buchholz, 2012).
If the result is 0, the input is assumed to be in-
valid. In Section 4.3.3 the use of a threshold value is
discussed.
4 EXPERIMENTS
4.1 Databases
The following sections describe the employed ex-
ternal databases of real world trajectory data that
are mainly intended for biometric authentication pur-
poses. They are interesting to test on, because they
represent real world data created with different de-
vices by a sufficient number of users.
4.1.1 MCYT
The MCYT (Ministerio de Ciencia y Tecnolog
´
ıa) bi-
modal biometric database(Ortega-Garcia et al., 2003)
consists of a fingerprint and online signature dataset
whose purpose is to represent a statistical significant
part of a large scale population. Thereby, it enables
the evaluation of the performance of automatic bio-
metric recognition systems and their comparison. For
this work, only the online signature dataset is of in-
terest, as it contains spatio-temporal trajectory data
to evaluate the developed CHnMM recognition ap-
proach.
The database version that is kindly provided by
Biometric Recognition Group - ATVS of the Uni-
versidad Autonoma de Madrid consists of signatures
of 100 participants. Each participant provided 25
genuine executions of his or her signature that were
created on a WACOM INTUOS A6 USB pen tablet
recording the following features with a 100Hz fre-
quency:
• x, y coordinates
• pressure applied by pen
• azimuth angle of the pen relative to the tablet
• altitude angle of the pen relative to the tablet
For the CHnMM recognition system to work, a
synthetic timestamp is additionally created that in-
creases by 10ms for each new feature vector. Be
aware, that the CHnMM recognition system only
makes use of the x, y coordinates and the timestamp,
because it was designed for general movement trajec-
tories and not device specific data.
Besides the 25 genuine signature examples, there
are also 25 forgeries per user that are created by other
participants based on a static image of the genuine
user signature. Since the lifting of the pen from
the surface does not result in a lack of positional
data,these pen movements that are not part of the re-
sulting static signature image are still part of the on-
line signature. In Figure 2 some examples of three
different users are visualized to give an impression of
the signature data.
4.1.2 DooDB
The DooDB created by Martinez-Diaz et
al.(Martinez-Diaz et al., 2013), which is also
made publicly available by the ATVS group, consists
of two corpora: Doodles and Pseudo-signatures.
Both corpora were created by finger movements
on the touch surface of an HTC Touch HD mobile
phone with a 5x8.5cm screen. The recorded data
includes the x, y coordinates and a time interval
that describes the time that has passed since the last
recorded touchpoint, which usually is around 10ms as
the device frequency is approximately 100Hz. This
time interval is significantly longer if there is a phase
where the finger does not touch the surface, because
no data can be recorded in that time. Erroneous data,
i.e. 0,0 coordinates, that is part of the recordings
is left out of the trajectory, but the time interval
information of the erroneous measurement is still
considered for determining the timestamps.
Both corpora consist of examples from 100 users,
and for each user there are 30 genuine examples and
20 forgeries in each corpus. The difference between
the corpora is what the participants have been draw-
ing. For the Doodles corpus, they were asked to draw
a doodle that they would use as a graphical password
on a regular basis for authentication purposes, while
they drew a simplified version of their signature in the
Pseudo-signatures corpus.
4.2 Experiment Protocol
For a better understanding of the experiment results,
this section describes the details and circumstances of
how they are obtained and what they consist of.
Evaluating a New Conversive Hidden non-Markovian Model Approach for Online Movement Trajectory Verification
253
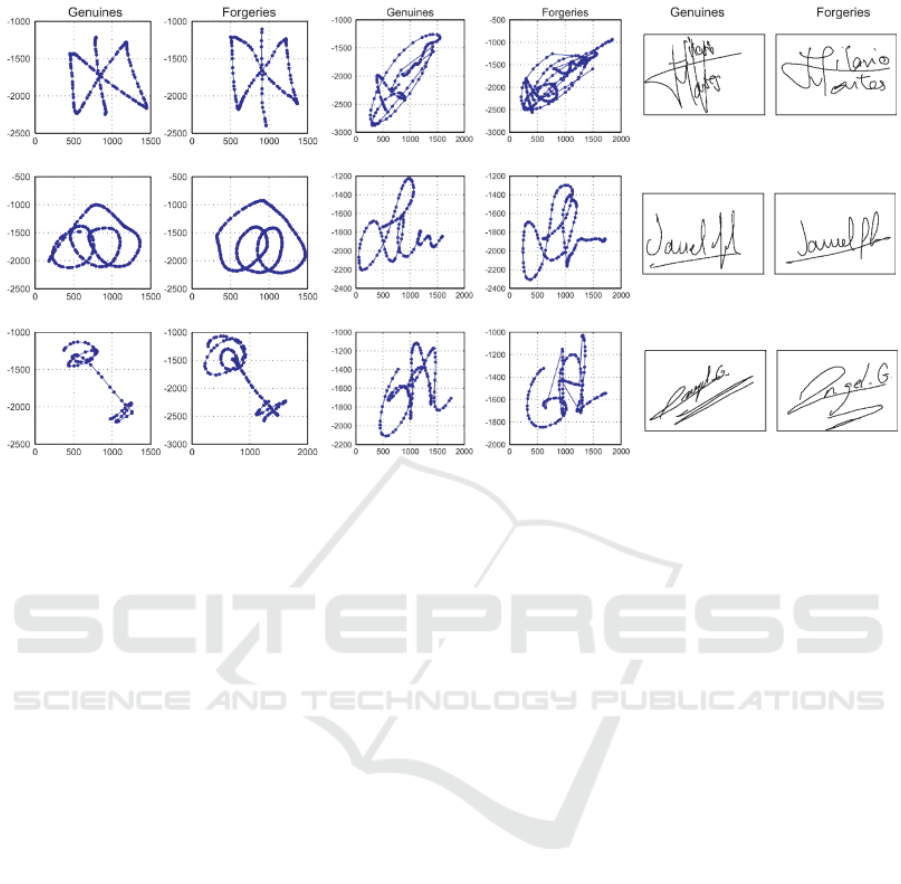
Figure 2: Genuine and forgery examples from the Doodle(left), PseudoSignatures(middle) and MCYT(right) corpora.
Performance Assessment. The goal of this work is
to evaluate the new CHnMM trajectory verification
approach on real world authentication data. To as-
sess the quality of an authentication system, there are
two main measures: the False Rejection Rate (FRR)
of genuine trajectories and the False Acceptance Rate
(FAR) of forgery trajectories which are commonly
used (Kholmatov and Yanikoglu, 2009; Martinez-
Diaz et al., 2013; Ortega-Garcia et al., 2003). Usu-
ally, authentication systems employ a certain thresh-
old value that decides whether a certain input fits the
template. Changing this threshold either favours a
better FAR or a better FRR of the system or in other
words both are inversely related. It is common to pro-
vide the so called Equal Error Rate (EER) where FAR
equals FRR as a single quantity to specify the quality
of an authentication system.
Input Data. The data used for the experiments orig-
inates from the databases explained in the previous
section that yield three different corpora of interest:
MCYT Signatures, Doodles and PseudoSignatures.
All of these corpora share enough similarities so that
it is possible to use the same experiment protocol on
them. They all contain several genuine examples of
a certain user trajectory, i.e. signature, doodle or
pseudo signature, and also several forgeries of these
user trajectories for each user. The coordinates of the
data points of each trajectory are normalized to a real
valued range from 0 to 1 according to the size of the
available surface area.
To conduct the experiments, the trajectory data
from the corpora needs to be separated into a train-
ing set, a genuine test set and a forgery test set. The
training set is used to create the verification system
while both test sets are used to determine the verifi-
cation performance. In this work, two different ap-
proaches to create these sets have been used, inspired
by the procedure in (Martinez-Diaz et al., 2013). Both
approaches differ in the quality of the forgeries and
are referred to as random and skilled. In both cases,
a specified number of genuine training examples is
taken from each user and the remaining genuine ex-
amples of the user are used for the genuine test set.
In the random approach, the forgery test set consists
of the first genuine example of every other user and
the performance results will help to understand the
robustness of the verification system against random
input. For the skilled approach, the forgery set con-
sists of all available forgery examples for the user and
the results will reveal the applicability of the verifica-
tion system in real world situations.
Parameter Variation. The CHnMM authentication
system that is described in this work has several pa-
rameters that influence the authentication behaviour.
In order to determine acceptable parameter sets and to
evaluate the influences of certain parameters, param-
eter variation has been utilized, hence, the system is
tested with a lot of different parameter combinations.
The tested parameter ranges are based on experience
from previous work (Dittmar et al., 2015) and are as
follows:
ICPRAM 2017 - 6th International Conference on Pattern Recognition Applications and Methods
254

• nAreas: 10–20, step size 5,
• minRadius: 0.01–0.19, step size 0.02,
• toleranceFactor: 1.1–2.1, step size 0.2,
• distributionType: uniform and normal.
As a result, 360 different parameter sets are used
to evaluate the CHnMM authentication system. Ad-
ditionally, to test the influence of a different number
of training examples, the experiments have been con-
ducted with either five or ten training examples per
user. Consequently, for each corpus (MCYT, Doo-
dles, PseudoSignatures) and forgery data type (ran-
dom or skilled) 360 ∗ 2 FAR-FRR pairs are calcu-
lated. Plotting these results in a FAR-FRR point di-
agram helps to interpret the results. This diagram
must not be confused with the so-called Receiver Op-
erating Characteristic (ROC) curve although it is very
similar. The ROC curve is commonly used to visual-
ize the behaviour of a verification system but in this
work, there is currently no single threshold parameter
implemented.
To reduce the load of the immense amount of cal-
culations, the employed data sets were limited to 25
users for the parameter variation experiments. Only
for particular parameter sets, the complete data set
was utilised. All experiments were conducted on a
common modern laptop (Intel Core i5 - 5200U, 8GB
RAM).
4.3 Results
4.3.1 Result Overview
The outcome of the previously explained experiments
is visually summarized in Figure 3 with an FAR-FRR
point diagram for every corpus. The visual impres-
sion very much resembles a typical ROC curve espe-
cially if a Pareto frontier is imagined. The main dif-
ference is that there are also points behind the Pareto
frontier, which represent results of experiments where
an unsuitable parameter set was employed. Hence,
the general behaviour is as expected, because trying
to reduce the FRR produces higher FAR and vice
versa. Also as expected is the performance differ-
ence between random (circles) and skilled (crosses)
forgeries as most experiment outcomes for the ran-
dom approach are very close to a FAR of 0, especially
compared to the skilled forgery approach.
Comparing the different data sets, the best perfor-
mance was achieved with MCYT signatures, where
also the distance between random and skilled is rather
small compared to doodles and pseudo-signatures.
This is probably due to the fact that signatures writ-
ten with a pen are performed more consistently, since
they are a common and known movement for the
user. For the same reason, the pseudo-signature re-
sults are slightly better than for the doodles, but since
the pseudo-signatures are performed with a finger on
a touch-screen they are not as consistent as the signa-
tures.
Another unsurprising observation is that increas-
ing the number of training examples from five (yel-
low) to ten (blue) generally improves the perfor-
mances on all databases. However, this also indicates
that the developed system works as expected.
In Table 1 the achieved EER for each data set and
forgery type is displayed. Be aware that in this work
these EER values describe the best achievable bal-
anced (FAR equals FRR) result by using a good pa-
rameter set. The values do not recommend to use the
system in practice, especially due to the quite high
percentages for the random forgeries that seemingly
suggest that not even random input can be distin-
guished well, but the plots prove that the system has a
very low FAR until the parameter sets become too tol-
erant. Hence, in order to better understand the values
they have to be compared to other methods.
Table 1: Achieved EER for every database.
MCYT Doodles PseudoSignatures
Random 4% 12% 8%
Skilled 11% 29% 21%
The work by Martinez-Diaz et al.(Martinez-Diaz
et al., 2013) contains benchmark values for the Doo-
dles and Pseudo-signatures corpora that are based on
a DTW verification approach. Fortunately, they em-
ployed very basic DTW approaches that only use
the x,y-coordinates or their first or second derivative.
This allows for a fair comparison, because these fea-
tures are not application specific but very generic as
is our system that is not designed for specific trajec-
tories. Their results are based on experiments with
5 training examples, and with skilled forgeries they
achieved EER between 26.7%–36.4% for doodles and
between 19.8%–34.5% for Pseudo-signatures. For
random forgeries the EER are between 2.7%–7.6%
for doodles and between 1.6%–5.0% for Pseudo-
signatures.
In the work by Ortega-Garcia et al. (Ortega-
Garcia et al., 2003) an HMM verification approach
was applied to subsets of the MCYT database where
models were trained using 10 training examples. De-
pending on the chosen subset, EER between 1% and
3% were achieved for skilled forgeries. While this
value could not be achieved with our system, we still
think that the performance is very promising, espe-
cially considering that it is not specialized on signa-
Evaluating a New Conversive Hidden non-Markovian Model Approach for Online Movement Trajectory Verification
255
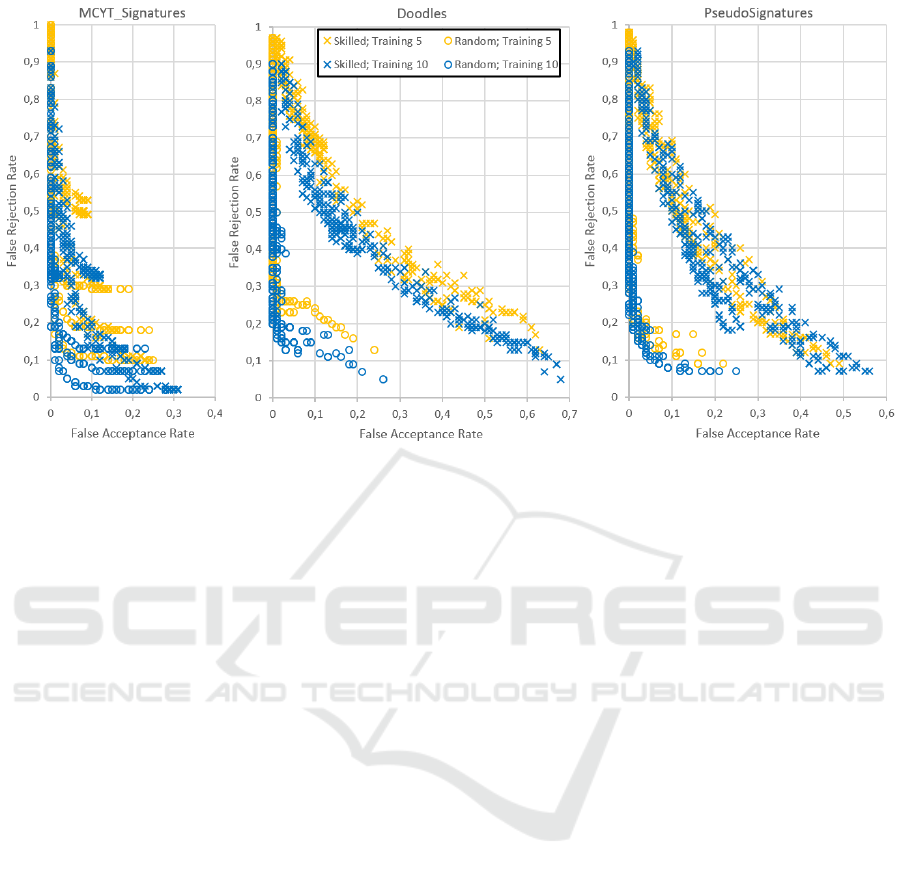
Figure 3: FAR-FRR plots for all authentication experiment results distinguished by forgery type and training size.
ture trajectories and that there is still room for im-
provement by employing a threshold system. This
idea is further discussed in Section 4.3.3. Moreover,
the HMM system utilized other recorded data like az-
imuth, elevation and pressure of the pen in order to
reach these results. In (Fierrez et al., 2007) it is stated
that only using the x and y coordinates resulted in an
EER of 10.37%.
4.3.2 Parameter Influences
The influence and behaviour of the CHnMM system
parameters still very much resembles the observations
made in previous work (Dittmar et al., 2015) where
the system was applied to touch gesture classification
tasks. The parameters minRadius and toleranceFac-
tor influence the system behaviour the most, as in-
creasing their values generally creates more tolerant
verification systems that are more accepting and thus
leads to lower FRR and higher FAR. Interestingly, the
parameter nAreas does not have a big influence for
certain parameter combinations especially those that
lead to practically useless results with FAR greater
than 50%, but a lower nAreas value can slightly im-
prove the EER of the verification system for better
parameter sets. This is due to the fact that a smaller
number of areas in the model decreases the number of
“hurdles” for a certain input and thereby the number
of false rejections can be decreased while the chances
of accepting an invalid input (FAR) only slightly in-
creases.
In Figure 5 the results of the experiments for
skilled forgeries are plotted again but slightly differ-
ent in order to analyse the influence of the distribu-
tion type of the transitions that are either uniform or
normal in this work. The plots visualize that the uni-
form distribution generally seems to improve the FAR
compared to the normal distribution while sacrificing
on FRR. This is expected behaviour as the uniform
distribution only covers a strict time interval while
a normal distribution theoretically covers an infinite
one. Hence, if the input does not fit into the time in-
terval at one point in the trajectory model, the input is
determined invalid. With the normal distribution such
an early rule out by time cannot occur. The uniform
distribution seems to perform better for the Pseudo-
signatures, which leads to think that the temporal be-
haviour is quite decisive in this data set. The same
trend occurs in the Doodle database but an EER is
never reached. For the MCYT signatures, the normal
distribution seems to be the better choice which prob-
ably is due to an unsuitable time tolerance for this data
set.
4.3.3 Employing a Threshold Value
Currently, the implemented system does not em-
ploy the usual threshold concept as it is currently
not decided how a threshold is best determined for
our system. To prove that there is further poten-
tial to improve the already promising system, an ad-
ditional experiment was conducted on the MCYT
signature database. This time with the data of
all available 100 users, 10 training examples and
only with a specific parameter set. The chosen set
(nArea=10, toleranceFactor=1.7, minRadius=0.05,
ICPRAM 2017 - 6th International Conference on Pattern Recognition Applications and Methods
256
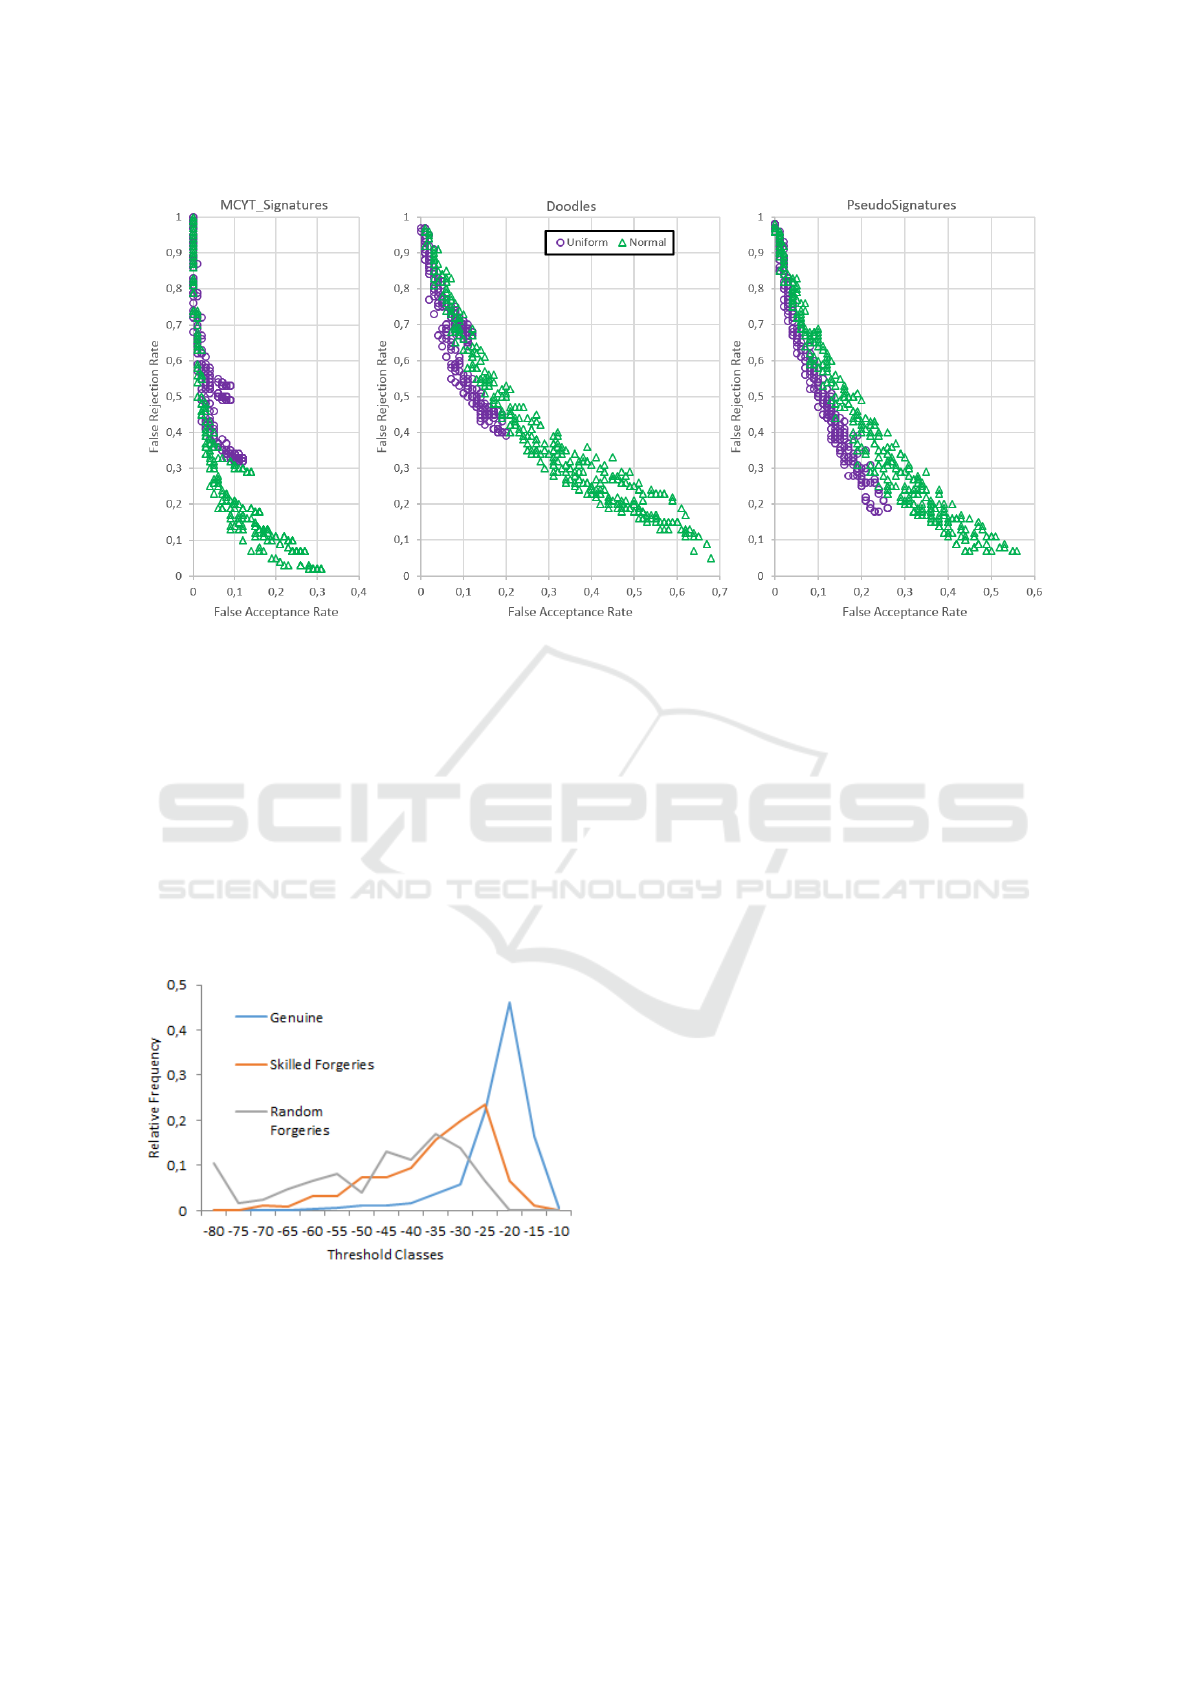
Figure 5: FAR-FRR plots for all skilled experiment results distinguished by distribution type.
distributionType=normal) achieved the best balanced
result (FAR=10%, FRR=12%) for skilled forgeries in
the previous experiments. In this additional experi-
ment, the evaluation values of each verification were
recorded.
The resulting FAR and FRR values essentially did
not change and in Figure 4 the histogram shows how
often certain evaluation values occurred in relation to
the number of verifications made whose evaluation
value were not 0. Be aware that the logarithm of the
evaluation values was taken in order to make the very
small values more comprehensible and easier to visu-
alise.
Figure 4: Evaluation value distribution for a chosen param-
eter set with MCYT Signatures (logarithmic values).
As expected, the plot reveals that the evaluation
values of genuine inputs tend to be larger than those
of skilled and random forgeries with close to 95%
of them being between -40 and -10. While there
is no perfect threshold value that separates the forg-
eries from the genuines, it is possible to achieve im-
provement especially for the FAR. For example, set-
ting the threshold to -40 would keep the FRR at
12% (there is only a slight deterioration from 11.9%
to 12.2%) while significantly improving the FAR to
6.5%. Choosing a higher threshold like -30 would
further improve the FAR to 3% at the expense of the
FRR increasing to 16.7%.
These findings suggest that the implementation of
a threshold value could further improve the results
from the previous experiments. We assume that the
plotted results would see a shift to the left, because
the FAR seems to improve with a comparably smaller
deterioration of the FRR.
5 CONCLUSIONS
In this paper, a CHnMM approach for trajectory veri-
fication is presented and tested on three different data
sets: signatures, doodles and pseudo-signatures. The
results are shown to be in competitive ranges com-
pared to HMM and DTW methods that others already
applied to these data sets, proving the applicability
of the developed CHnMM for trajectory verification
tasks. The EER values for random forgeries were not
as competitive, but the discussed implementation of
a threshold value should provide significant improve-
ments in this regard.
Furthermore, it was shown that due to the avail-
able method parameters it is possible to adjust the sys-
tem behaviour to the needs of the application. Using
a uniform distribution for example significantly im-
Evaluating a New Conversive Hidden non-Markovian Model Approach for Online Movement Trajectory Verification
257

pacts the FAR values and for the coming iterations of
the system, a new tolerance factor for the time distri-
butions could be introduced. As a result, the system
could be tuned to either prefer accurate timing and/or
accurate trajectory shapes.
In the future, the developed CHnMM creation
method for trajectories might be generalized to work
on any time series like DTW and HMM, but with a
focus on temporal dynamics and fast computations
while also being independent of regular time series.
ACKNOWLEDGEMENTS
We would like to thank the Biometric Recogni-
tion Group - ATVS for providing us access to their
databases.
REFERENCES
Bosse, S., Krull, C., and Horton, G. (2011). Modeling of
gestures with differing execution speeds: are hidden
non-markovian models applicable for gesture recogni-
tion. In MAS: The International Conference on Mod-
elling & Applied Simulation, pages 189–194.
Buchholz, R. (2012). Conversive Hidden non-Markovian
Models. PhD thesis, Otto-von-Guericke-Universitt
Magdeburg.
Dittmar, T., Krull, C., and Horton, G. (2013). Using con-
versive hidden non-markovian models for multi-touch
gesture recognition. In The 12th International Con-
ference on Modeling & Applied Simulation.
Dittmar, T., Krull, C., and Horton, G. (2015). An improved
conversive hidden non-markovian model-based touch
gesture recognition system with automatic model cre-
ation. In The 14th International Conference on Mod-
eling & Applied Simulation.
Faundez-Zanuy, M. (2007). On-line signature recognition
based on vq-dtw. Pattern Recognition, 40(3):981–992.
Fierrez, J., Ortega-Garcia, J., Ramos, D., and Gonzalez-
Rodriguez, J. (2007). Hmm-based on-line signature
verification: Feature extraction and signature model-
ing. Pattern recognition letters, 28(16):2325–2334.
Fink, G. A. (2014). Markov models for pattern recogni-
tion: from theory to applications. Springer Science &
Business Media.
Kholmatov, A. and Yanikoglu, B. (2005). Identity authen-
tication using improved online signature verification
method. Pattern recognition letters, 26(15):2400–
2408.
Kholmatov, A. and Yanikoglu, B. (2009). Susig: an
on-line signature database, associated protocols and
benchmark results. Pattern Analysis and Applications,
12(3):227–236.
Krull, C. and Horton, G. (2009). Hidden non-markovian
models: formalization and solution approaches. In
Proceedings of 6th Vienna International Conference
on Mathematical Modelling.
Martinez-Diaz, M., Fierrez, J., and Galbally, J. (2013). The
doodb graphical password database: data analysis and
benchmark results. IEEE Access, 1:596–605.
Martinez-Diaz, M., Fierrez, J., Krish, R. P., and Galbally, J.
(2014). Mobile signature verification: feature robust-
ness and performance comparison. IET Biometrics,
3(4):267–277.
Muramatsu, D. and Matsumoto, T. (2003). An hmm online
signature verifier incorporating signature trajectories.
In Document Analysis and Recognition, 2003. Pro-
ceedings. Seventh International Conference on, pages
438–442. IEEE.
Ortega-Garcia, J., Fierrez-Aguilar, J., Simon, D., Gonza-
lez, J., Faundez-Zanuy, M., Espinosa, V., Satue, A.,
Hernaez, I., Igarza, J.-J., Vivaracho, C., et al. (2003).
Mcyt baseline corpus: a bimodal biometric database.
IEE Proceedings-Vision, Image and Signal Process-
ing, 150(6):395–401.
Rabiner, L. and Juang, B. (1986). An introduction to hidden
markov models. ieee assp magazine, 3(1):4–16.
ICPRAM 2017 - 6th International Conference on Pattern Recognition Applications and Methods
258
