
A Data-Driven Methodology for Heating Optimization in
Smart Buildings
Victoria Moreno
1
, Jos
´
e Antonio Ferrer
2
, Jos
´
e Alberto D
´
ıaz
2
, Domingo Bravo
2
and Victor Chang
3
1
Department of Energy, Research Institute of Energy and Environment of Heidelberg (ifeu), Heidelberg, Germany
2
Department of Energy, Energy Efficiency in Buildings Unit, CIEMAT, Madrid, Spain
3
Xi’an Jiaotong Liverpool University, Jiangsu, China
Keywords:
Big Data, Data Modeling, Smart Buildings, Energy Consumption, Optimization.
Abstract:
In the paradigm of Internet of Things new applications that leverage ubiquitous connectivity enable - together
with Big Data Analytics - the emergence of Smart City initiatives. This paper proposes to build a closed loop
data modeling methodology in order to optimize energy consumption in a fundamental smart city scenario:
smart buildings. This methodology is based on the fusion of information about relevant parameters affecting
energy consumption in buildings, and the application of recommended big data techniques in order to improve
knowledge acquisition for better decision making and ensure energy efficiency. Experiments carried out in
different buildings demonstrate the suitability of the proposed methodology.
1 INTRODUCTION
Recent advances in Internet of Things (IoT) technolo-
gies (Wortmann et al., 2015) have led to ever increa-
sing deployments of sensors, computing infrastruc-
tures and data proliferation in all aspects of daily life.
This opens opportunities to analyze and increase the
efficiency of existing solutions as well as to provide
completely new and innovative services in modern
cities. At global scale, cities represent three quar-
ters of the energy consumption and contribute 80%
of CO2 emissions (Provoost, 2013). In this context,
buildings are major consumers of energy that pro-
duce significant amounts of Green House Gas (GHG)
emissions. Therefore, improving energy efficiency in
buildings is a main target so as to address resource
scarcity and realize international climate preservation
goals.
During last years several analysis about energy
efficiency in buildings have been carried out (Agar-
wal et al., 2010). Nevertheless, most of the proposals
to date only provide partial solutions to the problem
(Foucquier et al., 2013). The high volume of data
that can be generated by smart cities provides a great
scenario to implement Intelligent Building Manage-
ment Systems (IBMS). In this sense, Big Data Ana-
lytics (Iqbal et al., 2016) helps us to leverage the huge
amounts of data provided by IoT-based ecosystems to
reveal insights that help extract knowledge from them.
In this paper we propose a methodology to op-
timize the energy consumption of buildings through
IoT technologies and the application of big data tech-
niques. With the goal of providing anticipated respon-
ses to ensure energy efficiency in buildings, we iden-
tify the main drivers of energy use in building heating
systems - which implies the major energy consump-
tion in buildings - in order to model their impact using
all the information provided by sensors installed in
buildings and in their surrounds. These models are
used later to design optimal control strategies to save
energy. In order to carry out these steps, we propose
a general data-driven identification methodology to
build a closed loop data modeling system for energy
consumption optimization in buildings. Thus, focu-
sing on the heating systems of buildings, we apply our
proposed methodology to define optimal strategies to
achieve minimum energy use, subject to specific in-
door comfort targets. Finally, we verify our metho-
dological approach through different experiments in
daily heating system operation of several reference
buildings. Hence, the contributions of this paper are
as follows:
• Design of a methodology to build closed loop
data modeling systems for buildings in order to
Moreno, V., Ferrer, J., Díaz, J., Bravo, D. and Chang, V.
A Data-Driven Methodology for Heating Optimization in Smart Buildings.
DOI: 10.5220/0006231200190029
In Proceedings of the 2nd International Conference on Internet of Things, Big Data and Security (IoTBDS 2017), pages 19-29
ISBN: 978-989-758-245-5
Copyright © 2017 by SCITEPRESS – Science and Technology Publications, Lda. All rights reserved
19

optimize their energy consumption through IoT
technologies and the application of big data tech-
niques.
• Application of such methodology in different
buildings to get energy savings considering data
coming from different sources.
The remainder of this paper is structured as fo-
llows: Section 2 identifies main parameters affecting
energy consumption of heating systems in buildings
and describes the main foundations of our methodo-
logy. Section 3 describes the different applications of
the proposed methodology pursuing the energy con-
sumption optimization acting over the building heat-
ing operation. Section 4 analyzes the main results ob-
tained after experimentation. Finally, Section 5 gives
some conclusions and an outlook of future work.
2 DATA MODELING FOR
ENERGY EFFICIENT
BUILDINGS
2.1 Parameters Affecting Energy
Consumption and Thermal Comfort
in Buildings
Different energy consumption profiles are associated
to buildings with different functionalities and proper-
ties. Therefore, when selecting sensors to be installed
in a building with energy efficiency aims, previously
it is necessary to carry out an initial characteriza-
tion of the main contributors to the building energy
use. At this regard, there are some mathematical mo-
dels which describe the thermal comfort responses of
buildings considering the impact of different factors,
for instance the models given by ASHRAE (Berglund,
1977). After analyzing these models, we describe in
this section the main parameters identified as relevant
due to their impact in the energy consumption and
thermal conditions of buildings. So, all these para-
meters should be monitored, analyzed and modeled
before implementing any optimum heating strategy to
save energy. The identified parameters as relevant are
the following:
• Environmental Conditions. The energy con-
sumption of buildings associated to heating sys-
tems is directly related to parameters such as tem-
perature, humidity, wind speed and solar radia-
tion.
• Occupants’ Behaviour. Occupants’ behaviour
is a relevant parameter which affects energy con-
sumption of buildings. In order to quantify its im-
pact, firstly it is necessary to solve the indoor lo-
calization problem and try to infer the occupants’
activity level.
• Information about Energy Consumption. Ha-
ving the real value of the energy consumed every
day even every hour lets users acquire know-
ledge about the impact of their performance on
the energy waste. Furthermore, this information
is useful in order to identify and adjust any devia-
tion between the predicted energy consumption
and the measured value.
• Information about Energy Generated. In such
cases where there are alternative energy sources,
knowing the value of the energy generated any-
time can be used to balance the energy consump-
tion of the building. Therefore, values about
the energy generated associated to the specific
contextual features can be used to model the
energy generation. This lets us to design opti-
mal energy distribution and usage strategies to get
more energy-efficient buildings.
Once we have data about these parameters, it is
possible to implement a data-driven model identifica-
tion to address the model representation of the heating
system to be controlled.
2.2 Data Model Identification
There are several proposals in literature regarding to
data model identification. Hence we can find the so-
lution proposed by SEMMA, an acronym for Sample,
Explore, Modify, Model, Assess used by USA Insti-
tute Inc., or CRISP-DM, an acronym for CRoss Indus-
try Standard Process for Data Mining as defined by
the CRISP-DM consortium (Wirth and Hipp, 2000),
and also there is the solution based on the KDD-
process (Liu and Motoda, 2012). The proposal given
by CRISP-DM has been developed by a consortium
of large companies (such as NCR, Daimler and SPSS)
and appears to be the most widely used process model
for intelligent data analysis today. It consists of six
phases explained in (Berthold et al., 2010).
Inspired by CRISP-DM, we formulate our own
methodology to build a closed loop data modeling
system reusing the already installed building infras-
tructure, turning legacy buildings into smart build-
ings. This methodology applies big data techniques to
steer building operation towards higher levels of effi-
ciency in daily operation. In summary, the proposed
methodology consists of the steps showed in Figure
1.
Big data techniques are applied mainly in the data
modeling step of this methodology. Big data tech-
IoTBDS 2017 - 2nd International Conference on Internet of Things, Big Data and Security
20
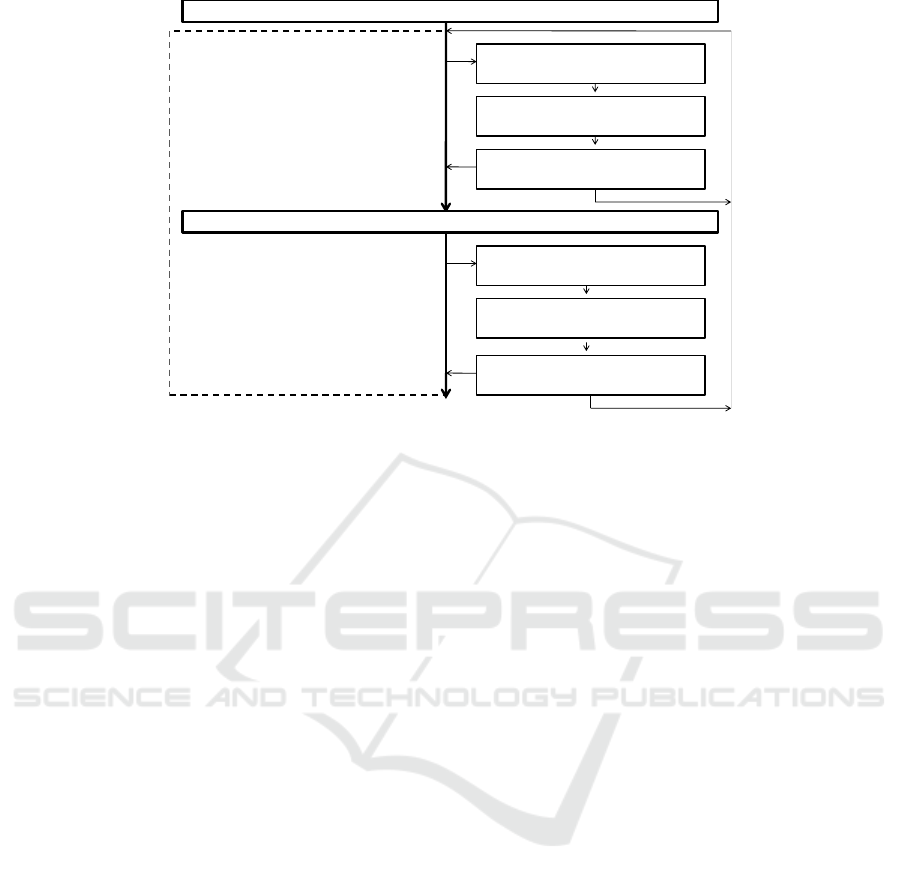
Offline phase
Data management
Data modeling
Simulation and validation
What data do we have available?
Is the data relevant to the problem?
Is the data quality, quantity, recency sufficient?
Which data should we concentrate on?
How is the data best transformed for modeling?
What is the best technique/method
to get the model?
How well does the model perform
technically?
Predict and optimize
Actuate
Based on the generated models and the real-
time data
Control of the building infrastructure
Continuous adaptation of the predicted
models based on prediction errors (optional)
Adaptation
Prediction error
Deviation
model
Online phase
Energy savings
Figure 1: Steps of the data-driven methodology proposed for energy consumption optimization.
niques can be classified into three categories accor-
ding to their goals: descriptive, predictive and pres-
criptive (LaValle et al., 2011). In our methodology we
implement the three categories as described in next
subsections.
2.2.1 Application of Descriptive Big Data
Analysis
For such sensor readings with event-based nature it
is needed to carry out the data processing in a timely
manner. This task is undertaken following descrip-
tive big data techniques. In our case, we are going
to apply Complex Event Processing (CEP) approa-
ches (Cugola and Margara, 2012) in order to follow
a condition-action paradigm able to filter, correlate
or aggregate several streams of events. Unlike other
rule-based approaches, the key feature of the CEP
approach is that it is specially designed to operate in
nearly real time.
2.2.2 Application of Predictive Big Data
Analysis
For such sensors reporting data with a predetermined
frequency it is possible to generate predictive mo-
dels representing the behaviour patterns of the sensed
phenomena through the application of predictive big
data techniques. In this case, firstly, it is necessary
to carry out the identification of the influential pa-
rameters by exploratory data analysis (for instance,
cross-correlation analysis). Once selected the relevant
parameters affecting energy consumption and indoor
comfort, it is time to transform relevant data into in-
put feature vectors of the models. In this case, when
studying the different aspects affecting heating energy
consumption and indoor temperature trends in build-
ings, we follow a general process to generate the pre-
dictive models which can be used to design optimiza-
tion strategies for the heating operation. The predic-
tive data modeling process followed is summarized
below:
1. Partitioning of input feature vectors into train-
ing data set (75%) and test data set (25%) (since
these proportions respond very well to our mode-
ling problem and because they are the proportions
usually applied in literature).
2. Normalization of each input feature of the training
data set to be centered around the origin with a
standard deviation of 1.
3. Investigation whether the application of Princi-
pal Components Analysis (PCA) to the input fea-
tures and retaining principal components accoun-
ting for 90% of feature variation improves model
accuracy.
4. Model training with 10-fold cross validation and
5 repetitions.
All these steps can be covered using different ana-
lytic tools: R, python, Matlab, etc. In our case we use
the open source statistical software R. From related
work in the building energy domain, we identify se-
veral regression techniques as applicable to the stud-
ied context. Applying the mentioned predictive mo-
deling process, we evaluate each technique in terms
of their predictive performance. Then, the best per-
forming models will serve later as input of the heating
optimization phase. To find the optimal configuration
A Data-Driven Methodology for Heating Optimization in Smart Buildings
21
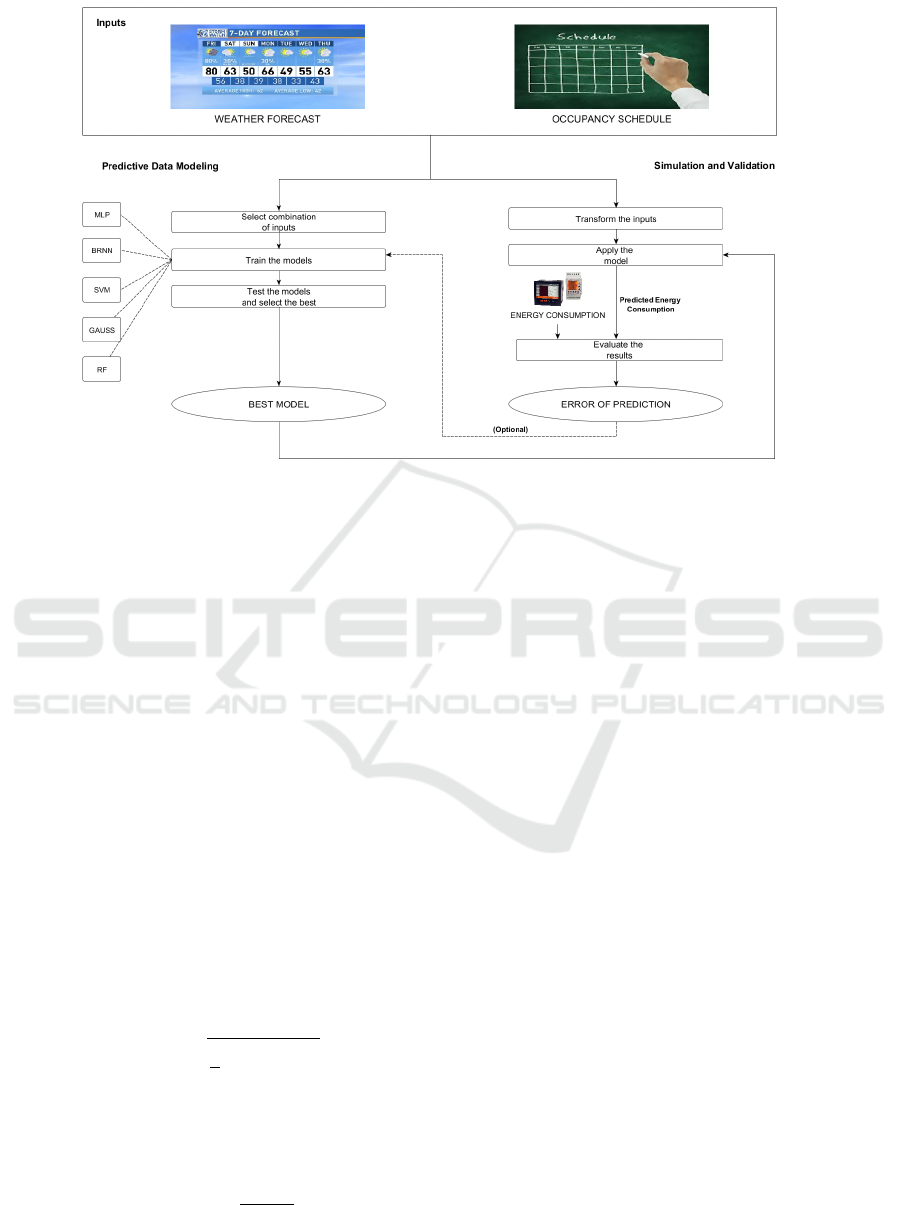
Figure 2: Example of strategy to predict energy consumption of buildings based on weather forecast and occupancy schedule.
of the tuning parameters of each one of the evalua-
ted techniques, we use the R Package caret (Kuhn,
2008). So, to achieve the best model performance on
the test set we apply: (i) a grid search on the method’s
tuning parameters; (ii) different possible combination
of BMS data as input feature vectors; and, (iii) the bi-
nary choice whether to use PCA based input feature
transformation or not. Taking into account the domain
specific metrics to assess each model’s performance,
we use the following performance indicators:
• The test data performance is evaluated with the es-
tablished Root Mean Squared Error (RMSE) (see
Eq. (1)) and R-Squared (R2) metrics.
• After a test for normality of the residuals, the
RMSE’s standard deviation (SD) provides infor-
mation on model stability.
• To understand the magnitude of the RMSE of each
model, we examine the RMSE in relation to the
observed mean of the regressed variable (denoted
as CVRMSE, see Eq. (2)).
RMSE =
s
1
n
n
∑
i=1
(y
i
− ˆy
i
)
2
(1)
where ˆy
i
is the value predicted by the model and
y
i
is the value actually observed.
CV RMSE =
RMSE
¯y
(2)
where ¯y is the mean of the values observed.
Figure 2 shows a schema of the predictive data
modeling process applied to generate energy con-
sumption models, considering as inputs the building
environmental conditions and the occupancy pattern.
2.2.3 Application of Prescriptive Big Data
Analysis
A kind of optimization solution is proposed in this
work applying a prescriptive approach for the data
modeling step based on Genetic Algorithms (GAs).
We use the GA implementation provided by R in the
genalg package (Willighagen, 2005). Focusing on the
optimization of the heating operation for example, we
try to keep thermal comfort conditions at the same
time that energy consumption restrictions are consi-
dered.
3 CASE STUDIES
Due to the fact that it is possible to find buildings with
different sensed data available (because their techno-
logical infrastructure may be different), we decide to
tackle independently the impact of each parameter
identified in Section 2 in building energy consump-
tion. It lets readers to decide how many parameters
they want to consider when implementing different
heating optimization strategies. This way, in this sec-
tion we explain the four case studies which address
the implementation of different heating optimization
strategies based on: (i) the prediction of environmen-
IoTBDS 2017 - 2nd International Conference on Internet of Things, Big Data and Security
22
tal conditions; (ii) the prediction of occupants’ be-
haviour; (iii) the provision of feedback to occupants
about energy consumption; and, (iv) the integration of
information about the energy generated by renewable
sources.
The three first case studies have been carried out in
the Technological Transfer Centre (TTC) of the Uni-
versity of Murcia (ttc, 2016). In this building there are
a lot of sensors, controllers and actuators deployed
and integrated in an automation system which co-
llects data and executes control actions with the aim
of improving the indoor comfort at the same time that
energy efficiency is ensured. The fourth and last case
study has been carried out in five different buildings
with similar features and located in five geographical
locations of Spain (the University and Solar Platform
of Almeria, Madrid, Soria and Asturias) with diffe-
rent climate conditions. These buildings are being
used for research purposes in the frame of the SSP-
ARFRISOL project (arf, 2016).
3.1 Case Study 1
For this first case study we have, on the one hand,
historical observations of temperature and humidity
collected in a weather station installed in the roof of
the TCC. This allows us to use univariate time se-
ries analysis, where the endogenous variable is go-
ing to be explained by its own antique performance.
When predicting outdoor environmental conditions,
we can consider time series models such as ARIMA
(Auto-Regressive Integrated Moving Average). They
have been widely used in order to predict tempera-
ture (Hippert et al., 2000), humidity (Shamsnia et al.,
2011), solar radiation (Hejase and Assi, 2012), wind
speed (Palomares-Salas et al., 2009), etc. In ARIMA
models the output is expressed as a function of past
values or lags (autoregressive part, see Eq. (3)) and
past errors or residuals (moving average part, see Eq.
(4)).
y
t
= µ +
p
∑
i=1
λ
i
y
t−i
+ ε
t
, (3)
where µ is a constant, λ
p
is the coefficient for the
lagged variable in time t − p and ε
t
is an error term.
y
t
= µ +
q
∑
i=1
θ
i
ε
t−i
+ ε
t
, (4)
The R package forecast (Hyndman and Khan-
dakar, 2008) permits to use an automation search of
the ARIMA parameters with the function auto.arima
(AA).
On the other hand, we have been also collec-
ting forecast data every hour with an horizon of 36
hours from external open data sources like Weather
Underground (und, 2016). This allows us to feed
the algorithm not only with past observations, but
also using this forecast variable as regressor. So,
we are going to consider also the AA with Regre-
ssors (AAR) and the programmed ARIMA by hand
(PA) with Regressors (PAR). Using the environmental
forecast, we can also apply different regressive tech-
niques implemented in R having as input the fore-
cast and as output the real environmental measure-
ments. Among others, we decide to evaluate the fo-
llowing techniques: Multi Layer Perceptron (MLP)
(Kalogirou, 2000), Bayesian Regularized Neural Net-
work (BRNN) (Hawarah et al., 2010), Support Vec-
tor Machines (SVM) (Fu et al., 2015), Gaussian Pro-
cesses with Radial Basis Function Kernel (GAUSS)
(Leith et al., 2004) and Random Forest (RF) (Zhao
and Magoul
`
es, 2012). Finally, it is also proposed the
combination of such techniques with the ARIMA pro-
cess described before.
We are going to base the pre-processing step
on the application of the Box-Cox transformation
(Robert H. Shumway, 2010), which stabilizes the
variance of the time series and also approximates it
to a normal distribution. In order to asses the model’s
stability over time we carry out a window rolling ana-
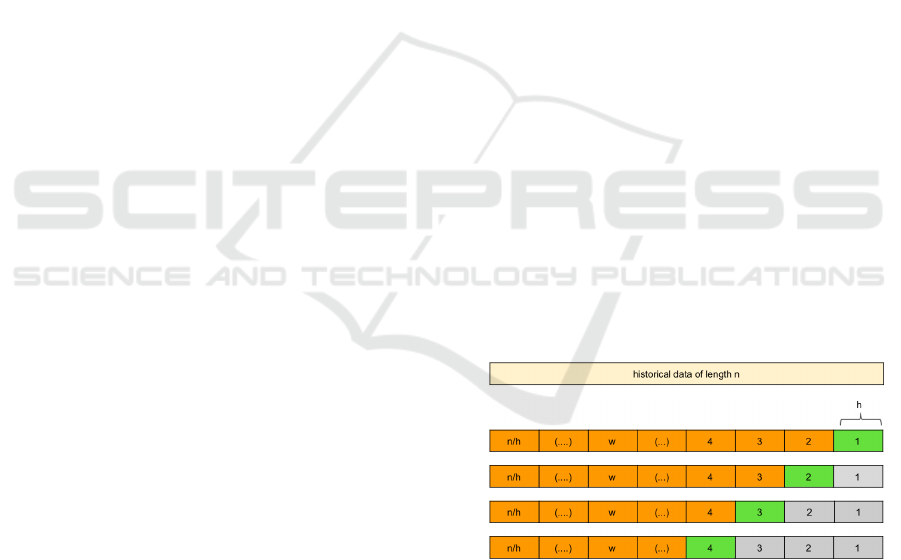
lysis of the performance. Traditionally, the rolling
window has had a fixed size through the sample but
we are sticking to the reality of the application when
considering all the previous observations to be part of
the train set, as can be observed in Figure 3, where for
each step the green block is the test set and the orange
block is the train set.
Figure 3: Rolling window schema.
When using the mentioned regressive techniques,
and following all the steps of the big data predic-
tive approach of our methodology (see Figure 2),
the best hyper parameters are selected and we pre-
dict the next horizon using the model, as we would
do in a real-time situation. The models are evalua-
ted using the rolling windows strategy for 50 win-
dows being the selected horizon of 24 hours. We
tried different ARIMAS: (1) Automatic without re-
gressors (AA); (2) 3 ARIMAs configured by hand
A Data-Driven Methodology for Heating Optimization in Smart Buildings
23

15 20 25 30
Confidence intervals errors temperature
CVRMSE
●
●
●
●
●
●
●
●
●
●
●
●
●
●
●
●
●
●
●
●
●
●
●
BRNN_AR
BRNN_A
MLP_A
MLP_AR
MLP
BRNN
RF
GAUSS
GAUSS_AR
GAUSS_A
RF_A
RF_AR
SVM_A
SVM_AR
SVM
A1R
A1
A2R
A2
A3
AA
A3R
AAR
●
●
●
●
●
●
● ●
●
●
●
●
●
●
●
●
●
●
●
●
●
●
●
●
5 10 15 20
8 10 12 14 16
24 h prediction vs real temperature
hour
temperature
●
●
●
●
●
●
●
●
●
●
●
●
●
●
●
●
●
●
●
●
●
●
●
●
●
●
real
predicted
Figure 4: Confidence intervals CVRMSE temperature (left) and 24 hours predicted temperature with BRNN
AR
vs real tempe-
rature (right).
without regressors (A1, A2, A3); and, (3) All with re-
gressors (AAR, A1R, A2R, A3R), having that the be-
tter performers are A1 and A1R. Then, for the com-
bination of these methods with the rest of machine
learning techniques, we have used the predictions
given by A1 and A1R. Consequently, we are go-
ing to consider 23 inputs candidates to use as in-
puts in this kind of model: external predictions
(BRNN, MLP, RF, GAUSS, SV M), univariate ARIMA
predictions (A1, A2, A3, AA), ARIMA with regres-
sor predictions (A1R, A2R, A3R, AAR), and the follo-
wing combined techniques: (BRNN
AR
, MLP
AR
, RF
AR
,
GAUSS
AR
, SVM
AR
) or without regressors (BRNN
A
,
MLP
A
, RF
A
, GAUSS
A
, SV M
A
).
In Figure 4 (left) we appreciate the confidence in-
tervals of the errors (CVRMSE) having that the best
one is BRNN combined with AR (BRNN
AR
). It re-
turns a percentage of error with mean 15.79%, and
lower and upper confidence intervals of 14.25% and
17.22%, respectively. Anyway, it is appreciable that
differences between the errors of the first five models
are almost indiscernible. Also, Figure 4 (right) shows
one day’s prediction using BRNN (Hawarah et al.,
2010) combined with AR compared with the real ob-
servations for temperature. Doing the same process
for humidity we have reached a CVRMSE of 17.13%,
and lower and upper confidence intervals of 14.6%
and 19.67%, respectively, when using also BRNN
combined with AR predictions (BRNN
AR
). These re-
sults are closely followed by MLP (Kalogirou, 2000)
with AR, MLP and BRNN. So, both for predicting
temperature and humidity in our target building, we
are going to use the combination of BRNN and AR.
Once we are able to predict outdoor temperature
and humidity, we are going to use such predictions to
infer the building energy consumption associated to
them. For this, we apply some of the same regressive
techniques as used before: BRNN, MLP, RF, GAUSS
and SVM. The reason to use the same techniques is
because they have been already proposed in literature
for this objective (Neto and Fiorelli, 2008). The best
results were obtained when using BRNN with 15 neu-
rons, obtaining an RMSE of 43.76 kWh, which only
represents the 10.29% of CVRMSE, and with the high
coefficient of determination of 0.89.
For the energy consumption optimization we im-
plement a prescriptive approach for the data mode-
ling step based on GA. To evaluate our GA-based op-
timization strategy in terms of energy savings, con-
trolled experiments were carried out in the TTC build-
ing during five consecutive weeks between June and
February of 2015. The results show that we can
accomplish energy savings between 10% and 22%.
3.2 Case Study 2
Our solution to the indoor localization problem is
based on a technological combination composed by
an active RFID system and some IR transmitters
(see our previous work published in (Moreno et al.,
2016)). The RFID tags of our solution are IR-enabled
tags which include an IR sensor which is powered by
an IR transmitter placed on the inside walls of the
building. The reference tags communicate with an
RFID reader covering each of the target localization
areas. Our localization mechanism uses the RSSI va-
lues corresponding to the reference RFID tags placed
on the ceiling. Both the IR identified and the RSSI
information collected in the RFID reader is used to
estimate the localization of the occupants wearing a
monitored RFID tag.
In order to select the best regression technique to
solve our localization prediction problem, we have
made a comparative between different regression
techniques once they have been applied to our pro-
blem (following the same predictive modeling pro-
cess as in the 1st case study). After comparing the
results obtained from k-Nearest Neighbors (KNN),
MLP, Extreme Learning Machine (ELM) and Radial
Basis Functions (RBF) (these techniques are already
IoTBDS 2017 - 2nd International Conference on Internet of Things, Big Data and Security
24

proposed in literature to solve this kind of problem),
the RBF was the technique that most accurate results
provided. So, we propose to use the RBF technique
for carrying out the user location estimation. Hence,
the RSSI tag value p
j
associated to the monitoring
RFID tag is provided as input to all functions of our
RBF estimator, and the output f (p
j
) is given by:
f (p
j
) =
c
∑
i=1
w
i
· ϕ(k p
j
− c
i
k) (5)
where k p
j
− c
i
k is the Euclidean distance bet-
ween p
j
and the RBF function with center c
i
. The
number of RBFs is C, and w
i
are the weights of the
network.
Hence, for each area covered by an IR transmi-
tter we have an RBF network implemented in order
to estimate the occupant position. Furthermore, with
the aim of ensuring that such position is possible ta-
king into account the previous positions of the target,
we implement for each RBF network a tracking me-
chanism which is used to filter each one of the esti-
mated positions. The tracking algorithm used to carry
out this stage of the proposed localization solution is
based on Particle Filters (PFs). Furthermore, every T
seconds the localization mechanism evaluates if there
are new measurements from the monitoring tag to es-
timate the next occupant’s location using the RBF net-
work already implemented. If there is updated in-
formation, the RBF network estimates the next target
position, but if it is not the case, the PF associated
to such RBF is applied to estimate the next position
based on the prior state of the target. Tracking pro-
cesses through PFs is the third and last step of our
localization mechanism.
Table 1: Accuracy results for different RFID reference tag
distributions.
Tag distribution Size (number of tags) RMSE (m.) SD (m.)
1m x 1m 1200 0.9 2.6
1m x 1.5m 1200 1.8 1.6
1m x 2m 1200 1.2 1
1.5m x 1.5m 1200 1.3 1.1
2m x 2m 1200 1.6 1.4
2m x 2.5m 1200 1.9 1.7
Taking into consideration different RFID refe-
rence tag distributions, the results obtained from the
tests performed in our test lab are represented as sta-
tistical values of the error achieved in the estimated
locations. Table 1 shows these results. As can be
seen, they are quite accurate according to the location
requirements imposed by indoor services, even using
a low number of reference tags.
After the identification and localization of occu-
pants inside the building, different profiles of ther-
mal comfort for each occupant are generated using
the default settings according to their preferences.
Figure 5: Percentage of mean daily energy consumption sa-
vings in heating considering occupants’ behaviour.
In this way, considering accurate localization infor-
mation and the occupant’s comfort preferences for
the heating management process, energy wastage de-
rived from overestimated or inappropriate settings are
avoided. However, when occupants do not feel com-
fortable they can change the provided thermal settings
according to their own preferences. For this, users are
able to communicate their preferences to the system
through the control panels of the home automation
system which are associated to their location. A des-
criptive data modeling is used to implement the op-
timization process able to update the corresponding
occupant profiles as long as these values are within
minimal thermal comfort levels (Berglund, 1977). On
the other hand, when several occupants are sharing
the same heating system, our control solution is able
to provide them with comfort conditions that satisfy
the greatest number of them, applying for this a GA-
based optimization strategy. After experimentation,
an average of 91% of success in the predictions of
the thermal comfort conditions for occupants was ob-
tained.
Thus, and finally, we apply rules over the whole
body of the available knowledge related to the occu-
pants’ localization and their comfort preferences to
make decisions related with the control of the auto-
mated heating systems. In this case, following a des-
criptive approach for the optimization phase (based
on CEP rules). For evaluating the energy savings we
could get following this approach, we carried out a
comparison between two consecutive months in the
winter of 2013: January, without any energy manage-
ment, and February, with our intelligent heating ma-
nagement system running. We compared the energy
consumption value for each day of February with the
consumption associated to the same day of the previ-
ous month. Because such year February was only of
28 days, we included in the comparison the first three
days of March to make a complete contrast for the 31
A Data-Driven Methodology for Heating Optimization in Smart Buildings
25

days of January. The energy saving obtained varied
between 14% and 25% (see Figure 5). Therefore, we
can state that the experimental results obtained reflect
clear energy savings.
3.3 Case Study 3
Energy monitoring technologies can help us to re-
duce energy consumption in buildings around 5% to
15% (Darby, 2006). These technologies are able to
provide real-time feedback on domestic energy con-
sumption. In this regard, there are studies which
state that providing feedback about energy consump-
tion to the occupants is one of the most successful
approach to let them acquire more knowledge about
the energy consumption profile of their buildings and
save energy (Fischer, 2008). In this way, occu-
pants can involve themselves with the goal of mak-
ing a more responsible use of the energy. Following
this approach, occupants can become into system co-
designers and final deciders of the control rules and
strategies implemented to save energy.
In our heating management system we provide
occupants with feedback about the hourly energy con-
sumption of the building and we consider the data
provided directly by them through their interactions
with the heating system when they change the com-
fort conditions provided to them automatically. Con-
sequently, the system learns and auto-adjusts accor-
ding to such changes applying for this a descriptive
approach for the data modeling of the optimization
strategy based on CEP rules. In order to evaluate
the energy saving impact of providing a user-centric
heating service in buildings, we carried out an experi-
ment during two months. During the first 31 days of
the experiment, occupants lacked any feedback about
the energy consumption as well as any control capa-
bility over the setting of the heating systems. After
this, during the last 31 days of the experiment, occu-
pants were empowered to participate. In this case,
they were asked to define their own rules for con-
trolling the heating operation. Furthermore, during
this second phase of the experiment, the building au-
tomation system was displaying real-time informa-
tion about the energy consumption in kW, cost of the
energy consumed according to the its price in the mar-
ket, energy usage history, etc. Comparing both situa-
tion, we were able to get extra energy savings of 9% at
building level when users were actively participating
with the energy building management system.
3.4 Case Study 4
The SSP-ARFRISOL is a singular strategic project on
bioclimatic architecture and solar cooling that tries to
demonstrate that this kind of architecture is suitable
to make buildings energy efficient. For this purpose,
five symbolic public buildings of offices, both new
and rehabilitated, are being analyzed theoretically and
monitored in real conditions of use after having opti-
mized its architectural design and its facilities. The
research goal of this project is to achieve that these
buildings uses between 10% and 20% of the conven-
tional energy thanks to the use of renewable energies
combined with passive strategies from the architec-
tural design of the building. In the same way, it is
desired to have reduction of the CO
2
emissions and
increase of the comfort.
Each building has a control and monitoring sys-
tem with a huge number of sensors, electrical and
computational infrastructure installed. Control is cen-
tered on systems - particularly HVAC systems; there
are a lot of sensors installed in its circuits at the points
of production, exchange and consumption (tempe-
rature, water flow, condition of pumps and valves,
power, etc.). The systems basically operate based on
a descriptive approach for the data modeling of the
optimization strategy, i.e. based on set points, de-
mand and timetable settings. Its management system
consists of controllers of the IQ3 family required to
perform the control of the different parts of the in-
stallation, and a central station as a system supervi-
sor which allows us to change schedules, temperature
set points, supervise historical data, states of different
machines, etc. It interacts through a SCADA. Figure
6 shows a screen shot in which we can see the mea-
surements taken in real time.
An important use of the control data is to make
energy analysis. Measurements allow us to estimate
a complete energy flow of the system: how much
energy is produced with conventional or renewable
origin, how much is lost in transport or storage, how
much is consumed in each terminal point, etc. The
monitoring system is more focused on the evalua-
tion of parameters such as the electricity consump-
tion according to the use, temperatures inside diffe-
rent rooms, air quality, external meteorological con-
ditions, use of the building, additional measures of
systems, etc. The variables and measurement points
have been selected with the aim of having them as
representative as possible. For the most critical points
and variables, redundancies have been established,
which have facilitated subsequent verification as well
to carry out researches on the subject. Global mon-
itoring is carried out on the buildings, and more ex-
IoTBDS 2017 - 2nd International Conference on Internet of Things, Big Data and Security
26

Figure 6: Deployments and measurements taken in real time.
haustive sets of enclosures/rooms are considered as
representative of each building. In the end, there are
about 200 sensors installed in each building. The con-
trol and monitoring systems complement each other:
the control system allows real-time interaction, and
the monitoring system performs a more exhaustive
and accurate sampling.
Energy saving strategies are individually tailored
to each building based on its location, resources and
climate. Active strategies are linked with an adequate
management of the energy to optimize its efficiency.
Some example of the strategies used are the follo-
wing:
• Heating and renewable DHW obtained through
solar collectors and biomass boilers.
• Renewable cooling by the combination of the so-
lar thermal field with absorption machines.
• Pre-cooling by radio-convective field.
• Geothermal energy (energy exchange systems),
suppression of cooling tower.
• Support of conventional energy by high efficiency
gas boiler.
4 DISCUSSION
In this section we are going to review the main results
obtained for each one of the case studies described in
the previous section.
• Case Study 1. Regarding to the application of
predictive big data analysis to estimate outdoor
environmental conditions, we have obtained that,
after comparing the predictive results of different
techniques, BRNN combined with AR predictions
are able to estimate outdoor temperature and hu-
midity with a CVRMSE of 15.79% and 17.13%,
respectively. Which are very suitable results con-
sidering that we are predicting in a horizons of 24
hours. Then, using both predictions we train the
model able to estimate the energy consumption
associated to the heating system. After analyz-
ing the results obtained with different regressive
techniques, the best performance is provided by
the BRNN technique with 15 neurons, getting the
10.29% of error percentage.
Finally, using the outdoor temperature and humi-
dity predictive models and the estimation of the
energy consumption, we implement an optimiza-
tion strategy based on a GA which is in charge of
indicating the optimal configuration of the heat-
ing system to ensure energy efficiency, at the same
time that thermal comfort restrictions are conside-
red. After carrying out some experiments apply-
ing such optimization strategy, we get mean daily
energy savings between 10% and 22%.
• Case Study 2. Regarding to the application of
predictive big data analysis to estimate indoor lo-
calization, we have obtained that, after comparing
the predictive results of different techniques, an
RBF network combined with PFs are able to esti-
mate occupants’ localization with a mean error of
0.9 m. and 1.9 m. considering a tag distribution
of 1m x 1m and 2m x 2.5m, respectively. Then,
applying a descriptive data analysis approach we
are able to estimate individual occupants’ comfort
preferences. But, for the cases when more than
an occupant are sharing a same heating system,
a GA-based optimization mechanism is executed
to infer the optimal comfort preference. After ex-
periments, we achieved a 91% of success in the
estimation of occupants’ comfort preferences.
A Data-Driven Methodology for Heating Optimization in Smart Buildings
27

Finally, using the indoor localization mechanism
and the prediction of occupants’ comfort prefe-
rences, we implement an optimization strategy
through CEP-based rules to control the heating
systems. After experiments running such opti-
mization strategy, we are able to get mean daily
energy savings between 14% and 25%.
• Case Study 3. Regarding to the approach of pro-
viding occupants with information about the real-
time energy consumption of the building, and then
let them configure their own control rules - which
are translated into CEP-based control rules - we
got an extra mean daily energy saving of 9% con-
sidering the actuation over the heating systems.
• Case Study 4. When alternative energy sources
are available in buildings, it is possible to imple-
ments control strategies for the heating systems
based on CEP-rules considering both bioclimat-
ics and built conditions. Then, after carrying out
several experiments in different buildings with di-
fferent features, we were able to get energy sa-
vings between 80% and 90%.
5 CONCLUSIONS AND FUTURE
WORK
In this paper, we analyze the main factors impacting
the energy consumption associated with provisioning
comfortable indoor temperatures in buildings. Af-
ter this, we formulate a methodology for data model
identification, modeling and control applying diffe-
rent techniques of big data.
Four case studios are implemented in different
buildings. They intend to demonstrate that energy
savings can be achieved when the individual impact
of each parameter affecting the energy consumption
in buildings is considered for controlling the heating
system. Thus, we are able to simplify the model relat-
ing the indoor thermal comfort provisioning and the
associated energy consumption of buildings. Never-
theless, different control strategies based on different
parameters could be running at the same time increa-
sing the total energy savings at building level.
The ongoing work is focused on this last issue,
i.e. the design of control strategies including simul-
taneously all the parameters addressed in this paper
for affecting energy consumption of heating building
systems.
ACKNOWLEDGEMENTS
This work has been funded by the Science and Tech-
nology S
´
eneca-Agency Foundation of Murcia Re-
gion (Spain) by means of the “Talento Investigador
y su Empleabilidad“ Program, Postdoctoral Category
(Consejer
´
ıa de Educaci
´
on y Universidades) (grant
19782/PD/15).
REFERENCES
(2016). SSP-ARFRISOL Project. www.arfrisol.es/arfrisol
portal/.
(2016). Technological Transfer Centre (TTC) of the Uni-
versity of Murcia. www.um.es/web/otri/contenido/ctt.
(2016). Weather Underground. www.wunderground.com/.
Agarwal, Y., Balaji, B., Gupta, R., Lyles, J., Wei, M., and
Weng, T. (2010). Occupancy-driven energy mana-
gement for smart building automation. In Proceed-
ings of the 2nd ACM Workshop on Embedded Sensing
Systems for Energy-Efficiency in Building, pages 1–6.
ACM.
Berglund, L. (1977). Mathematical models for predicting
thermal comfort response of building occupants. In
Ashrae Journal- American Society of Heating Refri-
gerating and Air-Conditioning Engineers, volume 19,
pages 38–38. Amer Soc Heat Refrig Air-Conditioning
Eng Inc 1791 Tullie Circle Ne, Atlanta, GA 30329.
Berthold, M. R., Borgelt, C., H
¨
oppner, F., and Klawonn,
F. (2010). Guide to intelligent data analysis: how to
intelligently make sense of real data. Springer Science
& Business Media.
Cugola, G. and Margara, A. (2012). Processing flows of
information: From data stream to complex event pro-
cessing. ACM Computing Surveys (CSUR), 44(3):15.
Darby, S. (2006). The effectiveness of feedback on energy
consumption. A Review for DEFRA of the Literature
on Metering, Billing and direct Displays, 486:2006.
Fischer, C. (2008). Feedback on household electricity con-
sumption: a tool for saving energy? Energy efficiency,
1(1):79–104.
Foucquier, A., Robert, S., Suard, F., St
´
ephan, L., and Jay,
A. (2013). State of the art in building modelling and
energy performances prediction: A review. Renewa-
ble and Sustainable Energy Reviews, 23:272–288.
Fu, Y., Li, Z., Zhang, H., and Xu, P. (2015). Using support
vector machine to predict next day electricity load of
public buildings with sub-metering devices. Procedia
Engineering, 121:1016–1022.
Hawarah, L., Ploix, S., and Jacomino, M. (2010). User be-
havior prediction in energy consumption in housing
using bayesian networks. In Artificial Intelligence and
Soft Computing, pages 372–379. Springer.
Hejase, H. A. and Assi, A. H. (2012). Time-series regres-
sion model for prediction of mean daily global so-
lar radiation in al-ain, uae. ISRN Renewable Energy,
2012.
IoTBDS 2017 - 2nd International Conference on Internet of Things, Big Data and Security
28

Hippert, H. S., Pedreira, C. E., and Souza, R. C. (2000).
Combining neural networks and arima models for
hourly temperature forecast. In ijcnn, page 4414.
IEEE.
Hyndman, R. J. and Khandakar, Y. (2008). Automatic time
series forecasting: the forecast package for R. Journal
of Statistical Software, 26(3):1–22.
Iqbal, R., Doctor, F., More, B., Mahmud, S., and Yousuf,
U. (2016). Big data analytics: Computational inte-
lligence techniques and application areas. Int. J. Inf.
Manage, pages 10–15.
Kalogirou, S. A. (2000). Applications of artificial neural-
networks for energy systems. Applied Energy,
67(1):17–35.
Kuhn, M. (2008). Caret package. Journal of Statistical
Software, 28(5).
LaValle, S., Lesser, E., Shockley, R., Hopkins, M. S., and
Kruschwitz, N. (2011). Big data, analytics and the
path from insights to value. MIT sloan management
review, 52(2):21.
Leith, D. J., Heidl, M., and Ringwood, J. V. (2004). Gau-
ssian process prior models for electrical load forecast-
ing. Probabilistic Methods Applied to Power Systems,
pages 112–117.
Liu, H. and Motoda, H. (2012). Feature selection for
knowledge discovery and data mining, volume 454.
Springer Science & Business Media.
Moreno, V., Zamora, M. A., and Skarmeta, A. F. (2016).
A low-cost indoor localization system for energy sus-
tainability in smart buildings. IEEE Sensors Journal,
16(9):3246–3262.
Neto, A. H. and Fiorelli, F. A. S. (2008). Comparison bet-
ween detailed model simulation and artificial neural
network for forecasting building energy consumption.
Energy and Buildings, 40(12):2169–2176.
Palomares-Salas, J., De la Rosa, J., Ramiro, J., Melgar,
J., Aguera, A., and Moreno, A. (2009). Arima vs.
neural networks for wind speed forecasting. In Com-
putational Intelligence for Measurement Systems and
Applications, 2009. CIMSA’09. IEEE International
Conference on, pages 129–133. IEEE.
Provoost, R. (2013). Smart cities: innovation in energy
will drive sustainable cities. [Online; Retrieved 28-
03-2016].
Robert H. Shumway, D. S. S. (2010). Time Series Analysis
and Its Applications With R Examples. Springer Texts
in Statistics. Springer, 2nd ed. edition.
Shamsnia, S. A., Shahidi, N., Liaghat, A., Sarraf, A., and
Vahdat, S. F. (2011). Modeling of weather parameters
using stochastic methods (arima model)(case study:
Abadeh region, iran). In International Conference on
Environment and Industrial Innovation. IPCBEE, vo-
lume 12.
Willighagen, E. (2005). Genalg: R based genetic algorithm.
R package version 0.1, 1.
Wirth, R. and Hipp, J. (2000). CRISP-DM: Towards a stan-
dard process model for data mining. In Proceedings
of the 4th International Conference on the Practical
Applications of Knowledge Discovery and Data Mi-
ning, pages 29–39. Citeseer.
Wortmann, F., Fl
¨
uchter, K., et al. (2015). Internet of
things. Business & Information Systems Engineering,
57(3):221–224.
Zhao, H.-x. and Magoul
`
es, F. (2012). A review on the pre-
diction of building energy consumption. Renewable
and Sustainable Energy Reviews, 16(6):3586–3592.
A Data-Driven Methodology for Heating Optimization in Smart Buildings
29
