
Using Process Indicators to Help the Verification of Goal Fulfillment
Henrique P. de Sá Sousa
1,2
, Vanessa T. Nunes
3
, Claudia Cappelli
4
,
Renata Guizzardi
5
and Julio Cesar S. P. Leite
2
1
Departamento de Matemática, UFRRJ, Seropédica, RJ, Brazil
2
Departamento de Informática, PUC-Rio, Rio de Janeiro, RJ, Brazil
3
Departamento de Ciência da Computação, UnB, Brasília, DF, Brazil
4
Departamento de Informática Aplicada, UNIRIO, Rio de Janeiro, RJ, Brazil
5
Departamento de Informática, UFES, Vitória, ES, Brazil
Keywords: Alignment, Business Process, Business Goal, and BPM.
Abstract: Process modelling is often criticized as lacking proper alignment with business goals. Although there is
literature on different proposals to address the issue, the verification of this alignment remains an obstacle
during process enactment. We make use of key process indicator (KPI) in a process design method to
annotate processes/activities with proper information. The method derives this information from the
business goals and uses it to calculate process indicators. We demonstrate through a real example, modelled
with the ARIS business process model tool, how the method produces proper indicators, which should be
used during process enactment.
1 INTRODUCTION
Business processes models allow the organization to
document information about how it works and help
monitoring organizational development,
modifications and evolutions, in an effective way.
Business processes translate inputs into outputs
creating products, while aiming at achieving goals.
Therefore, we may infer organizational goals
through its processes goals. However, the relation
between processes and goals are not always explicit
and such relations are in general, difficult to
determine.
In order to verify process-goal alignment, it is
not enough to determine the relationship of goals
and processes in a model. It is necessary to define
which elements in the process can help us check if
these alignments are correct and consistent within
the organizations. This is discussed in profusion in
academia, (Guizzardi and Reis, 2015), (Sousa and
Leite, 2014), (Cardoso et al., 2011), (Cappelli et al.,
2010), (Behnam, 2010), (Braubach et al., 2010),
(Singh and Woo, 2009), (Soffer and Wand, 2005)
and (Kueng and Kawalek, 1997), but the state of
practice is still far from these proposals. Difficulties
are numerous, from lack of understanding of the
appropriate level of goals’ abstraction, exacerbated
focus on operational layer, the lack of and effective
ability to measure goals achievement through
business processes execution, to the absence of
appropriate computer support (Cardoso et al., 2011),
(Behnam, 2010), (Braubach et al., 2010), (Singh and
Woo, 2009).
This is particularly present in the scenario of
organizations that model their processes without
identifying and organizing their goals beforehand.
Another issue is that the majority of the business
process model tools available in the market, such as
ARIS tool (ARIS, 2016), while enabling a goal
macro viewpoint through a relation between goal
diagrams and value-chain models, still have different
sort of problems. Some of these problems are: (i)
lack of differentiation between functional and non-
functional goals; (ii) difficulty in identifying
whether the process has activities that when
performed satisfactorily comply with desired goals;
(iii) difficulty in identifying process activities in
which the artefacts used to measure the goals are
produced; (iv) difficult in identifying the actors
responsible or involved in meeting specific goals (in
particular, strategic ones).
The imprecise definition of these elements is due
to the low expression of the goal modelling
languages adopted by these tools. These limitations
Sousa, H., Nunes, V., Cappelli, C., Guizzardi, R. and Leite, J.
Using Process Indicators to Help the Verification of Goal Fulfillment.
DOI: 10.5220/0006239303450352
In Proceedings of the 19th International Conference on Enterprise Information Systems (ICEIS 2017) - Volume 3, pages 345-352
ISBN: 978-989-758-249-3
Copyright © 2017 by SCITEPRESS – Science and Technology Publications, Lda. All rights reserved
345

contribute negatively by decreasing, for example,
the ability to assess project risks, the identification
of possible points of failure, the mitigation of
impacts on processes and goals changes, and often
even the prevention of the projection of most
appropriate solutions in a timely manner to attend
internal and external demands.
In this context, this paper presents a method
based on the relationship among goal models,
business processes models, and key performance
indicators (KPIs) to enhance the support for the
analysis of the alignment between processes and
goals. KPI’s are elements that can measure the
achievement of a goal and is calculated using
information produced during process execution. This
analysis enables the verification of business process
capability in producing the information necessary
for the calculation of process indicators, which
allows the verification of goals fulfilment. Thereby,
we seek to provide a solution for the alignment
between process and goal to be obtained and
analysed satisfactorily; avoiding the difficulties
mentioned and allowing the organization to
effectively ensure that processes are modelled in
order to achieve its strategic goals. An overall
strategy related to this proposal was presented in
(Sousa and Leite, 2014), which summarizes Sousa's
dissertation (Sousa, 2012). In this paper, we focus on
the information needed to treat indicators as part of
business processes in the ARIS framework.
The proposed method was used in an industry
real case study, using ARIS platform and supported
by the development of a "script" on ARIS Design
platform, which enables the automation of the
proposed analysis. At the end, a final report
containing information about all the elements
involved is presented (e.g., actors, activities,
information, indicators, goals and processes).
This paper is organized as follows: Section 2
presents related works, Section 3 shows the proposal
and the method used in this work, Section 4 apply
the method in a real scenario, Section 5 explain how
the method was automated in ARIS tool and Section
6 presents conclusions and future works.
2 RELATED WORK
This is not a new issue. Some proposed ideas
indicate forms of organization, formal establishment
and practices for the implementation and evaluation
of the alignment between processes and goals.
Kueng and Kawalek (1997) presented a
methodology to model and evaluate processes at a
conceptual level that supports the specification of
goals and the fundamental purpose of a designed
system. To do so, one ought to (a) define the goals
related to the business process, goal measurement
criteria and constraints; (b) derive and define the
business activities; (c) describe and define roles; and
(d) model the objects that will contain the obtained
information. Although the authors’ aims are
correlated to our, they don´t focus on what is
required for the goals to be systematically measured.
They pose a strong focus on the relation among
goals, activities and how to support process
automation through an object-oriented approach.
An extensively used approach is the Balance
Score Card (BSC) (Kaplan et al, 1996) that guides
organizations on how to translate its mission and
strategy into goals. BSC establishes a
comprehensive set of performance measures that,
when associated to business processes allow the
alignment checking between goals and processes.
However, it is not possible to find out the alignment
between goals and processes.
OMG developed the Business Motivation Model
(BMM) (OMG, 2008), which seeks to provide a
framework for the development, communication and
management of business goals by identifying the
factors that motivate their establishment and the
elements that are part of business plans. The model
presents how these elements and goals are
interrelated through policies and business rules.
Thus, a BMM model seeks to answer, primarily, to
two major questions: a) what is required to achieve
organization’s desires? b) why does each element in
the business plan exist? Although supporting a
person to answer these two questions, BMM does
not try to identify which are the processes and or
activities achieved by each goal.
Other researchers as (OMG, 2008), (Almeida and
Guizzardi, 2008), (Kavakli and Loucopoulos, 2006),
(Yu et al., 2006), (Bresciani et al., 2004), (Liu and
Yu, 2004), (Cysneiros et al., 2003), (Guizzardi et al.,
2003), (Yu, 1996), (Davenport, 1993), have shown
the representation of intentionality in the process
models as a possible solution in order to guarantee
the alignment between goals and business processes.
The explicitness of intentionality seeks to represent
the dependencies between processes and the actors'
needs and desires. It is believed that through this
kind of representation, one can ensure alignment
between goals and processes. However, these works
do not respond what to do with the tons of goal and
process models that are currently already part of the
organizations’ model repositories. Our work on the
other hand may be applied to pre-existing goal and
ICEIS 2017 - 19th International Conference on Enterprise Information Systems
346

process models.
Some approaches focus on the alignment among
different methodologies and tools as Koliadis (2006)
who proposes methodologies to guide analysts to
reflect changes in a i* model (Yu, 1996) (that
represents goals models) into a model using
Business Process Model Notation (BPMN) (that
represent process models) and vice versa. Neiger
and Churilov (2004) follow the same line describing
a framework for integrating business processes
(modelled in ARIS using event-driven process chain
– EPC - notation) and goals (modelled on VFT
framework - Value Focused Thinking - of decision
sciences). These works are interesting especially
because the proposed methods can be applied in
both directions (i.e. goals to processes and processes
to goals). However, the alignment is intuitively
indicated rather than presumed by the indicators, as
in our work. In this respect, we believe our work
provides stronger proof of alignment than the cited
ones.
Other approaches propose the implementation of
part of the methodology through the analysis of the
models generated by various methods, but with
technological constraints that currently do not meet
market needs, such as the one proposed by Halleux
et al. (2008).
Researchers such as Nurcan et al., (2005)
propose a reformulation on the way of thinking in
processes through process modelling oriented to
maps that consist of a representation system based
on intentions and strategies. This map is able to
abstract from business processes details to
emphasize organizational goals and their
satisfaction. Although it is extremely interesting
from a strategic point of view, its use in
organizations requires a reformulation in the way
processes are modelled.
del-Río-Ortega et al. (2012) proposed the
PPINOT metamodel that is based on Process
Performance Indicators (PPI) which are linked to
process elements. In our approach we depart from
the detailment of goals requirements in terms of
business process elements that are used to express
goal satisfaction.
Guizzard et al. (2015) proposed a method that
supports the identification of the activities in a
business process that satisfy organization’s goals.
This work focuses on the alignment between
processes and goals in the operational level by
translating process models into i* models. We go
further into exploring this alignment using indicators
and analysing the existence of the necessary
information to verify goals-process alignment in
their original notation.
For all seen, there are still gaps regarding a
precise verification of operational processes models
to be considered suitable for a performance analysis
in relation to its intended goals. We are convinced
that procedural BPM methods are useful and more
naturally elicited from stakeholders. We understand
that our proposal, by integrating business process
models with goal models, will profit from the fact
that several organizations have their business
processes modelled.
3 THE PROPOSAL
In ARIS, the Organizational Value Chain is
composed by macro processes that can be
decomposed into other processes. A process can
contribute to the achievement of one or more
organizational goals. All defined goals must be
related to at least one process.
Each existing goal in an organization (regardless
of the level of abstraction) requires that a set of
conditions be satisfied in order to the goal can be
considered fulfilled. The term "condition" refers, for
example, to the development of a product, to a
process status, to the production of some
information, to the triggering of a specific event or
anything that can be reached from the execution of a
process. These conditions (or set of conditions)
expected by a goal are defined by elements named as
"indicators". When indicators are linked to goals
they express the conditions that must be reached in
order to consider the goal satisfied. When
interconnected with processes they represent the
conditions that are expected to be reached by a
process instance. There is a smoothly difference,
based on the level of abstraction and perspective.
The business process is accomplished by
executing a set of activities. The successful
conclusion of the process is entirely related to the
production of the necessary conditions for fulfilment
of their goals. That is, the process is responsible for
producing all the expected conditions in order to
achieve the goals related to it. The production of
these conditions is closely linked to the different
states and transformation of information that is
processed during the execution of activities.
As the natural execution of the process generates
the different conditions necessary to achieve the
goals of the process, it is understood that the
indicators must be defined according to the
production of these elements during their execution.
The elements produced by the process are vestiges
Using Process Indicators to Help the Verification of Goal Fulfillment
347
that indicate if the process actually produced what is
expected, which is defined by the indicators.
Therefore, the elements that are needed to
calculate an indicator are produced in the process
(generally modelled as a product (output) of the
activities). Considering these elements, we
addressed the pre-conditions necessary for the
enactment of a given indicator. Namely, if there is
an absence of information necessary for a given
indicator at design time, we report the possibility of
misalignment among goals and processes.
As such, our work presents a method that checks
the possibility of fulfilment of the goals of a
business process, at design time, making possible a
future analysis of the information generated during
process execution.
3.1 The Method
The proposed method has 5 phases as presented
below:
1. Identify the goals of the process: list the goals
that must be achieved by the process.
2. Identify the purpose of the indicator: define
KPIs that must express the goals satisfaction.
3. Identify the target for the indicator: Identify the
targets for each process goal.
4. Correlate information to calculate the indicator:
Identify and list information needed to
calculate each indicator.
5. Identify the sources of information needed to
calculate the indicator: Check if the
information needed to calculate each KPI are
produced in the related processes or comes
from other processes.
In summary, the proposed method allows the
verification of whether the process produces the
necessary information to calculate the indicators
related to process goals. If so, business process and
goals models are said to be aligned. However, if
some information is missing, then a potential
misalignment between process and goals is reported.
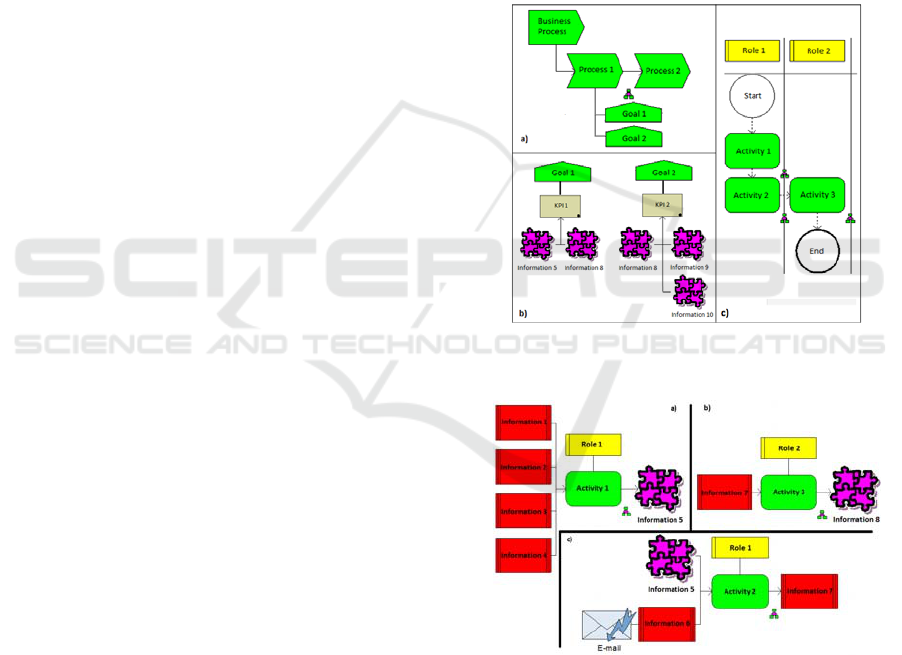
3.2 The Method through ARIS Tool
Figure 1a shows a VAC (Value Added Chain) model
using ARIS tool. It consists of a business process
that is decomposed into two sub-processes: Process
1 and Process 2. Process 1 has its identified goals
(goals 1 and 2). Figure 1b shows the KPIs 1 and 2 of
Goals 1 and 2 respectively and information used to
calculate each KPI. The alignment between goals
and indicators is done by checking where in the
process the information required for calculating
KPIs is produced. Process activities (Figure 1c) are
modelled in EPC language. Process 1 has two roles
(Role 1 and 2) and comprises three activities
(Activities 1, 2 and 3). There is also five information
entities (Information 5, 8 9, and 10). These
information entities are the data necessary to
calculate the KPI`s.
In ARIS tool, each activity can be detailed in its
operational level. Figure 2 (a, b, c) demonstrates
models of activities 1, 2 and 3 respectively,
containing roles, input and output information. The
rectangles represent input or output information
handled during process execution. Information
represented as a puzzles are the ones used to
calculate the KPI’s.
Figure 1: a) Business Process x Goal, b) Goal X Indicator
X Information, and c) Process 1 in detail.
Figure 2: Activities X roles X inputs X outputs.
By analysing the activities of the Process 1, it is
possible to verify that the information needed to
calculate KPI 1 is being produced by activities 1 and
3. However, KPI 2 cannot be calculated because
information 9 and 10 are not being produced by
process 1. Therefore, Process 1 can be verified only
in relation to Goal 1. The method permits to verify if
the process represents or even produces the
ICEIS 2017 - 19th International Conference on Enterprise Information Systems
348

necessary information to calculate the indicators
related to its goals.
4 APPLICATION IN A REAL
SCENARIO
In order to validate the proposed method, it was
applied in the process "Manage requests of project
practices support" of the IT department of a large
Brazilian oil and gas company. This process is
responsible for the analysis, prioritization,
implementation and monitoring of the demands that
come from the organization's business areas to the
Support Department related to Project Practices
(SPP). The process model, in ARIS, comprises 56
activities and is, therefore, too long to be displayed
in its entirety. Thus, its summary is described below:
The process begins with the identification of a
needed SPP service by the customer, who makes
his/her request. Next, the client's business area
manager has the possibility to inform whether he/she
wants to approve all requests from his/her area, only
be notified about the requests or even not being
notified. Upon arriving at the SPP, the demand is
received by the manager, who defines its nature and
decides if the demand can be attended by SPP. Then,
the effort to attend the demand is estimated (in terms
of man-hour) and the demand is analysed by a
responsible in charge, depending on the estimated
value (in HH or cost). If approved, the demand
returns to the manager who will delegate tasks to
performers and monitor the execution of the
attendance. Upon execution, the service is validated
by a validation group. It is approved or not by the
client and at the end he/she fills out a questionnaire
to evaluate the service.
The process "Manage requests of project
practices support" has two goals (defined by the
organization): "Ensure efficiency in attending SPP
demands" and "Ensure the management of SPP
demands attendance process". Due to space reasons,
only the alignment of the first goal is presented in
this section. To be achieved, this goal ought to be
measured, hence indicators (defined by the
organization) are used with this aim. Figure 3 shows
the four indicators necessary to verify the fulfilment
of this goal and the information used in their
calculation. The indicators are: "Adequacy and level
of plan attendance", "Time spent with planning",
"Compliance with effort estimates" and
"Compliance with data estimates". Each of these
indicators is calculated based on two or more
information. For example, the indicator
"Compliance with effort estimates" is calculated
based on the "Estimated effort" and "Real effort".
Figure 3: Indicators X Information of process “Manage
requests of project practices support”
Each indicator has associated with it a
calculation method (defined by the organization).
Table 1 shows each calculation method of the
indicators shown in Figure 3.
To check whether the alignment between the
process "Manage requests of project practices
support" and the goal "Ensure efficiency in attending
SPP demands" exists, it is necessary to identify if the
indicators related to this goal can effectively be
calculated during process execution. To this end, the
information used to calculate this indicator should
result from the execution of activities of that
process.
Table 1: Indicators X Calculation Method.
Indicator Calculation Method
Adequacy and
level of plan
attendance
Does not apply. The manager defines
the adequacy (low, medium or high)
and the level of depth (low, medium or
high) according to his/her experience
in attending demands and the SPP
historical information.
Time spent with
planning
TEMPL = (Planning Time / Estimated
effort) * 100
Compliance
with effort
estimates
EFFest-HH = (Real effort – Estimated
effort) / (Estimated effort) * 100
Compliance
with data
estimates
ESTIMATED_TIME = Estimated end
date – Estimated start date
REAL_TIME = Real end date – Real
start date
DATAest-T = (REAL_TIME –
ESTIMATED_TIME) /
ESTIMATED_TIME * 100
Taking the "Manage requests of project practices
support" process, we find three activities that
effectively provide the information for the
Using Process Indicators to Help the Verification of Goal Fulfillment
349
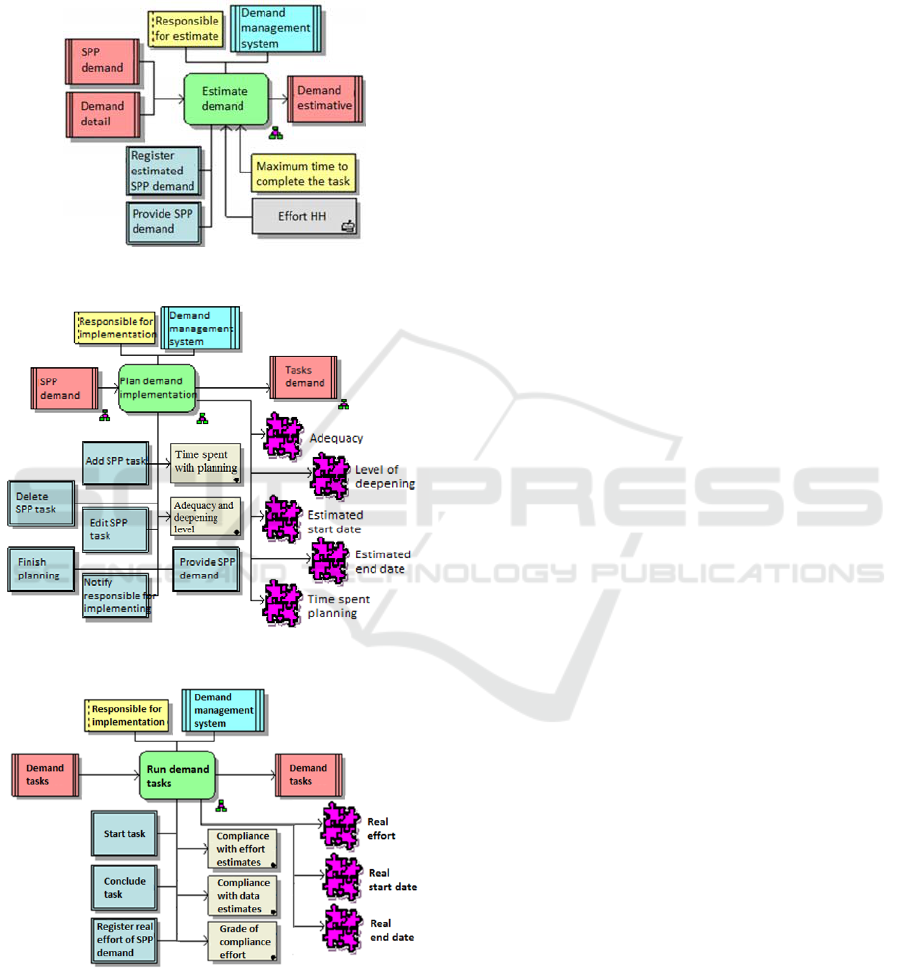
calculation of these four indicators. They are
"Estimate demand," "Plan demand implementation"
and "Run demand tasks". These activities are
presented in Figure 4, Figure 5 and
Figure 6
Figure 4: “Estimate demand” activity model.
Figure 5: “Plan demand implementation” activity model.
Figure 6: “Run demand tasks” activity model.
Analysing the models, it is possible to verify
that:
The indicator "Adequacy and level of plan
attendance" can be calculated based on the
information of adequacy and level of depth,
generated by the activity "Plan demand
implementation";
The indicator "Time spent with planning" can
be calculated based on the information of the
time spent with the activity "Plan demand
implementation" and on the information of the
estimation effort generated in the activity
"Estimate demand."
The "Compliance with effort estimates" can be
calculated based on the information of the
estimation effort resulting from the activity
"Estimating demand" and real effort, after the
"Run demand tasks" activity.
The "Compliance with data estimates" can be
calculated based on the information of
estimated start date and estimated end date
generated in the activity "Plan demand
implementation" and the information of the
real start date and real end date obtained from
the "Run demand tasks" activity.
As all indicators can be calculated from
information obtained in the activities of the "Manage
requests of project practices support” process, then it
is concluded that this process is aligned with the
goal "Ensure efficiency in attending SPP demands”,
and as such, during execution time, it is possible to
calculate possible detours in the process concerning
this specific goal.
5 METHOD AUTOMATION IN
ARIS
The ARIS Business Architect tool has a module
called Script Editor, which is an environment for
script programming. This module offers a set of
specific functions for manipulating elements from
the ARIS database created in the modelling
activities. These scripts can be programed to
navigate through objects and models extracting the
existent information, however, it is also possible to
create elements and models in an automated way.
In the extraction of elements information, ARIS
provides as output files the following formats: RTF,
PDF, HTML, TXT, DOC, XLS and XML. These
reports can feed databases and support services.
The script for our proposal automation was
developed to produce spreadsheets containing
information about the elements. It can be started
from a goal or a process. First, the script checks for
missing elements that would prevent its
implementation. If everything is correct, the script
ICEIS 2017 - 19th International Conference on Enterprise Information Systems
350
will tour the models and their objects, obtaining the
necessary information to fill in the fields of the
spreadsheet.
The report was developed in an XLS format. The
final XLS file has one spreadsheet for each element
(process or goal) involved and one containing
general summary.
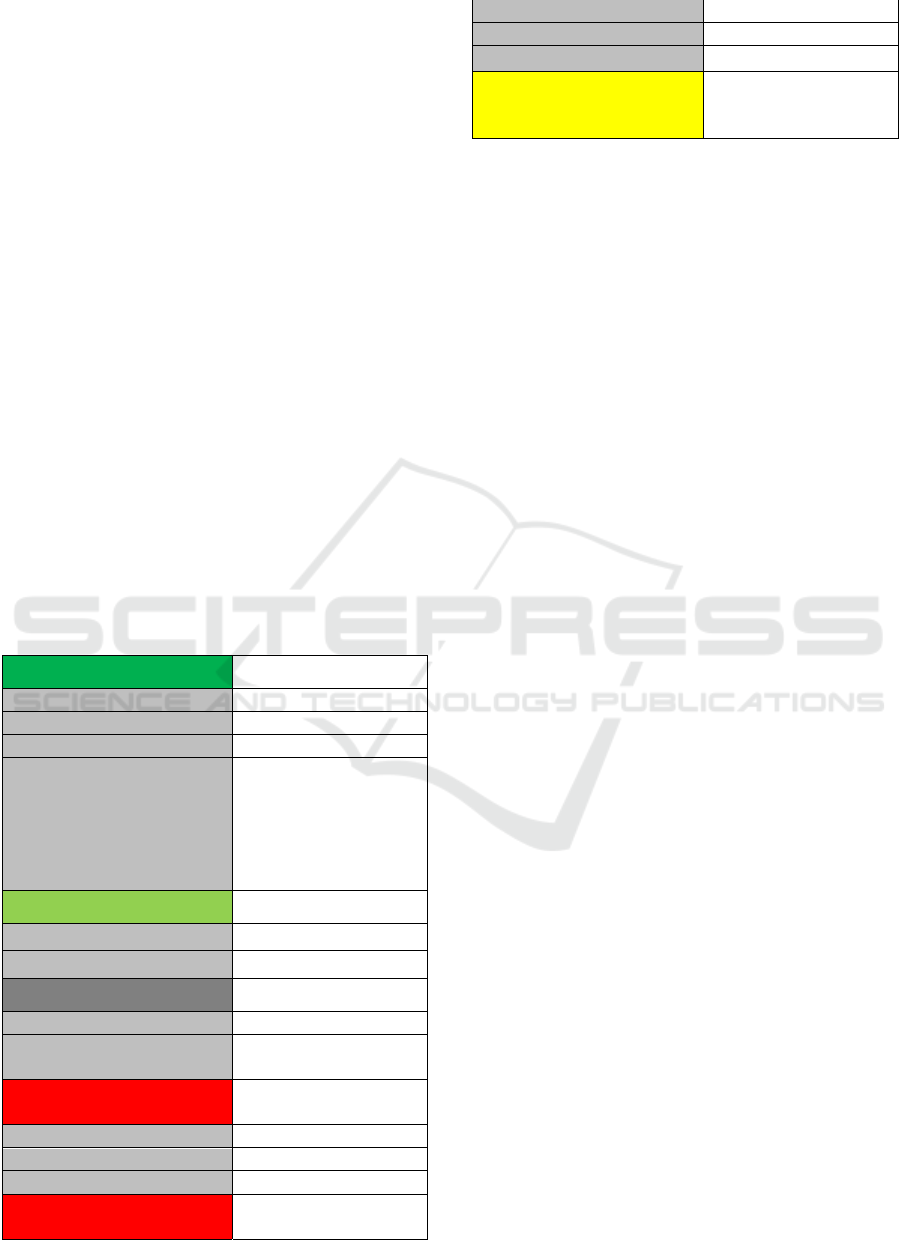
Table 2 shows an example of spreadsheet
generated from the analysis applied in a process that
has a relationship with the "Goal 1" (Figure 1). The
information is ordered as follows:
Information about the process that started the
script – name, description, name of goals related
with the process, name of the goals valued by the
script, all the information present in the process.
Information about the goal valued – name,
description, list of indicators names present in the
goal model.
For each indicator related with the goal, the
spreadsheet has: name, description and name of the
necessary information to calculate the indicator
witch are present in the indicators diagram.
For each of group of information the spreadsheet
has: name, description, name of activities where the
information is present in the process, followed by
their roles.
Table 2: Results from process analysis for Goal 1.
Process
Name Process 1
Goal(s) Related Goal 1; Goal 2
Goal evaluated Goal 1
Information been used in the
process
Information 1;
Information 2;
Information 3;
Information 4;
Information 6;
Information 7;
Goal
Name Goal 1
Indicator(s) related KPI 1;
KPI
Name KPI 1
Information necessary to
calculate KPI 1
Information 5;
Information 8;
Information necessary to
calculate KPI 1
Name Information 5
Activity Activity 1; Activity 2;
Role(s) Role 1;
Information necessary to
calculate KPI 1
Name Information 8
Activity Activity 3;
Role(s) Role 2;
Conclusion
All necessary
information to calculate
KPI 1 is in the process.
Finally, a list of the information present in the
indicators model and related to the indicators of the
evaluated goal that were not found in the process are
presented. If all information were found, the
spreadsheet shows a message informing of this
condition. As such, being an automated way to
detected problems with verification of alignment
during design time.
This same information structure is presented in
the other spreadsheets, but the general spreadsheet
(containing the summary of the analysis) will be
created only if exists one more goal or process to be
analysed.
6 CONCLUSIONS
Using modelled processes that are not aligned to the
organizational goals is risky. After all, organizations
must keep up with their own strategies, besides
assuring that organizational processes work towards
achieving such strategies. Nevertheless, the current
scenario shows that BPM methods do not effectively
solve the misalignment problem between goals and
processes. In an attempt to provide a solution for
that, our research provides a method, which has been
used with success in a real case study. The
experience showed that the method supports the
analysis of goals and business alignment, helping the
analyst to identify if there is any need for
reengineering. The paper describes the method and
exemplifies it by means of a case study. As such, we
show that it is possible to detect problems during
design time that will impose obstacles to
misalignment detection at execution time.
As usual, in modelling approaches, it is
paramount to provide effective automated support.
We could achieve the needed results in our case
study, by applying scripts with a first cut prototype.
Nevertheless, in that case, we faced some limitations
due to the BPM suite adopted in the organization
and the fact that it is a proprietary system. For the
future, we plan to provide more sophisticated
support to the user on identifying and analysing the
impact of alignments and misalignments of goals
and processes. Moreover, we also aim at applying
this method in other studies to confirm our findings,
Using Process Indicators to Help the Verification of Goal Fulfillment
351

and to integrate it to process runtime alignment
verification.
REFERENCES
ARIS, 2016. url: http://www.softwareag.com/corporate/
products/new_releases/aris9/overview/default.asp,
Accessed in: 10/11/2016.
Almeida, J.P.A., Guizzardi, G., 2008. A Semantic
Foundation for Role-Related Concepts in Enterprise
Modeling. In EDOC 2008, 12th IEEE International
Enterprise Computing Conference. IEEE Computer
Society Press, Munchen, Germany.
Behnam, S.A., Amyot, D., Mussbacher, G., 2010.
Towards a Pattern-Based Framework for Goal-Driven
Business Process Modeling. In Eighth ACIS
International Conference on Software Engineering
Research, Management and Applications. pp 137-145.
Montreal. Canada.
Braubach, L., Pokahr, A., Jander, K., Lamersdorf, W.,
Burmeister, B., 2010. Go4Flex: Goal-oriented Process
Modeling. In IDC-2010, 4th International Symposium
on Intelligent Distributed Computing. pp 77-87.
Tangier. Morocco.
Bresciani, P., Giorgini, P., Giunchiglia, F., Mylopoulos, J.,
Perini, A. Tropos: An Agent-Oriented Software
Development Methodology, In: Kluwer Academic
Publishers, Vol. 8, pp. 203—236. 2004.
Cappelli, C., Santoro F.M., Leite, J.C.S.P, Batista, T.,
Medeiros, A.L., Romeiro, C.S.C., 2010. Reflections
on the modularity of business process models: The
case for introducing the aspect-oriented paradigm, In
Business Process Management Journal. 16(4):
Emerald. pp 662-687.
Cardoso, E.C.S., Guizzardi, R.S.S., Almeida, J.P.A., 2011.
Aligning Goal Analysis and Business Process
Modeling: A Case Study in Health Care. In
International Journal of Business Process Integration
and Management. v 5. i 2. Inderscience.
Cysneiros Filho, G., Zisman, A. Spanoudakis, G.
Traceability Approach for I* and UML Models, In:
Proceedings of 2nd International Workshop on
Software Engineering for Large-Scale Multi-Agent
Systems (SELMAS’03), Portland, May, 2003.
Davenport, T.H., 1993. Process Innovation. Harvard
Business School Press, Boston, MA.
Del-Río-Ortega, M. Resinas, C. Cabanillas, A. Ruiz-
Cortés. On the Definition and Automated Design-
Time Analysis of Process Performance Indicators.
Information Systems, 2012.
Guizzardi, R.S.S, Perini, A., Dignum, V., 2003. Using
Intentional Analysis to Model Knowledge
Management Requirements in Communities of
Practice. Technical Report TR-CTIT-03-53.
Guizzardi, R., Reis, A.N., 2015. A Method to Align Goals
and Business Processes. In ER2015, 34th International
Conference. Stockholm. Sweden. pp 79-93.
Halleux, P., Mathieu, L., Andersson, B., 2008. A Method
to Support the Alignment of Business Models and
Goal Models. In BUSITAL'08, Proceedings of the 3rd
International Workshop on Business/IT-Alignment and
Interoperability. CEUR Workshop Proceeding.
Kaplan S., Norton P., Robert D., 1996. The Balanced
Scorecard: Translating Strategy Into Action. President
and Fellows of Harvard College. Boston. 1 ed.
Kavakli, E., Loucopoulos, P., 2006. Experiences with
Goal-Oriented Modeling of Organizational Change. In
IEEE Transactions on Systems, Man and Cybernetics -
Part C. v 36. I 2. pp 221-235.
Koliadis, G. G., 2006. A. Relating business process
models to goal-oriented requirements models in
KAOS. In Proceeding of Advances in Knowledge
Acquisition and Management., Pacific Rim
Knowledge Acquisition Workshop. pp 25-39.
Kueng, P., Kawalek, P., 1997. Goal-based business
process models: creation and evaluation, In Business
Process Management Journal, v 3. n 1. pp 17-38.
Liu, L., Yu, E., 2004. Intentional Modeling to Support
Identity Management, In ER 2004, 23rd Int.
Conference on Conceptual Modeling. Shanghai,
China. LNCS 3288. Springer. pp 555-566.
Neiger, D., Churilov, L., 2004. Goal-Oriented Business
Process Modeling with EPCs and Value-Focused
Thinking. In Business Process Management, LNCS
3080. pp 98– 115. Springer-Verlag Berlin Heidelberg.
OMG. 2016. Business Motivation Model, url:
http://www.omg.org/spec/BMM. Accessed in:
10/11/2016.
Nurcan, S., Etien, A., Kaabi, A., Zoukar, I., Rolland, C.,
2005. A Strategy Driven Business Process Modelling
Approach. In Business Process Management Journal.
Special issue on Goal-oriented business process
modeling. Emerald. v 11. i 6.
Singh, S.N., Woo C., 2009. Investigating business-IT
alignment through multi-disciplinary goal concepts.
Requirements Engineering, v 14. i 3. Pp 177-207.
Springer-Verlag. New York, Inc.
Soffer, P., Wand, Y., 2005. On the notion of soft goals in
business process modeling, Journal of Business
Process Management. v 11. n 6. pp 663-79.
Sousa, H.P., 2012. Integrating Intentional Modeling to
Business Modeling. Master’s Dissertation.
Departamento de Informática. PUC-Rio.
Sousa, H.P., Leite, J.C.S.P., 2014. Modeling
Organizational Alignment. Conceptual Modeling.
LNCS, v 8824. pp 407-414 Springer.
Yu, E., 1996. Modeling strategic relationships for process
reengineering, 181 f. Ph.D. dissertation, University of
Toronto, Toronto, Ont.,Canada.
Yu, E., Strohmaier, M., Deng., X., 2006. Exploring
Intentional Modeling and Analysis for Enterprise
Architecture. In EDOC2016, 10th IEEE International
Enterprise Distributed Object Computing Conference
Workshops. Proceedings of the Workshop on Trends
in Enterprise Architecture Research (TEAR). Hong
Kong, China.
ICEIS 2017 - 19th International Conference on Enterprise Information Systems
352
