
Global-Detector - GIS- and Knowledge-based Tool for a Global
Detection of the Potential for Production, Supply and Demand
Wil Hennen, Arjen Daane and Kees van Duijvendijk
Wageningen Economic Research, Wageningen University & Research, Alexanderveld 5, The Hague, The Netherlands
Keywords: Spatial Analysis, Knowledge-Base, Subjective Assessment, Face Validity, Production Potential, Location
Theory, Worldwide, R.
Abstract: Wageningen Economic Research has developed Global-Detector, a knowledge-based Geographic
Information System that aims to detect the worldwide potential for production, demand and market
strategies. At any spot in the world Global-Detector can show the values from a large amount of indicators,
such as climate, infrastructure, and land characteristics. A large set of indicators is readily available for use
without any GIS-processing, and the model builder together with the expert can instantly start building the
knowledge base for the concerning research aim. Knowledge from experts is applied to combine relevant
indicators to create new indicators. The concept of Global-Detector and 10 applications developed by this
tool are described. As a generic tool with increased flexibility, Global-Detector has many application
possibilities in a wide variety of fields.
1 INTRODUCTION
There is a growing trend towards
internationalization of the agri-food sector in order
to find new markets and reduce costs. Entrepreneurs
who want to expand their production or market
possibilities abroad are often faced with inadequate
and dispersed information about promising locations
in the world. To assemble and harmonize all the
relevant data for the best decisions may become very
costly and time-consuming, especially when data
from different areas (e.g. social and bio-physical) is
required and the search is focused on a larger group
of countries or even the whole world. Whether or
not a particular location is attractive depends on the
assessment of various factors, such as local
biophysical and climatological characteristics, local
socio-economic conditions (urbanization,
infrastructure, market access and population density)
and socio-economic conditions at country-level
(investment climate, fragility index, etc.). Local
advisors or experts are often indispensable for this
assessment, but they can only make a justifiable
valuation for their own region for which they have
access to the relevant local data. For Small and
Medium-sized Enterprises (SMEs) that are aiming to
find the best location with low costs and still
provides adequate market access, it will become
very difficult and costly to find potential areas and to
find and work with local experts from these areas to
gather relevant information. And not to mention the
difficulties to compare potential areas.
Wageningen University & Research has
developed a country-based model to map the global
potential of floriculture production (Benninga et al.,
2016). In this model the development of floriculture
production in a number of countries has been
analysed to determine the attractiveness for
floriculture production. Knowledge from experts has
been acquired and implemented as weighing factors
in the model. However, in order to analyses the
potential for regions within the country, this country-
based model does not suffice. This
1
led to the
development of the GIS-based
2
Global-Detector
model in which the attractiveness for floriculture
production can be assessed for each grid at 5’x5’
resolution (approximately 10x10 km, depending on
the latitude) in the world.
1
Another inspiration to develop Global-Detector was the report of
Kuhlman and Weegh (2014)
2
GIS = Geographic Information System
Hennen, W., Daane, A. and Duijvendijk, K.
Global-Detector - GIS- and Knowledge-based Tool for a Global Detection of the Potential for Production, Supply and Demand.
DOI: 10.5220/0006256201610168
In Proceedings of the 3rd International Conference on Geographical Information Systems Theory, Applications and Management (GISTAM 2017), pages 161-168
ISBN: 978-989-758-252-3
Copyright © 2017 by SCITEPRESS – Science and Technology Publications, Lda. All rights reserved
161
2 OVERVIEW OF
GLOBAL-DETECTOR
Global-Detector is a knowledge-based Geographic
Information System developed in R that aims to
detect the worldwide potential for production,
demand and market strategies. This tool is
developed by Wageningen Economic Research. At
any spot on the world, i.e. a grid of 5’x5’, the tool
can show the values from a large amount of
indicators, such as climate, infrastructure, and land
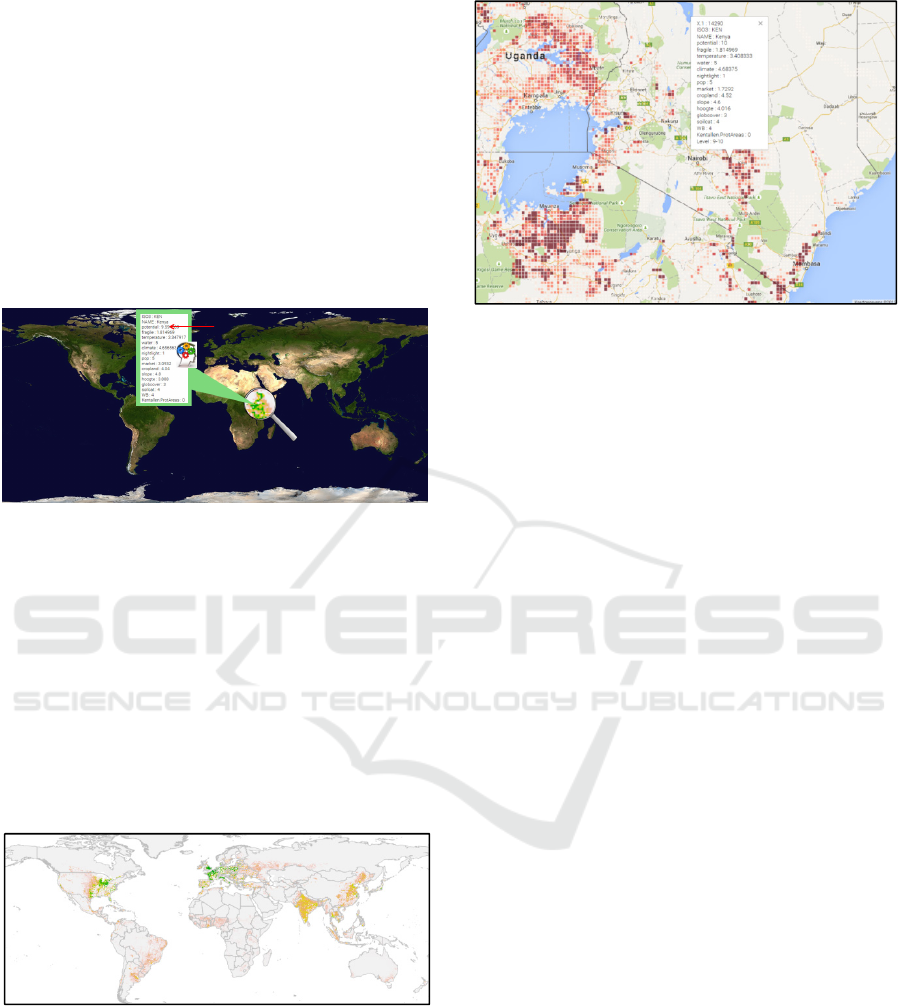
characteristics (figure 1).
Figure 1: The concept of Global-Detector.
Relevant indicators that are available in the
library (section 2.1) are chosen by the expert. The
knowledge from one or more experts is applied to
combine relevant indicators to create a new
indicator. For each case a knowledge-based model is
developed containing a set of arithmetic rules that
prescribe how to combine the indicators chosen by
the expert (section 2.2). After the calculation of all
grids (worldwide or a specified region), the result is
presented on a map. This can be worldwide as in
figure 2, or a specific region in figure 3.
Figure 2: Example of a presentation of the result of
Global-Detector (case ‘Potential for ornamental
horticulture (worldwide)’; green is good potential).
There might be other factors that influence the
production or demand for which there are no
indicators, e.g. cultural or demographic conditions.
Users should be aware of this shortcoming and
consider the outcome as a first step to find suitable
locations.
Figure 3: Example of a presentation of the result of
Global-Detector (case ‘Potential for Tilapia in Kenya and
surrounding countries’; dark red is good potential).
2.1 Indicators
The raw data for most indicators of Global-Detector
are downloaded open source data from the web. The
format of these freely available datasets differs:
Gridded GIS-files with rasters in different
formats, e.g. WorldClim (2016) for global
climate, bio-physical datasets like SoilGrids
(ISRIC, 2016), or datasets with agronomic
parameters related to many crops (e.g.
FAOSTAT, 2016);
GIS-shapefiles, e.g. a world map of rivers and
lakes;
Tabular files with data in csv or Excel files on
country or provincial level, e.g. World
Development Indicators from World Bank
(2016).
After downloading, the data are transformed by GIS-
tools to the required 5’x5’ resolution. Tabular files
with data on country level are also gridded to the
same 5’x5’ format, in this way all grid cells of a
country have the same value. This resolution is
chosen when considering calculation time and
specificity, and many gridded sources have this
resolution. Change of resolution has either
implication for calculation time with hardly
additional information (e.g. to 1’x1’) or is not
specific enough at regional level (e.g. 30’x30’).
Not all indicators of Global-Detector are
transformed directly from open source data. Some
have been derived. For example, the indicator
‘vicinity from harbours’ has been created by using a
list of worldwide harbours and their importance, and
a specific piece of software code draws zones
around a harbour with different levels of distance. In
this way hinterlands of a harbour are incorporated
GISTAM 2017 - 3rd International Conference on Geographical Information Systems Theory, Applications and Management
162

(e.g. part of Germany as hinterland for the harbours
in the Netherlands and Belgium).
To summarize, Global-Detector contains
indicators for:
Climate, e.g. monthly temperature, solar
irradiation, precipitation;
Infrastructure, e.g. distance to markets, vicinity
to harbours and airports;
Land characteristics, e.g. type of soil, slope;
Land utilisation, e.g. % cropland, area of various
crops, protected areas, N/P2O5 fertilisation;
Population density and number of people in
radius of e.g. 20 or 250 km;
Country level indicators retrieved from the
World Bank, FAO and other sources;
Miscellaneous indicators, e.g. nightlight,
religion.
If an expert requires indicators that are not present in
Global-Detector but are available on the web or can
be gathered from another source, then data can be
transformed to a raster with the required template for
Global-Detector. For example, data of the World
bank and FAO have a large number of variables on
country level, each can be transformed to a raster for
Global-Detector. If an expert requires his own
indicator (e.g. export regulations for a specific
product), then he fills in a table with values for each
country. This is sequentially transformed to a
worldwide 5’x5’ indicator.
For a country, a group of countries, or a region
within a country, additional spatial data can be
brought in the model. An example is the use of an
additional map of railway infrastructure and its
influence (figure 6).
2.2 Knowledge-based Model and
Interaction with Experts
A knowledge-based model is an essential part when
Global-Detector is applied. It combines indicators
and arithmetic rules to yield the requested output,
e.g. potential for a product. From a base collection
of nearly two hundred indicators, the expert chooses
indicators that are relevant for the case of interest.
For these indicators on-the-fly maps are created by
the model builder for the specified area or for an
area that should be validated. It is indispensable that
the model builder and the expert work together in
close cooperation to develop a knowledge-based
model that contains algorithms to transform
indicator values to scores. This can be done, for
example, by developing a function that converts
ranges for the minimum, optimum and maximum
temperature to the scores of the temperature
suitability map. The expert determines parameter
values and helps the knowledge engineer (i.e. model
builder) with the construction of the arithmetic rules
for the combination of indicators. The resulting map
is shown to the expert, and after this first step, face
validity of this map can lead to the adaptation of
parameters and formulas. It is up to the expert to
gather and use additional information from literature
or gain information from other experts for the
purpose of this validation procedure. If there is a
theoretic background, the expert can use that
information when the knowledge-base is specified.
3 THEORETICAL
BACKGROUND AND SETTING
3.1 Model Perspective
Global-Detector can among others be used as a
suitability model aimed at assessing the potential for
different agricultural production systems, and is
intended to bridge the gap between standard
agronomic (bio-physical) crop suitability models
that provide output at grid-level on the one hand, for
example Ecocrop model (EcoCrop, 2016), GAEZ
(FAO, 2016), and on the other hand a set of global
models that focus on the agricultural sector in
general (including socio-economic and market data)
which provide output at level of administrative units
(e.g. MAGNET: see Woltjer and Kuiper, 2014).
Global-Detector uses expert knowledge to
include the assumed impact of (downscaled) socio-
economic and infrastructural variables on the
suitability of different grid cells for different
production systems. This is not restricted to crop
production systems, but can also be applied to
(mixed-) livestock, aquaculture systems, demand for
products, etc. Models that combine high-resolution
spatial data related to both environmental and socio-
economic data already exist, for example
EUClueScanner (Koomen et al., 2010; Object
Vision, 2016) and CLUMondo (Van Asselen and
Verburg, 2012). However, to our knowledge no
other model combines these different types of data at
a global scale and using expert knowledge to weigh
relative impacts, and to combine and transform data
(e.g. from temperature maps to a map showing the
deviation from optimum temperature range in
tropical regions). The EUClueScanner, however,
already uses data from other models including
IMAGE (Kram and Stehfest, 2011; IMAGE, 2016)
and MAGNET. But the prevailing difference at the
Global-Detector - GIS- and Knowledge-based Tool for a Global Detection of the Potential for Production, Supply and Demand
163

moment is the flexibility of Global-Detector that
allows the expert, within a few hours, to include a
subset of several hundreds of variables that are
relevant to make a certain area suitable for the
desired production system, based on the subjective
assessment principle (i.e. expert knowledge).
Models that provide information about the
suitability for different agricultural production
systems at the grid-level can give both policy
makers and the commercial sector a quick scan of
the expected local differences. Inclusion of climatic,
bio-physical and socio-economic variables can help
show the differences within a country (e.g.
suitability for local to local production) or assess the
impact of changes to any of these variables. Existing
models that focus on the suitability of certain
agricultural production systems generally focus on
crop production systems and the climatic and
biophysical conditions that are required for certain
crops to grow optimally.
Three main approaches to suitability analyses
exist: the limiting condition principle, the principle
of arithmetic modelling and the subjective
assessment principle (FAO, 2016a). When using the
limiting condition, the least suitable variable
determines the overall suitability. With the principle
of arithmetic modelling, variables will be assigned a
certain value, which can be operated arithmetically
to determine the final suitability. The subjective
assessment principle (‘expert model’) allows for
flexible selection and judgement over the
importance of the different variables; the variables
can be weighted and operated arithmetically to get to
a final suitability map. The latter approach requires
an expert opinion and can combine any of the
relevant aspects of the other two types of models.
Global-Detector applies the subjected assessment
principle; the expert system is the core of an
application with this model.
Sweeney et al. (2015) present and compare in a
recent review 34 journal articles and 70 web-
mapping projects that cover various aspects of food
mapping research and initiatives that have been used
to “explore complex social, economic, and
environmental components of the food system”.
Neither of these models resembles the concept of
Global-Detector, nor are we aware of another
existing comparable world-wide generic and flexible
knowledge- and GIS-based model that can be used
interactively together with an expert.
3.2 Market and Business Perspective
According to the classical location theory,
entrepreneurs try to minimalize costs in their quest
to find appropriate locations to invest (Von Thünen,
1960). Benninga et al. (2016) give an overview of
this theory and other theories related to international
potential for production. Optimal locations have low
transport costs, proximity to raw materials and
energy, situated near markets (or harbours/airports
for export), availability of labour, etc.. Intensive
vegetable and fruit production - especially for the
fresh market (i.e. short chain production) - is best to
be situated near urban region, whereas extensive
agriculture and forestry activity is eligible to be in
the rural areas (after Von Thünen, 1960). Porter
(1990) proposes a strategic diamond model bases on
competiveness to assess the attractiveness of a
country or region, based on competiveness.
Global-Detector is able to account for factors
that are related to markets and business climate, e.g.
the ease of doing business (World Bank), the
availability and quality of infrastructure,
identification of urban and rural areas, GDP and
income inequality, and the fragility of states.
4 CASE STUDIES AND
APPLICATIONS
The availability of indicator maps and expert
knowledge is required for any application of Global-
Detector. It can be applied for various information
needs or research questions. Some of the
possibilities (with examples, see later) are:
Detection of the potential for production, e.g.
Tilapia in ponds, ornamental horticulture, pig
production;
The expected demand for a product, e.g.
consumption of cherry tomatoes, consumption of
milk;
Local-for-local production, e.g. nursery (potted
plants) for the local markets, short chain fresh
vegetable production;
Scenarios that might have an effect on the
production or demand in a region, e.g. drought,
flooding.
At a workshop a group of experts can be informed
about the circumstances in the area at issue by
showing several relevant indicator maps produced
by Global-Detector, followed by interactively
gaining region intelligence from these maps
supplemented by regional knowledge from the
participants.
Global-Detector is applied for the development
of demonstration cases and used in projects. Most
GISTAM 2017 - 3rd International Conference on Geographical Information Systems Theory, Applications and Management
164

applications concern production potential. Other
types of applications, like the demand for a product,
are harder to accomplish and require additional
assumptions because of a lack of worldwide data
(e.g. difference between urban and rural
consumption).
The first case will be explained in detail whereas
the other cases will be described only briefly.
4.1 Production Potential
Potential for Ornamental Horticulture (Worldwide).
This was the research question that had led to the
development of Global-Detector and is its first
application. The steps that were taken illustrate the
way Global-Detector has been applied for this case
and to understand the development of the other
cases. A base for this case has been a country-based
model in Excel to map the global potential of
floriculture production (Benninga et al., 2016). The
steps used to apply Global-Detector for this case,
and in general for other cases, are:
Commitment of experts for acquiring knowledge
and validation. This case consisted of two expert
groups: (1) cuttings and young plants, and (2)
flowering and bedding plants;
Selection of indicators from Global-Detector.
These indicators are subdivided in following
groups: climate, land and soil, market &
infrastructure, and country level (e.g. fragile state
index);
In workshops the knowledge-base of Global-
Detector is developed, i.e. creating arithmetic
formulas for combining and weighing indicators,
and setting parameters for these formulas, e.g.
the optimal temperature. The workshop is
interactive, experts can react instantaneous and
suggest adaptations of the parameters;
Validating maps generated by the knowledge-
base. An example is the suitability of climate -
i.e. the combination of temperature, water
supply, humidity, and solar irradiation - for the
production of flowering and bedding plants
(figure 4);
Adaptation of the set of indicators for the
knowledge-base;
Creating the final potential map for a specific
region (e.g. figure 5) or for the whole world
(figure 2).
For the following cases these steps may differ, e.g.
bilateral sessions instead of workshops.
Figure 4: Climate suitability for flowering and beddings
plants in East Asia; dark green is good potential.
Figure 5: Potential for flowering and beddings plants in
Ethiopia; red is reasonably good potential.
Most relevant indicators for the expert model
that was developed based on expert judgement were
solar radiation, temperature and the infrastructure
indicator ‘distance to main airports’. Furthermore, a
set of indicators from World Bank (or related
sources) were applied (on country level). Results
from the 5’x5’ grids had been summarized at
province level.
Global-Detector - GIS- and Knowledge-based Tool for a Global Detection of the Potential for Production, Supply and Demand
165
Potential for Tilapia in Kenya and Surrounding
Countries.
To proof the applicability of Global-Detector was
the development of a map of Kenya and
surroundings to indicate the best pond locations for
Tilapia. In three sessions with an expert, who has
also regional knowledge, a knowledge-base was
developed. Results depicted on Google maps were
validated by this expert (figure 3). After a positive
validation, the model can have opportunities for a
worldwide applicability - presumably with some
modifications for non-tropic regions. The Tilapia
case was valuable since it gained experience in
interacting with an expert and the way validation
was done.
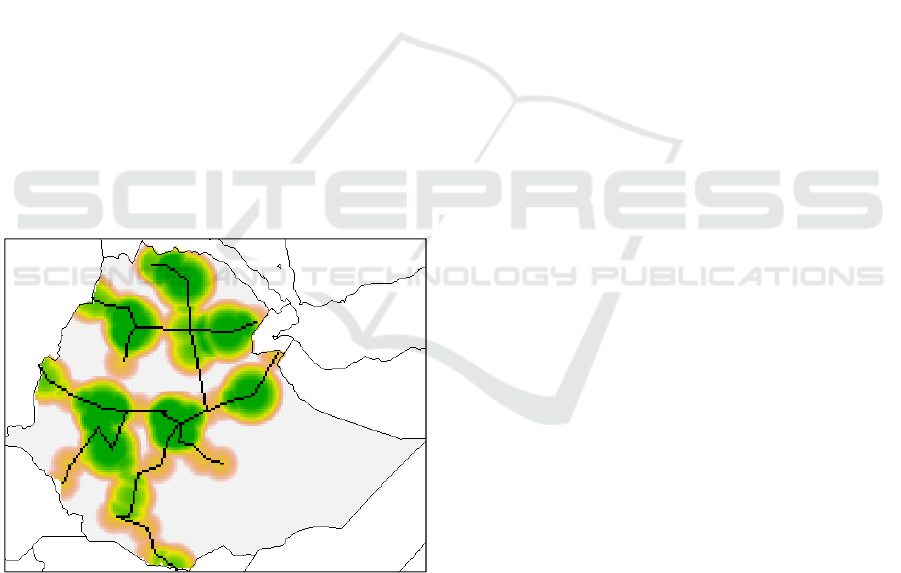
Potential for Avocado Production in Ethiopia.
For a project initiated by the Dutch organization
‘GroentenFruit Huis’, Global-Detector was applied
to assess the best areas for avocado production in
Ethiopia when accounting for the infrastructure.
New maps (i.e. indicators) had to be developed to
indicate the location of (potential) railways and
stations (figure 6). This has shown the flexibility of
Global-Detector to make and use additional specific
indicators. Soil characteristics from SoilGrids, like
pH, organic content, clay and drainage, had also
been used as additional indicators.
Figure 6: Scope of railways and stations in Ethiopia
(additional Global-Detector indicator for one country).
Potential for Tomato Production (Worldwide).
The Dutch company Prominent is interested in the
best locations for tomato production worldwide.
Entrepreneurs can be aided in their quest for
locations by means of the results of the model. In a
workshop indicators were identified and knowledge
was acquired on how to combine indicators. For
example, the combination of the maximum and the
minimum temperature in the hottest 3 months
accounting for optimal temperature combined with
enough difference between minimum and maximum
temperature.
Potential for Pig Meat Production in South-East
Asia.
Together with an expert on pig meat production, a
knowledge base was developed to assess the
potential for pig meat production in South-East Asia.
Besides indicators on 5’x5’ and country level, an
additional level was applied. Province level
indicators maps for the main religions had to be
developed (from tabular base data from Johnson and
Grim, 2008) and applied. The value of this case for
Global-Detector is the flexibility to incorporate also
a province level for regional information.
4.2 Demand (Consumption)
Demand of Cherry Tomatoes in Africa and Europe.
This application was developed to show that Global-
Detector is also suitable for the demand, so not just
for production (supply). For Africa and Europe the
indicators and a knowledge base was used to
estimate the amount of expected cherry tomato
consumption. FAO data on imports of (luxury)
vegetables had been transformed to an indicator;
seven products were weighted and combined and
divided by the population to yield the consumption
by import per person. The estimation of the total
consumption per grid cell is done by a combination
of expected % of consumers, the availability (based
on infrastructure) and the expected consumption per
capita.
4.3 Classification for Decision Making
Agro-ecological Potential and Climate Vulnerability
in Mali and Burkina Faso.
Global-Detector was applied to map the agro-
ecological potential and climate vulnerability of
Mali and Burkina Faso as a case study. This pilot
project aimed to test the possibilities for enabling
strategic discussion on future climate smart Food
and Nutrition Security interventions in Sub Saharan
Africa, by identifying areas with high/low food
system dynamics and high/low climate dynamics.
These classifications have been presented on a map
and discussed with experts in a workshop.
Classification of Supply and Demand of Onions.
For a project initiated by the Dutch organization
GISTAM 2017 - 3rd International Conference on Geographical Information Systems Theory, Applications and Management
166

‘GroentenFruit Huis’ Global-Detector was applied to
downscale information from country level (e.g. data
from World Bank and FAOSTAT) to grid level. The
result is a map with grids classified as ‘import’,
‘export’ and ‘local’. The distinction between urban
and rural areas and the balance between supply and
demand led to these classifications.
4.4 Global-Detector to Analyse
Metropolitan Assignments
Detection of Metropolitan Land use Options
(Metropolitan Solutions).
In the project Metropolitan Solutions one of the aims
is to investigate the options for land use in
metropolitan regions, accounting for the demand
(consumption) and supply (production) of food and
recreation. In an expert model, indicators of Global-
Detectors were used to assign regions for urban
recreation, rural recreation, short chain fresh food
production, intensive meat production, vegetables
and fruit production, arable production and grazing
areas. Effects of options - like urban population
growth and flood by sea - on the supply and demand
of food and recreation had been calculated. For the
demand of food so-called ‘Food Metres’ were used,
indicating the number of required hectares per 1000
people (Wascher et al., 2015). Currently another
model is being developed to specify ‘Food Metres’
or the ‘consumptive food print’ for all countries in
the world, and thus having a country specific ‘Food
Metres’.
Classification of Cities Worldwide.
Another application within the project Metropolitan
Solutions is the classification of nearly 850 of the
worlds’ largest cities by making use of Global-
Detector. Each city has to be characterized by a few
dozen aspects like the risk of flooding, the degree of
urbanisation, infrastructure, available urban
recreation and urban agriculture, possibilities to
expand, etc.. By means of cluster analyses or with
software programmes that search for comparable
cities, e.g. the FaceIT tool based on genetic
algorithms (Hennen, 2009), groups of cities that
share common characteristics can be identified.
5 DISCUSSION AND
CONCLUSION
The wide variety of applications in the previous
chapter shows that Global-Detector is a generic tool
for knowledge-based spatial analysis. Since the large
set of indicators is readily available for use without
any GIS-processing, the model builder together with
the expert can start building the knowledge base for
the concerning research aim instantaneously. In this
way the result is reached considerable faster and
more efficient compared to a customary approach
where often tedious and time-consuming data
tracing, collection and GIS-processing have to take
place before the actual spatial analyses can start.
Due to the readily availability of the indicators
(maps) in Global-Detector, the spatial analyst (i.e.
knowledge engineer together with expert) can
instantly work on the knowledge level to create an
application.
The knowledge base is imperative in any
application built with Global-Detector, this makes
the expert an unavoidable agent. After all, spatial
analysis is a knowledge driven process when the
algorithms and scientific methods are not explicitly
available, and merely exist as ‘tacit knowledge’ in
the head of an expert. Experts are also crucial to
validate the outcome and to communicate its worth
and shortcomings.
An application developed with Global-Detector
can only make use of the available indicators.
Despite a considerable amount of indicators there
might be factors for which no indicators exist in the
stack of Global-Detector. For example cultural or
region-specific aspects, or regional knowledge that a
river carries no water during some months in the
year. Results should therefore be considered as a
‘quick scan’ or as a first step that has to be followed
by more detailed analyses with additional (regional)
data or models. Global-Detector’s resolution of
5’x5’ might also be too coarse grained when small
regions are subject of an investigation. Great care is
needed when the individual grids contain a large
variety of landscape elements.
Global-Detector is valuable when applied in
conjunction with existing models, e.g. with the
MAGNET model (Woltjer and Kuiper, 2014). In this
way Global-Detector can benefit from additional
specialized data, and an existing model can use
Global-Detector‘s downscaling possibilities, and so
increase the value of both models (Bartelings and
Hennen, 2016). Promising efforts in this direction
have been made.
The initial goal of Global-Detector and the
reason why it has been developed, - i.e.
entrepreneurs want to be aided in their search for
promising locations in the world to expand their
production or market possibilities abroad - is
attained since locations can be spotted, analysed and
Global-Detector - GIS- and Knowledge-based Tool for a Global Detection of the Potential for Production, Supply and Demand
167

compared with the model. Examples are the
potential for ornamental horticulture and tomatoes.
The horticultural sector has pronounced their interest
to use it for other products. As a generic tool with
increased flexibility, Global-Detector will have
many application possibilities in a wide variety of
projects.
REFERENCES
Bartelings, H., Hennen, W., 2016. MAGNET and Global-
Detector. LEI Wageningen UR, internal project
document.
Benninga, J., Hennen, W., Dijkxhoorn, Y., Galen, M. van,
2016. Internationaal Productie Potentie Model
Sierteelt, modelbeschrijving. LEI Wageningen UR,
report in press.
EcoCrop, 2016. Expert cross checking and validation of
crop niche predictions. URL:
http://gisweb.ciat.cgiar.org/ClimateChange/EcoCropF
B/ (Retrieved: 11/16/2016).
EarthStat, 2016. EarthStat data download. URL:
http://www.earthstat.org/data-download/ (Retrieved:
11/21/2016).
FAO, 2016. GAEZ - Global Agro-Ecological Zones. URL:
http://www.fao.org/nr/gaez/en/ (Retrieved:
11/16/2016).
FAO, 2016a. Land evaluation for development. URL:
https://www.mpl.ird.fr/crea/taller-
colombia/FAO/AGLL/pdfdocs/landev.pdf (Retrieved:
11/16/2016).
FAOSTAT, 2016. FAOSTAT Statistics division. URL:
http://faostat3.fao.org/home/E (Retrieved:
11/21/2016).
Hennen, W.H.G.J., 2009. Comparing companies and
strategies: a Genetic Algorithms approach. JIAC2009.
July 6-8 2009, Wageningen.
IMAGE, 2106. IMAGE : Integrated Model to Assess the
Global Environment. URL:
http://themasites.pbl.nl/models/image/index.php/IMA
GE_framework (Retrieved: 11/16/2016).
ISRIC, 2016. Soilgrids. ISRIC World Soil Information.
URL: http://www.isric.org/content/soilgrids
(Retrieved: 11/19/2016).
Johnson, T.M., Grim, B.J., 2008. Eds. ‘World Religion
Database’, Leiden/Boston, Brill, 2008. See
http://www.worldreligiondatabase.org .
Koomen, E., Diogo, V., Hilferink, M., Beek, M.C.J. van
der, 2010. EU-ClueScanner100m; model description
and validation results. (Internal report). Amsterdam:
VU Amsterdam.
Kram, T., Stehfest, E., 2011. Integrated Modeling of
Global Environmental Change. In: Land use, climate
change and biodiversity modeling: perspectives and
applications. Trisurat, Y., Shrestha, R.P. and
Alkemade, R. (Eds.), pp.104-118.
Kuhlman, T., Weegh, J. op de, 2014. Meloenen in Afrika;
Of: hoe men met behulp van GIS-data potentiële
teeltgebieden voor een gewas kan bepalen. LEI,
Wageningen UR.
Object Vision, 2016. EUClueScanner. URL:
http://www.objectvision.nl/gallery/products/eucluesca
nner (Retrieved: 11/16/2016).
Porter, M.E., 1990. The competitive advantage of nations.
New York: Free Press.
Sweeney, G., Hand, M., Kaiser, M. , Clark, J.K., Rogers,
C., Spees, C., 2015. The State of Food Mapping
Academic Literature Since 2008 and Review of Online
GIS-based Food Mapping Resources. Journal of
Planning Literature, 31 (2), 123-219.
Van Asselen, S., Verburg, P.H., 2012. A land system
representation for global assessments and land-use
modeling. Global Change Biology, 18, 3125-3148.
http://dx.doi.org/10.1111/j.1365-2486.2012.02759.x
Von Thünen, J.H., 1930. Der isolierte Staat in Beziehung
auf Landwirthschaft und Nationalokonomie. 3 vols.
Jena (Germany): Fischer, 1930.
Woltjer, G.B., Kuiper, M.H., 2014. The MAGNET Model:
Module description. Wageningen, LEI Wageningen
UR (University & Research centre), LEI Report 14-
057. 146 pp.; 18 fig.; 45 tab.; 39 ref.
Wascher, D.M., Piorr, A., Pintar, M., Kneafsey, M., Sali,
G., Corsi, S.L., Mbatia, T., Jeurissen, L.J.J.,
Arciniegas, G., Glavan, M., Doernberg, A., Zasada, I.,
Groot, J., Schmutz, U., Bos, E., Venn, L., Monaco, F.,
Simiyu, R., Owour, S., Asselt, E.D. van, Fels, H.J. van
der, Eupen, M. van, 2015. FOODMETRES –
Metropolitan food planning connecting the local with
the global. Urban Agriculture Magazine (2015)29. -
ISSN 1571-6244 - p. 41 - 44.
World Bank, 2016. World Bank : World Development
Indicators. http://data.worldbank.org/products/wdi
Worldclim, 2016. WorldClim - Global Climate Data.
URL: http://www.worldclim.org/ (Retrieved:
11/19/2016).
GISTAM 2017 - 3rd International Conference on Geographical Information Systems Theory, Applications and Management
168
