
Using a Time based Relationship Weighting Criterion to Improve Link
Prediction in Social Networks
C. P. M. T. Muniz, R. Choren and R. R. Goldschmidt
Dept. Computer Engineering, Military Institute of Engineering (IME), Praca Gen. Tiburcio 80, Rio de Janeiro, Brazil
{
Keywords:
Link Prediction, Social Networks, Weighted Graphs.
Abstract:
For the last years, a considerable amount of attention has been devoted to the research about the link prediction
(LP) problem in complex networks. This problem tries to predict the likelihood of an association between two
not interconnected nodes in a network to appear in the future. Various methods have been developed to solve
this problem. Some of them compute a compatibility degree (link strength) between connected nodes and
apply similarity metrics between non-connected nodes in order to identify potential links. However, despite
the acknowledged importance of temporal data for the LP problem, few initiatives investigated the use of this
kind of information to represent link strength. In this paper, we propose a weighting criterion that combines
the frequency of interactions and temporal information about them in order to define the link strength between
pairs of connected nodes. The results of our experiment with traditional weighted similarity metrics in ten
co-authorship networks confirm our hypothesis that weighting links based on temporal information may, in
fact, improve link prediction. Proposed criterion formulation, experimental procedure and results from the
performed experiment are discussed in detail.
1 INTRODUCTION
In recent years, social network analysis has received
great attention from both scientific and industrial
communities (Wang et al., 2015). It tries to under-
stand how the structures of large scale social net-
works
1
evolve. For example, predicting whether a
pair of nodes will connect in the future is an im-
portant network analysis task known as the link pre-
diction (LP) problem (Liben-Nowell and Kleinberg,
2007). Various methods have been developed to
predict links in social networks (Adamic and Adar,
2003) (Barabasi et al., 2001) (Choudhary et al., 2013),
(Liben-Nowell and Kleinberg, 2007) (Munasinghe
and Ichise, 2012), (Valverde-Rebaza et al., 2015)
,(L
¨
u and Zhou, 2010), (Murata and Moriyasu, 2007),
(Soares and Prud
ˆ
encio, 2011), (Zhu and Xia, 2016).
According to (Wang et al., 2015), these methods fall
into two many approaches:
• Supervised - This approach converts the origi-
nal graph to a binary classification problem and
1
A large scale social network is a highly interconnected
graph where each node represents a participant (e.g. in-
dividual, organization, group, etc) and an edge represents
some kind of interaction between the corresponding partic-
ipants (e.g. friendship, collaboration, communication, etc).
uses learning algorithms such as decision trees
and neural networks to build classification mod-
els (Hasan et al., 2006).
• Unsupervised - Methods from this approach are
based on similarity metrics that compute scores
to express some sort of compatibility degree
2
be-
tween pairs of non-connected nodes (e.g. ho-
mophily, ties, degrees of separation, among oth-
ers). Then a ranked list in decreasing order of
scores is obtained and nodes from the pairs at
the top of the list are more likely to connect
(Liben-Nowell and Kleinberg, 2007). Number of
common neighbors (CN) and Adamic-Adar index
(AA) are typical examples of topology based simi-
larity metrics frequently employed in score calcu-
lation (Wang et al., 2015).
The compatibility degree may also be considered
when the nodes are connected. In this case, it is called
link strength between nodes and consists of a numeri-
cal weight assigned to the edge that represents the cor-
responding connection. Higher (resp. lower) values
of link strength indicate that the nodes are strongly
(resp. weakly) linked. Most initiatives from the un-
2
A numeric value used to concisely describe properties
shared by two nodes.
Muniz, C., Choren, R. and Goldschmidt, R.
Using a Time based Relationship Weighting Criterion to Improve Link Prediction in Social Networks.
DOI: 10.5220/0006276900730079
In Proceedings of the 19th International Conference on Enterprise Information Systems (ICEIS 2017) - Volume 1, pages 73-79
ISBN: 978-989-758-247-9
Copyright © 2017 by SCITEPRESS – Science and Technology Publications, Lda. All rights reserved
73

supervised approach to the LP problem do not take
link strength into consideration. Yet, such informa-
tion may be used to provide useful insights for link
prediction. For example, two non-connected nodes
strongly linked to their common neighbors are more
likely to connect than the ones weakly linked to their
common neighborhood.
Few studies from the unsupervised approach to
the LP problem evaluated the use of link strength
between connected nodes (Murata and Moriyasu,
2007), (L
¨
u and Zhou, 2010), (Soares and Prud
ˆ
encio,
2011), (Zhao et al., 2015), (Taha, 2007), (Zhu and
Xia, 2016), (Dunlavy et al., 2011). They employed
some weighting criterion in order to calculate link
strength
3
. In almost all of them, the adopted weight-
ing criterion was the frequency of existing interac-
tions between the nodes (Fi) (Murata and Moriyasu,
2007), (L
¨
u and Zhou, 2010), (Soares and Prud
ˆ
encio,
2011), (Zhu and Xia, 2016). Based on Fi, link
strength between nodes that interact frequently is
higher than the link strength of the ones that occasion-
ally connect. Although interesting, this criterion does
not take into account when the interactions occurred.
Therefore, old and new interactions have the same in-
fluence in weight definition. This characteristic does
not satisfy the Weak Ties social theory (Granovetter,
1973). According to such theory, recent interactions
tend to stimulate the occurrence of new interactions in
the network. Hence, recent connections should have
higher influence in link strength calculation and, con-
sequently, in link prediction.
Our hypothesis is that weighting links based on
the combination of the frequency of interactions and
temporal information may improve link prediction.
To illustrate it, in this article, we propose a weighting
criterion (called FTi) that combines the frequency of
interactions and temporal information about them in
order to improve the quality of link strength and, con-
sequently, the performance of LP in social networks.
In the experiments, we ran FTi and Fi to weight each
network analyzed. Thereafter, we compared the per-
formances of WCN and WAA applied to all weighted
networks. Both metrics presented better performance
when applied to the networks weighted by the FTi
criterion, confirming our hypothesis.
3
It is important to emphasize that those studies con-
sidered weighted versions of the networks (networks with
weights associated to their edges). As a consequence, they
used weighted versions of traditional topology based simi-
larity metrics, such as weighted number of common neigh-
bors (WCN) and weighted Adamic-Adar index (WAA).
These metrics differ from their traditional versions be-
cause they take link strength into consideration in order do
compute the compatibility degree between non-connected
nodes.
This text contains other five sections. Section
2 presents some background knowledge about link
prediction. In section 3, we describe the proposed
weighting criterion. Details about the experimental
results are given in section 4. Conclusions and future
work are posed in Section 5.
2 BACKGROUND
Given a snapshot of an homogeneous
4
attributed
5
multigraph
6
G(V,E) at a time t
0
and a similarity met-
ric d (d : V xV → R), the general procedure of the un-
supervised approach to LP is described by the follow-
ing steps (Liben-Nowell and Kleinberg, 2007):
• Graph partition - This step divides G(V, E) in two
subgraphs: G
Training
(V,E
Old
) and G
Test
(V,E
New
).
G
Training
contains all edges e created until t
0
(i. e.,
e.t ≤ t
0
and e ∈ E
Old
). Analogously, G
Test
contains
all edges e created after t (i. e., e.t > t
0
and e ∈
E
New
)
• Graph weighting - First, it builds artificial edges
between nodes connected in G
Training
. Then it cal-
culates the weight of each artificial edge. Weight
calculation follows a specific criterion (e.g. num-
ber of original edges between the corresponding
nodes). Figure 1 illustrates this process.
Figure 1: Example of an artificially weighted graph. Edges
represented by continuous lines exist in the original graph.
The ones represented by dashed lines were artificially cre-
ated for LP purposes. Weighting criterion defines weights
for the dashed lines.
• Identification of Core - This step is responsible
for filtering the active nodes v
i
, i.e., nodes that are
incident to at least k original edges in G
Training
and
at least k original edges in G
Test
.Parameter k is
defined by the user and typically depends on the
4
Nodes and edges are of the same type.
5
Each edge e contains at least one temporal information:
the time when e was introduced in the graph (represented by
e.t).
6
Two nodes may be connected by multiple edges.
ICEIS 2017 - 19th International Conference on Enterprise Information Systems
74

average frequency of interactions occurred in the
network. Active nodes are more likely to connect
than nodes that seldom interact with others. Core,
the set of all active nodes in G is the output of this
step.
• Score calculation - It uses d in order to assign a
score d(v
i
,v
j
) to each pair of nodes v
i
and v
j
that
belong to Core and did not connect in G
Training
.
• Performance evaluation - This step ranks the pairs
(v
i
,v
j
) by d(v
i
,v
j
) (higher scores d(v
i
,v
j
) come
first in the ranking list). The top − N pairs (v
i
,v
j
)
from the ranking list are selected as the ones with
nodes with the highest likelihood to connect af-
ter t. N is the number of pairs of active nodes
that were not connected in G
Training
but connected
in G
Test
(see equation 1). Finally, this step com-
pares the performance of d with the performance
of a baseline random predictor. The random pre-
dictor simply predicts randomly selected pairs of
nodes that did not connect in G
Training
. The prob-
ability that a random prediction is correct is just
expressed by the ratio between |E
New
| and the
number of possible correct predictions ((
Core
2
) −
|
E
old
|
). Equation 2 outputs the improvement fac-
tor of the similarity metric over the random pre-
dictor where E
correct
is the number of links cor-
rectly predicted by the process. This factor is an
evaluation metric traditionally used to compare
the performances of the similarity metrics in LP
(Liben-Nowell and Kleinberg, 2007).
N = |E
New
∩ (Core ×Core)| (1)
ImprovementFactor =
|
E
correct
|
/
|
E
new
|
|
E
new
|
/((
Core
2
) −
|
E
old
|
)
(2)
There are some important points about the unsu-
pervised approach described above that must be em-
phasized:
• Unsupervised approach to LP has been intensively
studied during the last years (Liben-Nowell and
Kleinberg, 2007), (Lu and Zhou, 2010), (Li et al.,
2012), (Kuo et al., 2013). Basically, related work
differ in the way the similarity metrics are con-
ceived and the kind of information they use to
generate the scores.
• Although the Graph Weighting step does not be-
long to the original process proposed by (Liben-
Nowell and Kleinberg, 2007), it has been fre-
quently used by the studies that consider link
strength of connected nodes in order to predict
new links (L
¨
u and Zhou, 2010),(Zhao et al.,
2015).
• The choice of the similarity metric is an important
decision for the unsupervised approach. (Murata
and Moriyasu, 2007) was the first work to pro-
pose the Graph Weighting step and the weighted
versions of similarity metrics such as common
neighbors and Adamic-Adar index. See table 1
for original and weighted versions of these met-
rics. Weighted metrics do not consider the orig-
inal edges of the graph. For those metrics, score
calculation is restricted to the artificial edges built
by the graph weighting step.
Table 1: Examples of methods for score calculation used in
LP - original and weighted versions.
Method Summarized de-
scription
Common Neighbors
|Γ(u) ∩ Γ(v)|
The number of
neighbors that
two given nodes
have in common
(Hasan and Zaki,
2011).
Weighted Common Neigh-
bors
∑
z∈Γ(u)∩Γ(v)
w(u,z)+w(z,v)
2
The average
of weights
associated to
the links be-
tween two given
nodes and their
common neigh-
bors (Murata
and Moriyasu,
2007).
Adamic/Adar Similarity
∑
z∈Γ(u)∩Γ(v)
1
log(|Γ(z)|)
A refinement
of the common
neighbors met-
ric that takes
neighbors with
smaller degree
into consid-
eration more
heavily (Adamic
and Adar, 2003).
Weighted Adamic-Adar
∑
z∈Γ(u)∩Γ(v)
w(u,z)+w(z,v)
2
×
1
log(
∑
z
0
∈Γ(z)
w(z
0
,z))
A refine-
ment of the
Adamic/Adar
similarity metric
that takes into
account the
link weights.
(Murata and
Moriyasu,
2007).
Using a Time based Relationship Weighting Criterion to Improve Link Prediction in Social Networks
75

3 PROPOSED WEIGHTING
CRITERION
This section presents the proposed weighting crite-
rion (FTi) to be used during the graph weighting step
of the unsupervised approach to LP. Inspired by the
Weak Ties social theory, the idea of the FTi criterion
is to combine the frequency of interactions with the
temporal information about them, so that recent inter-
actions have higher influence than old ones in predict-
ing new links.
Equation 3 defines the FTi criterion. It is applied
to each artificial edge of the weighted graph and con-
tains two factors:
weight(u,v) = NoI(u,v) × β
CT −max(t
(u,v)
)
(3)
• The first is a function (NoI(u,v)) that returns
the number (frequency) of interactions (original
edges) between nodes u and v.
• Inspired by the time score metric
7
proposed
by (Munasinghe and Ichise, 2012), the second
(β
CT −max(t
(u,v)
)
) is a damping factor (i.e. it takes
time into account). Weights between connected
nodes that interacted recently are higher than the
ones whose last interactions occurred before in
the past. CT indicates the current time. Func-
tion max(t
(u,v)
) returns the most recent timestamp
among the edges between u and v. Hence, CT −
max(t
(u,v)
) returns the elapsed time (age) from the
most recent interaction between u and v to the cur-
rent time. β is a parameter that belongs to the in-
terval ]0,1] and is used by the analyst to calibrate
the importance of the age of the most recent in-
teraction in the weighting process. Higher (resp.
lower) values of β intensify (resp. attenuate) in-
fluence of time in weight definition.
Consider the example depicted in figure 1. Re-
stricting the weighting criterion to the number of in-
teractions (Fi), as used in (Murata and Moriyasu,
2007), (L
¨
u and Zhou, 2010), (Soares and Prud
ˆ
encio,
2011), (Zhao et al., 2015), (Taha, 2007), (Zhu and
Xia, 2016), (Dunlavy et al., 2011), the weights
would be the same for all three pairs of nodes
(Weight(A,D) = Weight(B, D) = Weight(C, D) = 3).
Thus their connections would have the same im-
portance in score calculation and, consequently, in
link prediction. For instance, WCN similarity met-
ric would present the same score for the three
possible new links (WCN(A, B) = WCN(A,C) =
WCN(B,C) = 3), indicating no preference among
them in link prediction.
7
Time score is a time based similarity metric used to
calculate scores between non connected nodes.
On the other hand, if temporal information was
taken into account as stated by the FTi criterion, the
most recent interactions would lead to higher weights
and, hence, influence more in link prediction (in ac-
cordance with the Weak Ties theory). In the example,
using FTi criterion with CT = 2016 and β = 0.8, the
weights would be:
Weight(A, D) = 3 × 0.8
2016−max(2016,2015,2014)
= 3
Weight(B, D) = 3 × 0.8
2016−max(2015,2014,2015)
= 2.4
Weight(C, D) = 3 × 0.8
2016−max(2014,2013,2012)
= 1.9
Although, the three pairs of nodes presented the
same frequency of interactions (three connections
each), with FTi, the ones that interacted more re-
cently received higher weights. Frequency of inter-
actions was attenuated by the age of the most recent
interaction between the nodes of each pair. The (A,D)
pair presented the highest weight. In fact, the fre-
quency of interactions between A and D suffered no
attenuation because the nodes interacted in the cur-
rent time (2016). On the other hand, frequencies of
interactions between the nodes of the pairs (B,D) and
(C,D) indeed suffered some attenuation. The last in-
teraction between nodes C and D occurred in 2014
(age = 2 years). B and D last interacted in 2015 (age =
1 year). Hence, (C,D)’s weight attenuation was higher
than the one suffered by (B,D)’s weight.
Considering the weights produced by the FTi ci-
terion, WCN similarity metric would present different
scores for the three possible new links (WCN(A, B) =
2.7; WCN(A,C) = 2.5; WCN(B,C) = 2.2). Accord-
ing to this metric, the pair (A,B) would be more likely
to connect than the others. Both nodes (A and B)
interacted with their common neighbor (D) more re-
cently than the other pairs did. It is important to em-
phasize that this result would be in line with the Weak
Ties theory. Indeed, according to this theory, those re-
cent interactions would stimulate the occurrence of a
new interaction in the network, very possibly between
nodes A and B.
4 EXPERIMENT
4.1 DataSets
We have selected two versions of the same five
co-authorship networks
8
used in (Liben-Nowell and
8
Authors and papers from five sections of the physics e-
Print arXiv: astro-ph (astrophysics), cond-mat (condensed
matter), gr-qc (general relativity and quantum cosmology),
hep-ph (high energy physics - phenomenology) and hep-th
(high energy physics - theory)
ICEIS 2017 - 19th International Conference on Enterprise Information Systems
76

Kleinberg, 2007) to perform our experiments. The
first version (papers from 1994 to 1999) covered the
same interval of time used by (Liben-Nowell and
Kleinberg, 2007). That was very important to help
us validate our implementation. The second version
(papers from 2000 to 2005) covered the same period
used by (Munasinghe and Ichise, 2012). All networks
were extracted from arXiv API
9
.
Both versions of the networks were homogeneous
attributed multigraphs where nodes and edges repre-
sent authors and papers, respectively. All networks
contained one attribute in edges: the paper’s year of
publication.
4.2 Experimental Procedure
Our experiment followed the same procedure de-
scribed in section 2. Specific comments about each
step are presented below:
• Graph partition - We divided each network in
two periods of three years. Hence, each network
with papers from 1994 to 1999 was partitioned in
G
Training
[1994,1996] and G
Test
[1997,1999]. Sim-
ilarly, networks with papers from 2000 to 2005
were split into networks G
Training
[2000,2002] and
G
Test
[2003,2005].
• Graph weighting - We created artificial edges be-
tween nodes connected in G
Training
. Then we cal-
culated ten weight values for each artificial edge.
Fi was the weighting criterion used to calculate
the first weight. FTi was used to calculate the
other nine weights. We ranged the values of the
damping factor β from 0.1 to 0.9. Each value of β
led to one of the nine weights.
• Identification of Core - In order to identify the
nodes that belong to the Core set, we considered
k = 3. Hence, Core consisted of all active au-
thors who had written at least 3 articles during the
training period and at least 3 articles during the
test period. Three reasons guided this choice: (a)
Training and test periods’ length of all networks
was three years; (b) We considered that one year
could be a reasonable frequency interval for paper
publication; (c) It was the same value defined in
(Liben-Nowell and Kleinberg, 2007), where sim-
ilar experiments were performed.
• Score Calculation - This step executed the sim-
ilarity metrics (WCN and WAA) for each artifi-
cial edges in each network. In order to better
present the results, we used the acronyms WCN
Fi
9
http://export.arxiv.org/api/
and WAA
Fi
to represent the similarity metrics cal-
culated with the weights produced by the Fi crite-
rion. Acronyms WCN
FTi(β)
and WAA
FTi(β)
were
used to represent the similarity metrics calcu-
lated with the weights produced by the proposed
weighting criterion.
• Performance Evaluation - The performances of
WCN
Fi
, WAA
Fi
, WCN
FTi(β)
and WAA
FTi(β)
were
compared to the performance of the random pre-
dictor. They represent the improvement factor of
the corresponding metric over the random predic-
tor.
4.3 Results
Tables 2 and 3 provide some statistics of the networks
after the Identification of Core step.
Table 2: Statistics about the first version of the networks
used in the experiments - papers from 1994 to 1999.
Network Authors Papers Core E
new
astro-ph 19864 21290 9616 2087
cond-mat 19289 21698 1336 723
gr-qc 5283 8299 390 137
hep-ph 12658 24294 1689 1950
hep-th 11229 20935 1192 767
Table 3: Statistics about the second version of the networks
used in the experiments - papers from 2000 to 2005.
Network Authors Papers Core E
new
astro-ph 42771 50359 6197 37362
cond-mat 48298 51809 4437 7507
gr-qc 8939 13858 812 463
hep-ph 17750 31707 2476 8246
hep-th 14212 27444 1893 1293
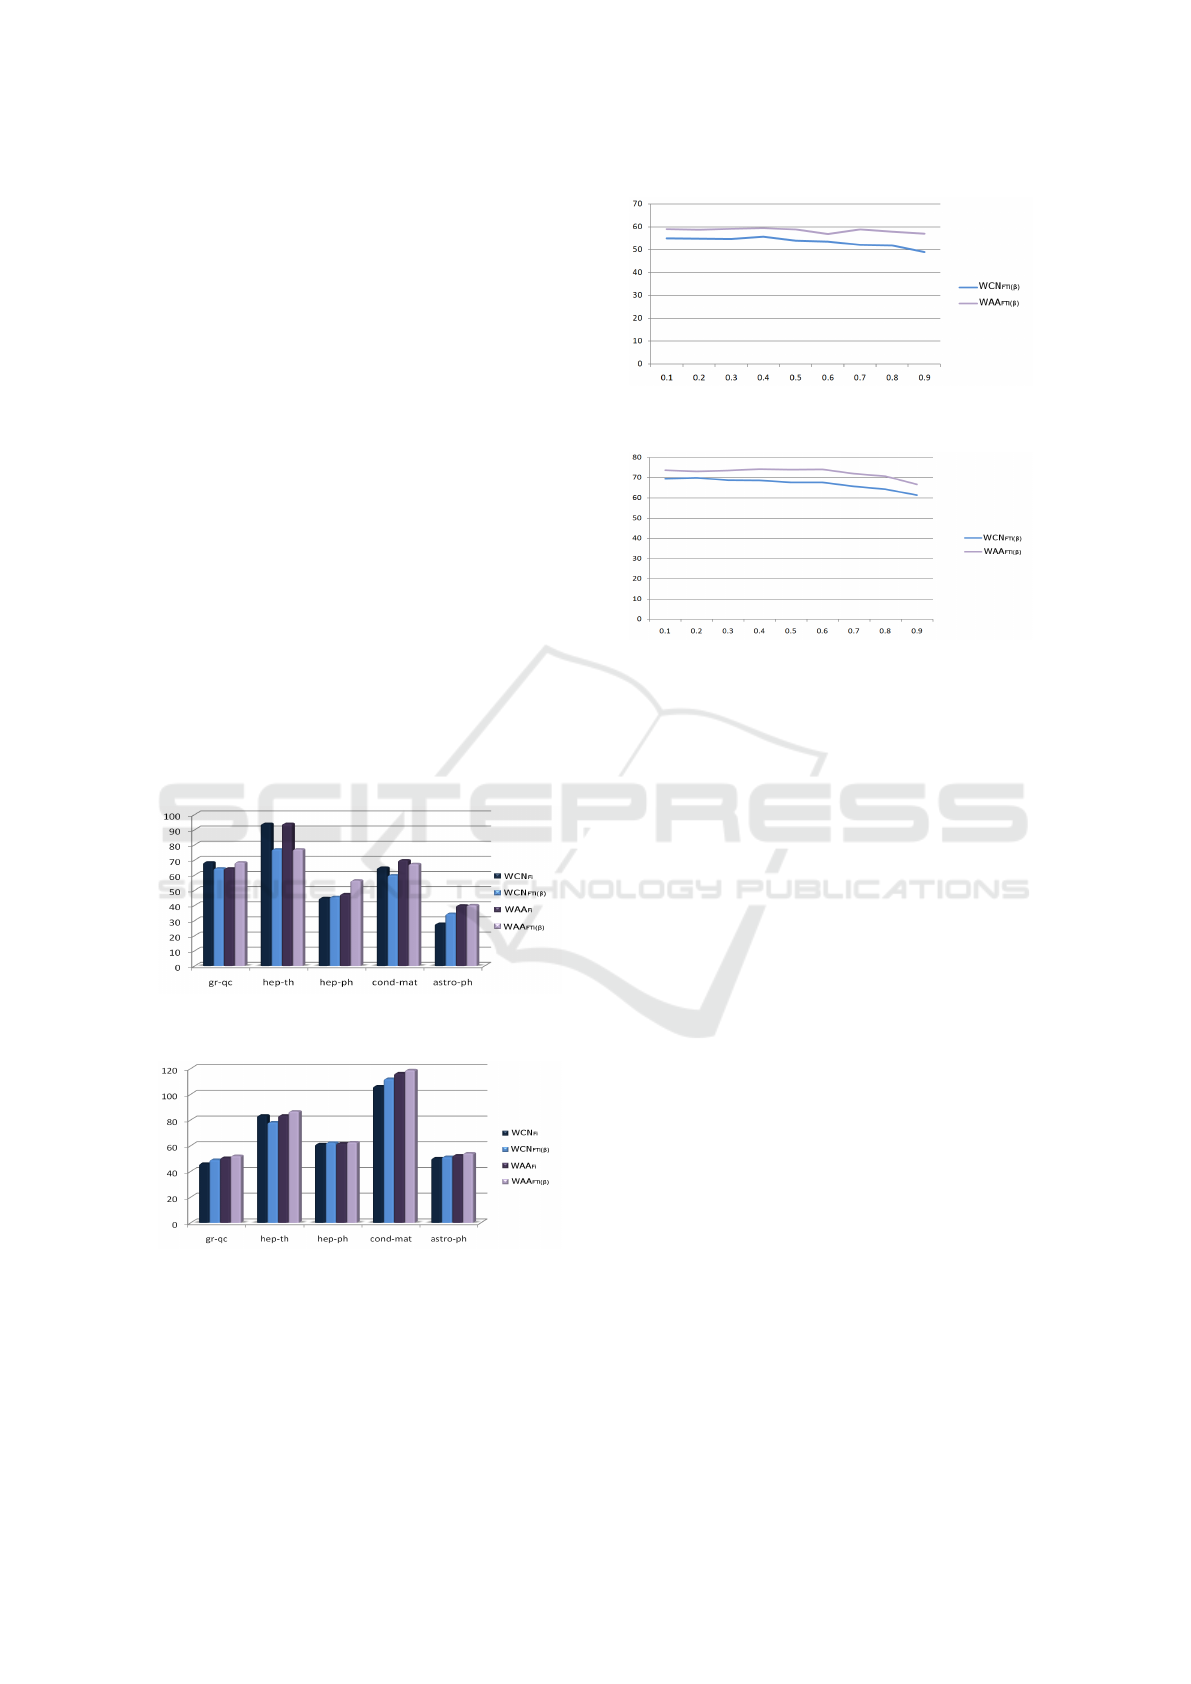
Figures 2 and 3 show each metric’s performance
on each network with respect to the improvement fac-
tor over the random predictor. An overall analysis re-
veals that no metric outperformed all the others in all
networks and periods. Nevertheless, a closer analysis
shows some interesting results.
In a pairwise comparison of metrics, WCN
FTi
and WAA
FTi
outperformed WCN
Fi
and WAA
Fi
in six
(60%) and seven (70%) out of ten networks, respec-
tively. It is also important to emphasize that WCN
FTi
and WAA
FTi
outperformed WCN
Fi
and WAA
Fi
in four
(80%) and five (100%) out of the five networks from
the second version, respectively. We believe that it
was due to the fact that those networks were more re-
cent (2000 to 2005) and, hence, more complete and
updated than the ones from the first version (1994 to
1999).
Using a Time based Relationship Weighting Criterion to Improve Link Prediction in Social Networks
77
In a pairwise comparison of weighting criteria,
FTi outperformed Fi in six (60%) out of ten net-
works. Five of those six networks belong to the sec-
ond version, reinforcing our theory about the com-
pleteness of the networks from that group. In two
networks, both criteria led to comparable results. Fi
outperformed FTi in just two networks.
All the above mentioned results confirm the Weak
Ties theory and our hypothesis that weighting links
based on temporal information may improve link pre-
diction.
Figures 4 and 5 present the average performance
obtained by the FTi parameter (damping factor) in the
similarity metrics WCN and WAA in the two versions
of the networks. For the first version of the network
the best performances were achieved with β = 0.4 for
both similarity metrics. The second version the best
performances for WCN were achieved with β = 0.2
and WAA were achieved with β = 0.6.
Finally, our results also revealed that WAA almost
always outperformed WCN in all networks. In fact,
FTi and Fi criteria did not alter such scenario. It in-
dicated that, regardless the weighting criterion, sec-
ondary and primary common neighbors may be useful
to produce better results than the ones produced with
just primary common neighbors.
Figure 2: Improvement factor of similarity metrics over the
random predictor - papers from 1994 to 1999.
Figure 3: Improvement factor of similarity metrics over the
random predictor - papers from 2000 to 2005.
5 CONCLUSIONS
Predicting whether a pair of nodes will connect in the
future is an important network analysis task known
Figure 4: Damping factor analysis - papers from 1994 to
1999.
Figure 5: Damping factor analysis - papers from 2000 to
2005.
as the link prediction (LP) problem. Various methods
have been developed to predict links in social meth-
ods. Some of them compute a compatibility degree
(link strength) between connected nodes in order to
get useful insights for LP. However, despite the ac-
knowledged importance of temporal data for the LP
problem, few initiatives investigated the use of this
kind of information to express link strength and the
corresponding consequence of it in link prediction.
Inspired by the Weak Ties social theory, in this pa-
per, we proposed a weighting criterion that combines
the frequency of interactions and temporal informa-
tion (FTi) about them in order to define the weights
(link strength) between pairs of connected nodes in
social networks. According to FTi, recent interac-
tions have higher influence than old ones in weight
calculation and, consequently, in LP. Our experiment
was performed over ten co-authorship networks pre-
viously used by many studies about LP. We compared
the performances produced by the traditional similar-
ity metrics weighted common neighbors (WCN) and
weighted Adamic-Adar (WAA), combined with two
weighting criteria: one was the proposed criterion
(FTi) and the other, state-of-art weighting criterion,
was based just on the frequency of interactions (Fi).
The results showed that WCN and WAA combined
with FTi outperformed WCN and WAA combined
with Fi in most networks, confirming our hypothesis
that weighting links based on temporal information
may improve link prediction.
As future work, we consider the formulation of a
weighting criterion that combines temporal, topologi-
ICEIS 2017 - 19th International Conference on Enterprise Information Systems
78

cal and contextual data, simultaneously. It would also
be interesting to evaluate the influence of our tem-
poral based weighting criterion in the supervised ap-
proach to the LP problem. Experiments of our crite-
rion with networks out of the context of co-authorship
would be desirable too. With a larger set of networks,
we also plan to check for statistically significant dif-
ferences among the results obtained by the weighting
criteria.
REFERENCES
Adamic, L. A. and Adar, E. (2003). Friends and neighbors
on the web. Social Networks, 25(3):211 – 230.
Barabasi, A. L., Jeong, H., Neda, Z., and Ravasz, E. (2001).
Evolution of the social network of scientific collabo-
ration. Social Networks, 25:211–230.
Choudhary, P., Mishra, N., Sharma, S., and Patel, R. (2013).
Link score: A novel method for time aware link pre-
diction in social network. In Prasad, D. N. H. and
Nalini, D. N., editors, 2013 Emerging Research in
Computing, Information, Communication and Appli-
cations. Elsevier Science and Technology.
Dunlavy, D. M., Kolda, T. G., and Acar, E. (2011). Tempo-
ral link prediction using matrix and tensor factoriza-
tions. ACM Trans. Knowl. Discov. Data, 5(2):10:1–
10:27.
Granovetter, M. S. (1973). The strength of weak ties. The
American Journal of Sociology.
Hasan, M. and Zaki, M. (2011). A survey of link prediction
in social networks. In Aggarwal, C. C., editor, So-
cial Network Data Analytics, pages 243–275. Springer
US.
Hasan, M. A., Chaoji, V., Salem, S., and Zaki, M. (2006).
Link prediction using supervised learning. In In Proc.
of SDM 06 workshop on Link Analysis, Counterterror-
ism and Security, pages 1–10.
Kuo, T.-T., Yan, R., Huang, Y.-Y., Kung, P.-H., and Lin,
S.-D. (2013). Unsupervised link prediction using ag-
gregative statistics on heterogeneous social networks.
In Proceedings of the 19th ACM SIGKDD Interna-
tional Conference on Knowledge Discovery and Data
Mining, number 19 in KDD ’13, pages 775–783, New
York, NY, USA. ACM. 19/07/2016.
Li, K., Du, N., and Zhang, A. (2012). A link predic-
tion based unsupervised rank aggregation algorithm
for informative gene selection. In Bioinformatics and
Biomedicine (BIBM), 2012 IEEE International Con-
ference on, pages 1–6.
Liben-Nowell, D. and Kleinberg, J. M. (2007). The link-
prediction problem for social networks. JASIST,
58(7):1019–1031.
Lu, L. and Zhou, T. (2010). Link prediction in complex
networks: A survey. CoRR, abs/1010.0725.
L
¨
u, L. and Zhou, T. (2010). Link prediction in weighted
networks: The role of weak ties. EPL (Europhysics
Letters), 89(1):18001.
Munasinghe, L. and Ichise, R. (2012). Time score: A
new feature for link prediction in social networks.
IEICE Transactions on Information and Systems,
E95.D(3):821–828.
Murata, T. and Moriyasu, S. (2007). Link prediction of
social networks based on weighted proximity mea-
sures. In Web Intelligence, IEEE/WIC/ACM Interna-
tional Conference on, pages 85–88.
Soares and Prud
ˆ
encio, R. B. C. (2011). Supervised link
prediction in weighted networks. In Neural Networks
(IJCNN), The 2011 International Joint Conference on,
pages 2281–2288.
Taha, H. (2007). Operations Research: An Introduction.
Pearson/Prentice Hall.
Valverde-Rebaza, J., Valejo, A., Berton, L.,
de Paulo Faleiros, T., and de Andrade Lopes, A.
(2015). A na
¨
Ive bayes model based on overlapping
groups for link prediction in online social networks.
In Proceedings of the 30th Annual ACM Symposium
on Applied Computing, SAC ’15, pages 1136–1141,
New York, NY, USA. ACM.
Wang, P., Xu, B., Wu, Y., and Zhou, X. (2015). Link predic-
tion in social networks: the state-of-the-art. SCIENCE
CHINA Information Sciences, 58(1):1–38.
Zhao, J., Miao, L., Yang, J., Fang, H., Zhang, Q.-M., Nie,
M., Holme, P., and Zhou, T. (2015). Prediction of
links and weights in networks by reliable routes. Sci-
entific reports, 5.
Zhu, B. and Xia, Y. (2016). Link prediction in weighted net-
works: A weighted mutual information model. PLoS
ONE, 11(2):1–13.
Using a Time based Relationship Weighting Criterion to Improve Link Prediction in Social Networks
79
