
Composite Alternative Pareto Optimal Recommender System
(CAPORS)
William Jeffries and Alexander Brodsky
George Mason University, 4400 University Drive 4A4, Fairfax, VA 22030, U.S.A.
Keywords: Recommender Systems, Decision Guidance, Decision Optimization, Pareto Optimum.
Abstract: We propose a methodology and present a system for generating composite alternative recommendations
combining user-guided continuous improvement with Pareto optimal trade-off considerations. The system
consists of (1) a model to generate the recommendation space; (2) metrics for measuring each
recommendation; (3) an analytics function for computing composite alternative metrics and constraints; (4)
system configuration settings; (5) an algorithm for calculating Pareto optimal curve of recommendations;
(6) an algorithm for generating user-guided improvements using relaxed constraints; (6) charting
functionality for plotting recommendations; (7) and a user interface for enabling users to accept or improve-
upon selected recommendations.
1 INTRODUCTION
Composite alternative recommender systems
recommend a combination of products and services,
based on multiple criteria such as price, availability,
and user ratings. They include recommenders for
vacation packages, investment portfolios, healthcare
plans, product bundles, and more.
Consider an example of a sourcing
recommender. In this case, a recommendation is a
set of orders, where an order contains a set of item
quantities to be purchased from a particular supplier.
Sourcing recommendations are associated with
multiple criteria such as cost, carbon emissions, and
fulfillment time. These recommendations are
composite since they contain multiple suppliers with
multiple items, and they are multi-criteria because of
the three metrics mentioned previously. The result
of generated recommendations must be Pareto-
optimal.
There has been extensive research conducted on
composite alternative recommenders in recent years.
This research comprises proposed methods and
presented systems, addressing both domain specific
and domain-independent recommenders.
Interdonato et al (2013) propose a graph-based
framework that uses Page Rank-style algorithm to
learn packages that conform to a user preference
model. The framework is ultimately based on user
rankings and identifies domain-independence as its
key feature. CARD (Brodsky, Henshaw and
Whittle, 2008) is a proposed framework for
generating optimal composite alternative
recommendations. CARD utilizes a SQL-based data
model for generating the recommendation space. It
also extends the SQL language in order to provide
diverse recommendations and to provide a
mechanism for learning user preferences. CARD is
a generic framework capable of being applied across
domains. There is no current implementation of the
CARD framework. FlexRecs (Koutrika, Bercovitz
and Garcia-Molina, 2009) is a proposed framework
for providing domain-independent
recommendations. The recommendation space in
FlexRecs is generated using workflows designed by
system implementers. As with CARD, the FlexRecs
framework is built on top of relational data models
and extended relational operators.
These three frameworks address composite
recommendations, but do not offer a system that
implements the framework, nor use methodology on
which the system functionality can be based.
Xie, Lakshmanan and Wood (2010) present a
generic package recommender system that uses a
variation of the knapsack problem to generate
optimal top-k recommendations. The
recommendation space in their system is generated
using individual component recommenders.
Furthermore, ratings are the only metric used to
496
Jeffries, W. and Brodsky, A.
Composite Alternative Pareto Optimal Recommender System (CAPORS).
DOI: 10.5220/0006277404960503
In Proceedings of the 19th International Conference on Enterprise Information Systems (ICEIS 2017) - Volume 1, pages 496-503
ISBN: 978-989-758-247-9
Copyright © 2017 by SCITEPRESS – Science and Technology Publications, Lda. All rights reserved

calculate recommendations. TopRecs+ (Khabbaz,
Xie and Lakshmanan, 2011) is another generic
package recommender that uses a variation of the
knapsack problem to find optimal top-k package
recommendations. As with Xie et al above,
TopRecs+ leverages individual item recommenders
to generate the composite alternative recommender
space. CompRec-Trip (Xie, Lakshmanan and
Wood, 2011) is a system for recommending travel
packages by finding the optimal alternatives using
user-supplied preferences and constraints. As Xie et
al’s other work mentioned above, the system uses
component recommender systems for generating the
recommendation space. The system is narrowly
focused, but allows flexibility through interaction
with the user.
These three systems generate composite
recommendations by aggregating single-item
recommenders. However, this aggregation does not
take into account interaction among the components
of the composite recommendation. Therefore,
neither offers an integrated composite alternative
methodology, which is often required when
components have a non-trivial interaction among
them. Also, in the case of CompRec-Trip, the
system is domain-specific and not designed to
accommodate general recommendation problems.
Ribeiro, et al (2015) propose two Pareto-efficient
approaches for recommender systems. In both
approaches, they propose using recommendation
accuracy, novelty, and diversity as the objectives to
consider when generating a Pareto-efficient list of
recommendations. One approach creates a Pareto-
efficient ranked list from multiple competing
recommendation algorithms. Their second approach
creates Pareto-efficient hybrid recommenders built
from individual recommender algorithms. While
both approaches apply Pareto-efficiency to their
recommendations, it is limited to the criteria of
accuracy, diversity, and novelty. However, many
package recommendations require diverse user-
defined criteria, such as cost, risk, benefit, etc.,
which is outside the scope of (Ribeiro et al, 2015).
Neither approach considers continuous user
feedback. Furthermore, both approaches are
proposed algorithms that do not include a system to
implement their methodology.
To our knowledge, there are no proposed
recommender systems that combine Pareto optimal
solutions for arbitrary user-defined criteria with
continuous user guidance. Nor is there a system
with this combination of features designed for
composite alternatives that have complex
interactions between them. Addressing these
limitations is the exact focus of this paper.
First, we develop a methodology for
recommending Pareto-optimal composite
alternatives based on (1) multi-criteria optimization
and (2) continuous user-guided feedback. The
methodology first generates an initial set of
recommendations based on Pareto-optimal curve for
two selected criteria (such as cost and benefit).
Then, the user iteratively improves the alternatives
through critique of additional criteria and re-
optimizations to iteratively generate a small subset
of user-selected Pareto-optimal alternatives. Finally,
the user extracts the final recommendation from this
small set.
Second, we develop a system called CAPORS
(Composite Alternative Pareto Optimal
Recommender System) that implements the
proposed methodology. CAPORS is implemented
using a Decision Guidance Management System
(DGMS) (Brodsky and Wang, 2008). In CAPORS
(as well as the underlying DGMS), the description of
all possible recommendation alternatives is captured
by the concept of an Analytical Model. The
Analytical Model formally describes (1) criterion of
interest (such as cost, benefit, risk, etc.) as a function
of recommendation control variables, and (2)
feasibility constraints on possible composite
recommendations. With the help of DGMS,
CAPORS manages the workflow of
recommendations improvement based on two key
algorithms: (1) generation of Pareto-optimal curve
for the recommendation Analytic Model along two
selected criteria and (2) generation of Pareto-optimal
improvement along the additional criteria that the
user asks to improve.
Third, we develop these two key algorithms
using DGMS.
Finally, as a case study to demonstrate
applicability to a real world problem, we implement
a sourcing recommender based on the domain-
independent CAPORS system and methodology.
This paper is organized into the following
sections. Section 2 demonstrates composite
alternative recommendation using a supply chain
sourcing example. Section 3 gives background on
some of the technologies relevant to the system.
Section 4 describes the core algorithms of the
system. Section 5 details the system architecture
and explains its various mechanics. Section 6
concludes and offers ideas for future extensions.
Composite Alternative Pareto Optimal Recommender System (CAPORS)
497
2 CAPORS FUNCTIONALITY BY
SOURCING EXAMPLE
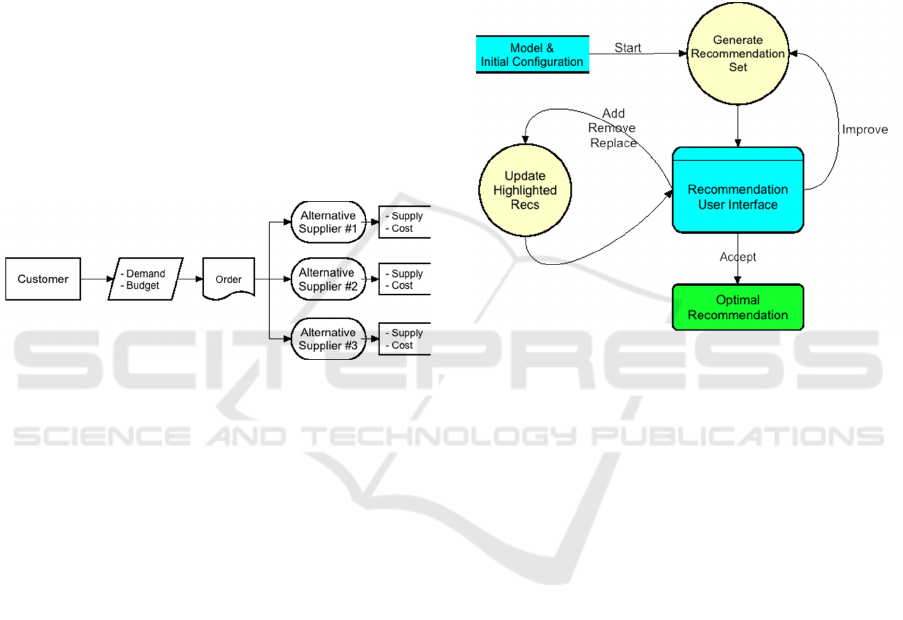
We explain the functionality of the system and
related methodology through the use of a supply
chain sourcing example, shown in Figure 1. Supply
chain sourcing is the process of locating the sources
of goods that a company needs to order. This
process usually has the goal of finding an order
configuration that meets the constraints set by the
company and is optimized according to one or many
criteria, such as cost, fulfillment time, and carbon
emissions.
The components of supply chain sourcing are (1) a
customer that needs to order items, (2) order
constraints such as item demand and budget, (3)
suppliers that offer items at a given price, and (4) an
order that defines which items are ordered from
which suppliers and in what quantities.
Figure 1: Supply Chain Sourcing.
Supply chains orders can potentially be
configured in so many different ways as to be
impractical for a human to thoroughly review and
consider. One way for decision guidance systems to
solve this issue is to simply optimize on a single
metric (e.g. total cost) and produce the least
expensive option. However, there may be other
metrics that the user would want to optimize, even if
it meant a supply chain configuration yielding a
higher cost. For instance, fulfillment time might be
a crucial metric to the user, so much so that they are
willing to trade off some cost in order to get an
alternative with a faster fulfillment time.
Consider the scenario of a small supply chain
consisting of items, demand, and suppliers. The
goal is to construct an order that will define which
items will be ordered from which suppliers. The
order must meet certain specified constraints, such
as demand. Analysis is executed on the order to
compute metrics, such as order cost, carbon
emissions, and fulfillment time.
In this scenario, CAPORS can be used to
generate a recommendation. A recommendation is a
set of orders, with each order defined by (1) a
supplier id representing a specific supplier, (2) an
item id representing a specific item, and (3) quantity
of ordered item.
Each recommendation is associated with a set of
metrics: (1) cost per item, (2) carbon emissions
produced for each item, and (3) fulfillment time, i.e.
the time in days it will take to fulfill all items in the
order.
The methodology used by CAPORS for
generating the optimal recommended order is
captured as a state-activity diagram, shown in Figure
2.
Figure 2: CAPORS Methodology.
To generate an initial set of recommendations,
the system needs two components: (1) an analytics
model and (2) a set of configuration settings. The
analytics model contains (1) data needed to generate
the recommendation space, (2) order constraints, and
(3) an analytics function for computing order
metrics. The configuration settings include the
number of recommendations to generate, metrics
definitions, and the initial two metrics to consider
for the first set of recommendations (defined as core
cost and core benefit in the configuration settings).
These settings are captured in the Model & Initial
Configuration State, depicted in the upper left corner
of Figure 2.
After CAPORS receives the analytics model and
initial configuration, the system generates the first
set of recommendations for the user to consider.
Each recommendation consists of an order
configuration and computed metrics. The computed
metrics in this example are order cost, total amount
of carbon emissions, and the time (in days) that it
will take to fulfill the entire order. The Generate
Recommendation Set activity (shown at the top
middle of Figure 2) generates the information
necessary to display in the Recommendation User
Interface State (shown in the middle of Figure 2).
ICEIS 2017 - 19th International Conference on Enterprise Information Systems
498
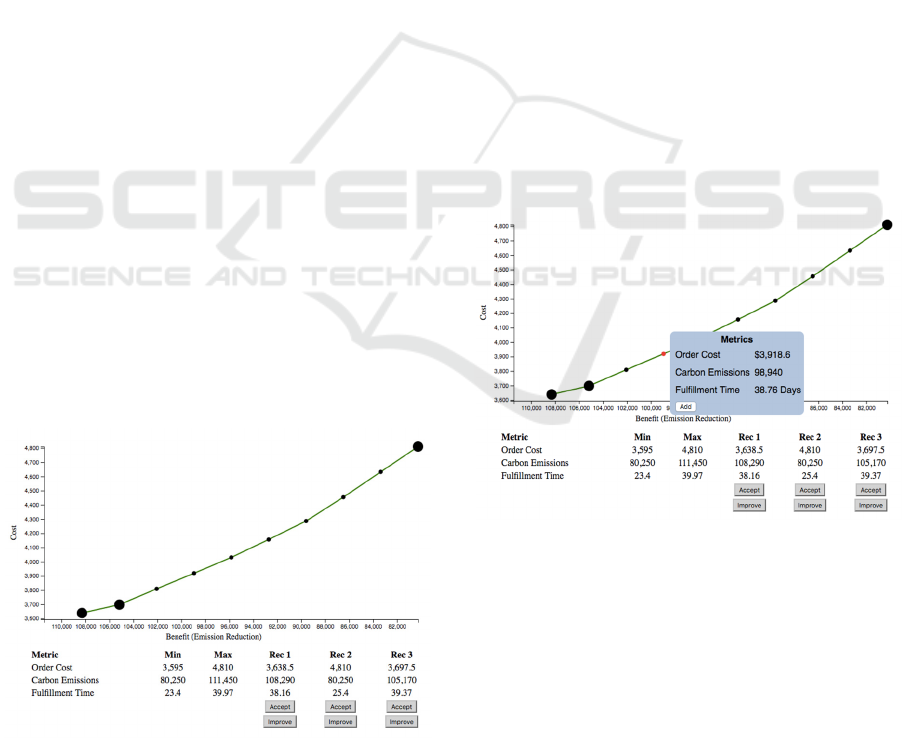
The Recommendation User Interface itself is
shown in Figure 3. The Recommendation User
Interface displays the recommendations using two
main components: (1) line chart and (2) a table. The
line chart shows all of the generated
recommendations, which fall along a Pareto optimal
curve. The recommendations are plotted along two
axes: (1) cost along the y-axis and (2) benefit along
the x-axis. In this example, the y-axis represents
order cost and the x-axis represents carbon emission
reduction. Each point on the displayed line chart is
Pareto-optimal, that is there does not exist a
recommendation that improves on one metric
without sacrificing another.
For the initial recommendation set, the system
automatically selects three recommendations to be
part of the Closer Consideration Set displayed as a
table at the bottom of Figure 3. The Closer
Consideration Set contains recommendations that
the user can interact with (described further below).
The initial Closer Consideration Set contains (1) the
recommendation with the minimal cost, (2) the
recommendation with the maximal benefit, and (3)
the recommendation with the greatest benefit/cost
ratio, relative to the minimum cost recommendation
(the leftmost point). The recommendations that
belong to this set appear as bigger circles.
In addition to the line chart, the
Recommendation User Interface also displays the
Closer Consideration Set in a table underneath the
chart. The table contains the following information:
(1) list of metrics, (2) the overall minimum and
maximum possible for each metric, as constrained
by the user, (3) the metric values for each
recommendation in the Closer Consideration Set,
and (4) buttons for accepting or improving a
recommendation.
Figure 3: Recommendation User Interface.
After the Recommendation User Interface
displays the line chart and Closer Consideration Set
table, the user has three options: (1) accept one of
the highlighted recommendations, (2) modify the
Closer Consideration Set, or (3) request a new set of
recommendations by improving upon one of the
recommendations in the Closer Consideration Set.
The user can accept a recommendation by
pressing the “Accept” button underneath the selected
choice. This puts the system in the terminal Optimal
Recommendation State (shown in bottom of Figure
2) as no further improvements are needed.
Before accepting or improving-upon one of the
selections, the user can modify the Closer
Consideration Set. Modification actions include (1)
adding a recommendation to the Closer
Consideration Set, (2) removing a recommendation
from the Closer Consideration Set, and (3) replacing
one of the recommendations in the Closer
Consideration Set.
A user adds a recommendation by right-clicking
on one of the small circles on the graph and pressing
the “Add” button, as shown in Figure 4. The user
interface then increases the size of the
recommendation circle on the chart and adds the
recommendation metrics to the Closer Consideration
Set table beneath the chart.
Figure 4: Add recommendation to Closer Consideration
Set.
Similarly, a user removes a recommendation
from the Closer Consideration Set by right-clicking
and pressing “Remove” (shown in Figure 5). Again,
the user interface reflects this new state by reducing
the size of the recommendation circle and removing
the recommendation from the table.
Composite Alternative Pareto Optimal Recommender System (CAPORS)
499
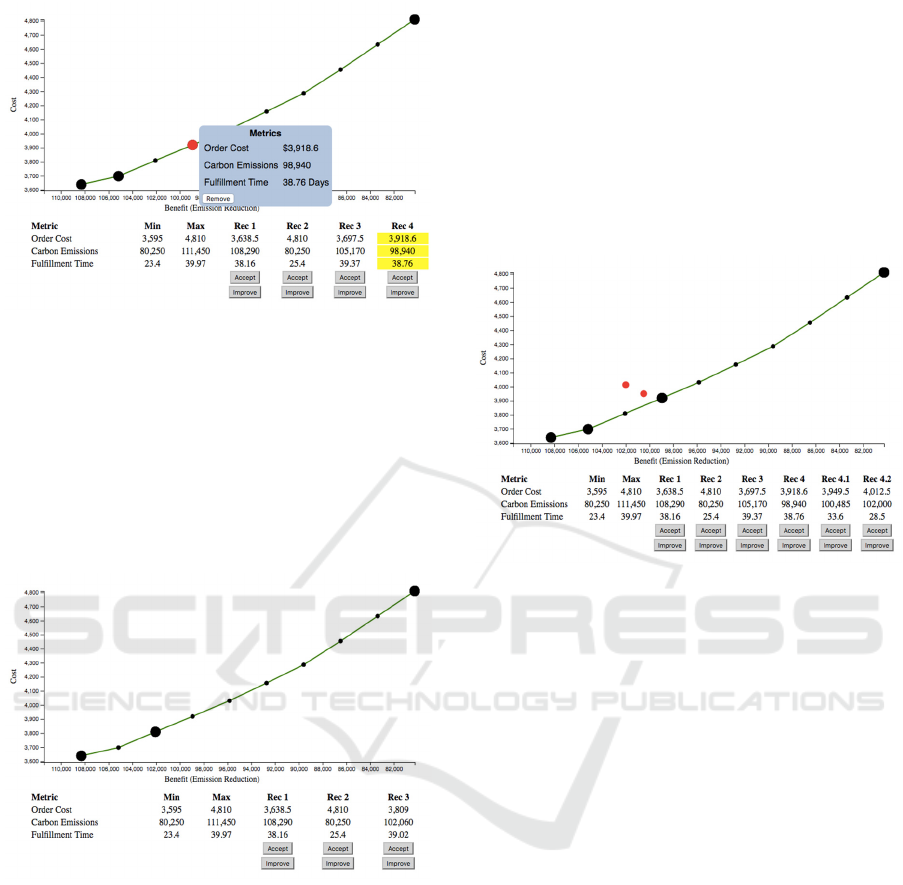
Figure 5: Remove recommendation from highlighted
subset.
To replace a recommendation, the user simply
drags the circle of the old recommendation over top
the circle of the new recommendation on the chart.
The recommendations’ circle size change
accordingly on the chart and the old
recommendation is replaced in the table by the new
recommendation (shown in Figure 6).
Figure 6: Replaced recommendation.
If one of the recommendations is not accepted as
optimal, the user can generate additional
recommendations by improving upon one of the
recommendations in the Closer Consideration Set.
To do that, the user clicks on the metric to be
improved (Fulfillment Time, for example), chooses
the most desirable recommendation, and presses the
“Improve” button underneath its entry in the
recommendation table. By using the selected
recommendation as a starting point, a new set of
recommendations is generated that improves the
selected metric while relaxing the non-dominated
constraints in the x and y dimensions (cost and
emission reduction, for example). The new
recommendation set is overlaid on the chart and
displayed using red circles. The new
recommendation set is also displayed in the
highlighted table under the chart. The new
recommendations are not automatically placed on
the graph. But if the user decides to add to the
Closer Consideration Set, then they are labelled
using decimal numbers to indicate which original
recommendation they were generated from, shown
in Figure 7.
Figure 7: Improved recommendations.
3 RECOMMENDATION
GENERATION
The implementation of system functionality
described in Section 2 requires algorithms to
compute the Pareto-optimal curve and the improved
recommendations (Figure 7). These algorithms are
detailed in Section 4. To support these algorithms,
we need to be able to (1) represent a
recommendation, (2) represent a set of all feasible
recommendations, and (3) find an optimal
recommendation in terms of one of the metrics when
other metrics are constrained. In this section, we
explain how these are done, using our example.
We represent a recommendation using a data
structure expressed in JSON (JavaScript Object
Notation, 2016). JSON is a minimal data structure
that represents data as objects consisting of
key/value pairs. In our sourcing example, a
recommendation captures purchase quantities for
each item and each supplier.
In Figure 8, each outer pair of curly braces
defines the purchase items for a particular supplier.
Each supplier is identified by a “supplier” field that
denotes a specific supplier. Along with the
“supplier” field is an array of items to be ordered
ICEIS 2017 - 19th International Conference on Enterprise Information Systems
500
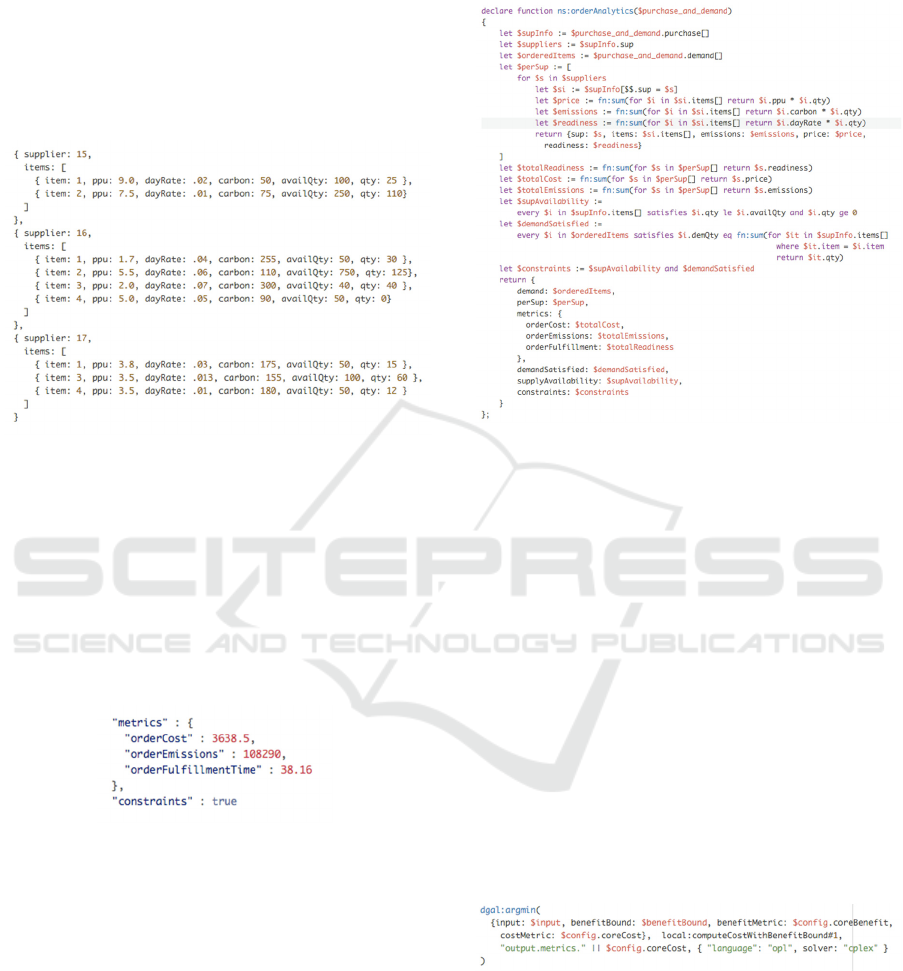
from that supplier. Each item contains “item” to
identify the item, “ppu” containing the price-per-
item, “dayRate” defining the number of items that
can be fulfilled per day by the supplier, “carbon”
showing the amount of emissions per item,
“availQty” for the available quantity for the item,
and “qty” for the actual quantity to be ordered for
the item.
Figure 8: Sourcing recommendation JSON.
Every recommendation (as in Figure 8) is
associated with metrics (orderCost, orderEmissions,
orderFulfillment) and the key constraints that are
true if all feasibility constraints for the order (such as
satisfaction of demand and supply availability) are
satisfied. These metrics and constraints are also
expressed in JSON. For the recommendation shown
in Figure 8, computed metrics and constraints are
shown in Figure 9.
Figure 9: Metrics and constraints.
The set of all feasible recommendations are
represented implicitly by using the notion of an
analytical model expressed in JSONiq (Fourny,
2013). JSONiq is an expressive functional language
used to query and process JSON data. An analytical
model is a function that describes how metrics and
constraints are computed from a recommendation
instance (like in Figure 8). For our sourcing
example, the function is given in Figure 10. Given
an analytical model, the set of feasible
recommendations is the set of JSON inputs with all
possible non-negative values for quantities that
satisfy the constraints (i.e. return a value of true for
the constraints variable computed by the analytical
model).
Figure 10: Analytical model.
Given an analytical model, one may want to find
an input (the qty fields in Figure 8) that would
optimize a metric. For example, one may want to
minimize the orderCost metric while keeping the
constraints satisfied and bounding another metric
(e.g. orderEmissions <= x). This is done by
invoking the function argmin (or argmax) of the
Decision Guidance Analytics Language (DGAL)
(Brodsky, Luo and Nachawati, 2015). DGAL is a
language used to express tasks to be executed by a
DGMS. DGAL tasks are expressed using JSONiq
and operate on analytic models defined using JSON.
In our sourcing example, a DGAL expression is
used to minimize and maximize specific metrics in
order to construct recommendations. Figure 11
shows an example of using DGAL to express an
argmin operation to produce an optimized order,
given restraints.
Figure 11: DGAL optimization expression.
For the optimization to work, the input to the
argmin or argmax function of the DGMS must
include parametrized fields in its input. These
parameterized fields are decision variables that need
to be optimized. In the sourcing example, we make
the “qty” field parameterized, since this is the
variable that we want to generate for the
Composite Alternative Pareto Optimal Recommender System (CAPORS)
501
recommendations. Figure 12 shows an example of
the parameterized input that is used for optimization.
Figure 12: Parameterized optimization input.
The argmin function takes the analytical model
(from Figure 10) and the parametrized input (from
Figure 12) and returns a JSON structure containing a
concrete recommendation (like the one shown in
Figure 8) as well as computed metrics and
constraints (as shown in Figure 9).
4 KEY CAPORS ALGORITHMS
CAPORS consists of two key algorithms: (1) Pareto-
optimal chart algorithm, and (2) recommendation
improvement algorithm.
The Pareto-optimal algorithm accomplishes the
following: (1) accepts and verifies system input; (2)
generates bounds for recommendations; (3)
optimizes recommendations by integrating with a
DGMS; (4) filters out recommendations that don't
fall along Pareto-optimal curve; (5) outputs final
recommendation set of points.
Function: Pareto-Optimal Recommendations
Input: M (analytic model), r (metrics), c
(configuration)
Output: Pareto-optimal recommendation points
/*find ranges for each metric using model */
ranges = calculateMetricsRanges(M, r)
/*find x-axis points from min to max */
benefitRange = ranges[benefitMetric]
n = c.numRecommendations
bPoints= computeBenefitPoints(benRange, n)
/* optimize cost at each benefit point */
costPoints = optimizeCost(M, bPoints)
/* remove points that don’t improve */
finalCurve = filterCostPoints(costPoints)
The recommendation improvement algorithm is
responsible for generating a set of recommendations
that improve upon an existing recommendation
using an alternative metric. This function calculates
a set of relaxed bounds for which the DGMS can
generate a new set of recommendations. The
function computes improved values for the
alternative metric and relaxed values for cost and
benefit metrics. DGAL uses these new constraints
to generate new composite alternatives.
Function: Recommendation Improvement
Input: M (analytic model), c
(configuration), R (starting recommendation
point), a (alternative metric)
Output: Pareto-optimal recommendation points
/*calculate alternative metric points */
altMetricPts = computeAltMetricPoints(R, a)
/*optimize cost at each altMetric point*/
n = c.numAltRecommenations
e = epsilon
newPoints = []
for i=1 to n do
bounds = R.cost + (e * i)
p = altMetricPoints[i-1]
newRec = optimizeRelaxedCost(M, R, p,
bounds)
newPoints.add(newRec)
/* remove points that don’t improve*/
finalCurve = filterAltMetricPts(newPoints)
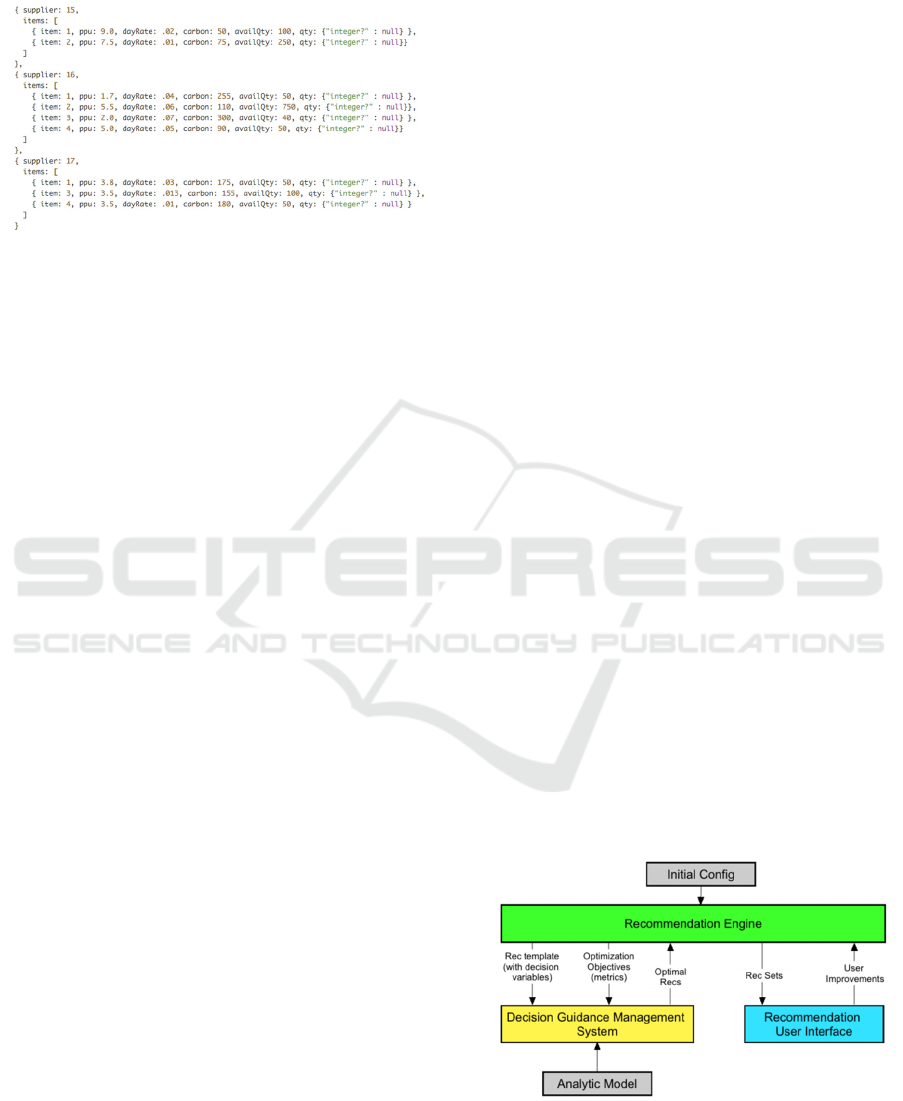
5 SYSTEM ARCHITECTURE
The system consists of two core internal
components: (1) Recommendation Engine, which
implements both the Pareto-optimal algorithm and
the recommendation improvement algorithm, and
(2) Recommendation User Interface for displaying
results and enabling user-guided improvement of
recommendations. The Recommendation Engine is
further integrated with DGMS for: (1) generating
recommendation space and computing metrics, and
(2) executing argmin and argmax functions.
Figure 13: System Architecture.
The Recommendation Engine must be
ICEIS 2017 - 19th International Conference on Enterprise Information Systems
502

configured with several elements, in order to
generate the initial Pareto-optimal curve: (1) a data
model used to generate the full recommendation
space, (2) defined metrics for measuring each
recommendation, and (3) other miscellaneous
configuration points, such as number of
recommendations to produce.
The Recommendation Engine integrates with a
DGMS in order to generate the domain-specific
recommendations based on the input model.
Furthermore, the DGMS provides the capability of
calculating metrics on each recommendation. Any
DGMS can be seamlessly integrated into CAPORS
simply by implementing a JSONiq function that
conforms to a signature specified by CAPORS.
The JSON output of the recommendation engine
is fed directly to the user interface. The user
interface is written in HTML and JavaScript. The
JavaScript functions of the user interface perform
the following: (1) load the recommendation JSON
records; (2) bind JSON data to D3JS (Data Driven
Documents, 2016) charting library; (3) format the
recommendation chart; (4) determine the initial
Closer Consideration Set; (5) display Closer
Consideration Set in a table; (6) draw improved
recommendations onto chart; (7) handle all user
interactions (add, remove, replace, improve, accept).
6 CONCLUSIONS
In this paper we proposed a methodology for
generating composite alternative recommendations,
based on Pareto-optimal trade-off consideration and
continuous user feedback. The methodology
improves upon earlier research by introducing the
combination of optimized recommendations along a
Pareto-optimal curve with the ability of users to
repeatedly optimize an alternative metric until an
optimal recommendation is generated and accepted.
Furthermore, we presented a system, CAPORS,
which implements the proposed methodology.
CAPORS utilizes existing technologies such as
JSON, JSONiq, DGAL, and D3JS to provide a
working framework for the proposed methodology.
CAPORS is designed using abstractions such that
the system is domain-independent, a big
improvement over the majority of existing
composite recommenders.
This work is a first step in our work towards a
domain-independent, optimal, composite-alternative
recommender system. In future work, we will
extend the capabilities by introducing machine
learning and data mining concepts to the
methodology and system.
REFERENCES
Xie, M., Lakshmanan, L.V. and Wood, P.T., 2010,
September. Breaking out of the box of
recommendations: from items to packages. In
Proceedings of the fourth ACM conference on
Recommender systems (pp. 151-158). ACM.
Brodsky, A., Morgan Henshaw, S. and Whittle, J., 2008,
October. CARD: a decision-guidance framework and
application for recommending composite alternatives.
In Proceedings of the 2008 ACM conference on
Recommender systems (pp. 171-178). ACM.
Khabbaz, M., Xie, M. and Lakshmanan, L.V., 2011.
TopRecs+: Pushing the Envelope on Recommender
Systems. IEEE Data Eng. Bull., 34(2), pp.61-68.
Interdonato, R., Romeo, S., Tagarelli, A. and Karypis, G.,
2013, November. A versatile graph-based approach to
package recommendation. In Tools with Artificial
Intelligence (ICTAI), 2013 IEEE 25th International
Conference on (pp. 857-864). IEEE.
Koutrika, G., Bercovitz, B. and Garcia-Molina, H., 2009,
June. FlexRecs: expressing and combining flexible
recommendations. In Proceedings of the 2009 ACM
SIGMOD International Conference on Management of
data (pp. 745-758). ACM.
Xie, M., Lakshmanan, L.V. and Wood, P.T., 2011, April.
Comprec-trip: A composite recommendation system
for travel planning. In Data Engineering (ICDE), 2011
IEEE 27th International Conference on (pp. 1352-
1355). IEEE.
Brodsky, A. and Wang, X.S., 2008, January. Decision-
guidance management systems (DGMS): Seamless
integration of data acquisition, learning, prediction and
optimization. In Hawaii International Conference on
System Sciences, Proceedings of the 41st Annual (pp.
71-71). IEEE.
Brodsky, Alexander, Juan Luo and M. Omar Nachawati,
2016. “Toward Decision Guidance Management
Systems: Analytical Language and Knowledge Base.”
Technical Report GMU-CS-TR-2016-1. Extension of:
Brodsky, A. and Luo, J., 2015, April. Decision
Guidance Analytics Language (DGAL)-Toward
Reusable Knowledge Base Centric Modeling. In
ICEIS (1) (pp. 67-78).
JavaScript Object Notation 2016. Available from:
<http://json.org/>. [9 August 2016]
Fourny, G. (2013). JSONiq The SQL of NoSQL.
Data Driven Documents 2016. Available from
<https://d3js.org>. [9 August 2016]
Ribeiro, M.T., Ziviani, N., Moura, E.S.D., Hata, I.,
Lacerda, A. and Veloso, A., 2015. Multiobjective
pareto-efficient approaches for recommender systems.
ACM Transactions on Intelligent Systems and
Technology (TIST), 5(4), p.53.
Composite Alternative Pareto Optimal Recommender System (CAPORS)
503
