
An Architecture for Visualization of Industrial Automation Data
Guillaume Pr
´
evost, Jan Olaf Blech, Keith Foster and Heinrich W. Schmidt
RMIT University, Melbourne, Australia
Keywords:
Industrial Automation, Cloud-based Services, Data Visualization.
Abstract:
We introduce a framework for visualization of data originating from industrial automation devices. Our frame-
work uses cloud-based services to collect data from industrial automation controllers. Clients can subscribe
to the data sources and visualize them in accordance with customer needs. Data from industrial automation
facilities is associated with formal semantic models, such as a mathematical representation of the material
flow in a production plant. The formal models are used to represent interdependencies between entities, their
functionality and other descriptive elements. Ultimately this is used in the visualization and for reasoning
about systems. In addition to the software framework we describe work on our demonstrator: an example
factory with Raspberry Pi-based controllers that are interconnected via standard ethernet technology.
1 INTRODUCTION
Connecting controllers in factories to internet services
comes with a variety of benefits with respect to oper-
ation and maintenance. Recent trends are frequently
summarized under the term Industry 4.0 (Kagermann
et al., 2013). Automation controllers communicat-
ing with centralized cloud-based services can not only
be used for classical supervisory control and data ac-
quisition (SCADA) tasks, but can also be used for
services that are orthogonal to SCADA functionality.
Such tasks can comprise additional data analytics and
visualization functionality (see, e.g., ABB’s service
port framework
1
) as well as remote health monitor-
ing (see, e.g., (Wenger et al., 2016)). In our work, we
are particularly interested in remote monitoring, op-
eration and maintenance of production plants. For ex-
ample supporting mining site operations, e.g., in the
Australian outback is a target area.
In this paper, we introduce a cloud-based frame-
work to gather data from controllers and visualize
the data using a web-based frontend. While a vari-
ety of products already exist for visualizing industrial
facilities such as Dassault Syst
`
emes’ Delmia and En-
ovia(Dassault Systemes Delmia, 2013; Dassault Sys-
temes Enovia, 2013), we focus on the cloud-based
architecture and on a more abstract data visualiza-
tion view. Visualization is based on formal mod-
els. In particular, we are interested in models that
1
http://new.abb.com/process-automation/process-auto
mation-service/advanced-services/serviceport
express spatio-temporal relationships between enti-
ties. A variety of formalisms for spatio-temporal
models have been developed. More process algebra-
like approaches (Caires and Cardelli, 2003; Caires
and Cardelli, 2004) can have benefits when investigat-
ing concurrency. On the modeling side, our approach
is similar to the qualitative predicates of the Region
Connection Calculus (RCC) (Bennett et al.,2002) that
can express inclusion, neighborhood and similar spa-
tial properties. Furthermore, the cardinal direction
calculus (Skiadopoulos and Koubarakis, 2005), the
rectangle algebra (Balbiani et al., 1999), and the cross
calculus (Van de Weghe et al., 2005) use comparable
means of abstracting from concrete geometric objects
in models. On the other hand, semantic descriptions
of services in the industrial automation area have been
discussed (see, e.g., (Loskyll et al. 2011)) as well
as ontologies for factory automation (e.g. (Lin and
Harding, 2007)).
The main contributions of this paper are the use
of semantic data models for industrial automation in
combination with our cloud-based visualization plat-
form. Furthermore, a demonstrator combining these
technologies is presented. The demonstrator can be
used to analyze production plant operations remotely.
Our data modeling language is introduced in Sec-
tion 2. The cloud-based data visualization platform is
presented in Section 3, while the demonstrator is pre-
sented in Section 4. A conclusion and future work are
presented in Section 5.
38
Prévost, G., Blech, J., Foster, K. and Schmidt, H.
An Architecture for Visualization of Industrial Automation Data.
DOI: 10.5220/0006289700380046
In Proceedings of the 12th International Conference on Evaluation of Novel Approaches to Software Engineering (ENASE 2017), pages 38-46
ISBN: 978-989-758-250-9
Copyright © 2017 by SCITEPRESS – Science and Technology Publications, Lda. All rights reserved

2 BeSpaceD DATA-MODELS
In our work, semantic models as well as data in
production plants is formalized using the BeSpaceD
framework (Blech and Schmidt, 2014). We briefly in-
troduce the language then describe the data structures
used in the models.
2.1 BeSpaceD
BeSpaceD is a framework for spatio-temporal model-
ing and reasoning. It comprises:
• A language for modeling spatio-temporal systems
and representing data. The language serves as a
domain specific language (DSL) and is realized
using abstract datatype constructors provided by
the Scala programming language. The language
comprises logical operators such as conjunctions,
disjunctions and implications as well as operators
for time and space as basic entities.
• A library-like collection of operations to reason
about the BeSpaceD models as well as import and
export functionality. Typical operations comprise
abstractions and property detection (such as colli-
sions in time and space).
In the past, BeSpaceD was successfully applied to do-
mains such as train systems (Hordvik et al., 2016),
industrial automation (Blech et al., 2015) and smart
energy systems (Blech et al., 2016).
2.2 Graphs Representing Industrial
Plants
Most of our models for production plants are repre-
sented as graphs (L, E) comprising a set of locations
L and edges E. Typically L can refer to machines, sen-
sors and actuators in a plant while the elements of E
represent interdependencies such as connections, ma-
terial flow, distances, communication channels. Both
edges and locations can be annotated. To give a look
and feel, we have realized the following constructors
for graphs in BeSpaceD/Scala:
class BeGraphAnnotated[+N, +A]
(terms: List[EdgeAnnotated[N, A]])
extends BIGAND[EdgeAnnotated[N, A]](terms)
class EdgeAnnotated[+N, +A]
(val source : N, val target : N,
val annotation: Option[A])
extends ATOM
For example, we have modeled different aspects
of our factory demonstrator. In the evaluation of our
framework, we are particularly interested in the mate-
rial flow topology. This represents the expected flow
– between sensors and actuators – of material through
the factory. We created a specialized subclass of our
graph. The following provides a small excerpt of our
graph-based formal model. The listing below shows
the definition of an edge in a graph and its use in a
very small graph definition comprising a set of two
edges. The topology does not need to be static, it can
change over time. To represent this, we can annotate
the graphs with time constraints.
def edge(s: FestoSensor, t: FestoSensor) =
EdgeAnnotated(s, t, Some(ProcessSequence))
BeGraphAnnotated[FestoSensor,
TemporalFestoConnection] (
edge(CapDispenser.StackEjectorRetracted,
CapDispenser.StackEjectorExtended) ˆ
edge(CapDispenser.StackEjectorExtended,
CapDispenser.StackEmpty)
)
The nodes (e.g. StackEjectorRetracted) are
objects that uniquely identify a sensor in the demon-
strator.
2.3 Sensor Data
In addition to the static nature of the plant models,
we use BeSpaceD to treat live sensor data. Sen-
sor data comprises a sensor identifier that should
have a corresponding node in the plant model. Fur-
thermore, it is associated with a timestamp and
the actual sensor value. For example, we use
the following construct is used to specify that
the sensor StackEjectorRetracted has the value
Obstructed(High) at a timepoint 1479976418134
INSTATE(StackEjectorRetracted, 1479976418134,
Obstructed(High))
The long integers for the time point are recording
milliseconds since Epoch (12:00am, Jan 1st, 1970).
Sensor data can be sent using the JSON format.
The example above is encoded as follows:
{"type": "IMPLIES",
"premise":{"type": "BIGAND", "terms": [
{"type": "Component",
"id": "Stack Ejector Retracted"},
{"type": "TimePoint",
"timepoint": 1479976418134}
]},
"conclusion": {"type": "Obstructed",
"signal": High}
}
An Architecture for Visualization of Industrial Automation Data
39

3 CLOUD-BASED REPORTING
AND DATA VISUALIZATION
This section describes the software platform for the
visualization of plant data and data-models formal-
ized using the BeSpaceD framework.
3.1 eStoRED
eStoRED is an open source data visualization plat-
form for industrial decision support and risk assess-
ment. Its architecture is shown in Figure 1. It en-
ables the joint-visualization of data from various data
sources or workflows. The visualization is realized
using a centralized platform, to make sense of the var-
ious pieces of data as a whole, and to provide a way
of collaboratively telling a meaningful story about
the data. The eStoRED reporting tool offers a way
to connect to data sources, retrieve data and visual-
ize it along with the possibility to attach metadata.
Possible data sources comprise streamed data (such
as sensor data delivered over a network connection),
web-services, relational databases and file systems. In
eStoRED, users can add their own analysis and risk
definition assessment, thereby enriching and adding
value to the data displayed. This allows building data-
backed comprehensive reports. The eStoRED system
can handle static data extracted from files or databases
as well as live data – such as data coming from sen-
sors – given that there exist a connector to the data
source.
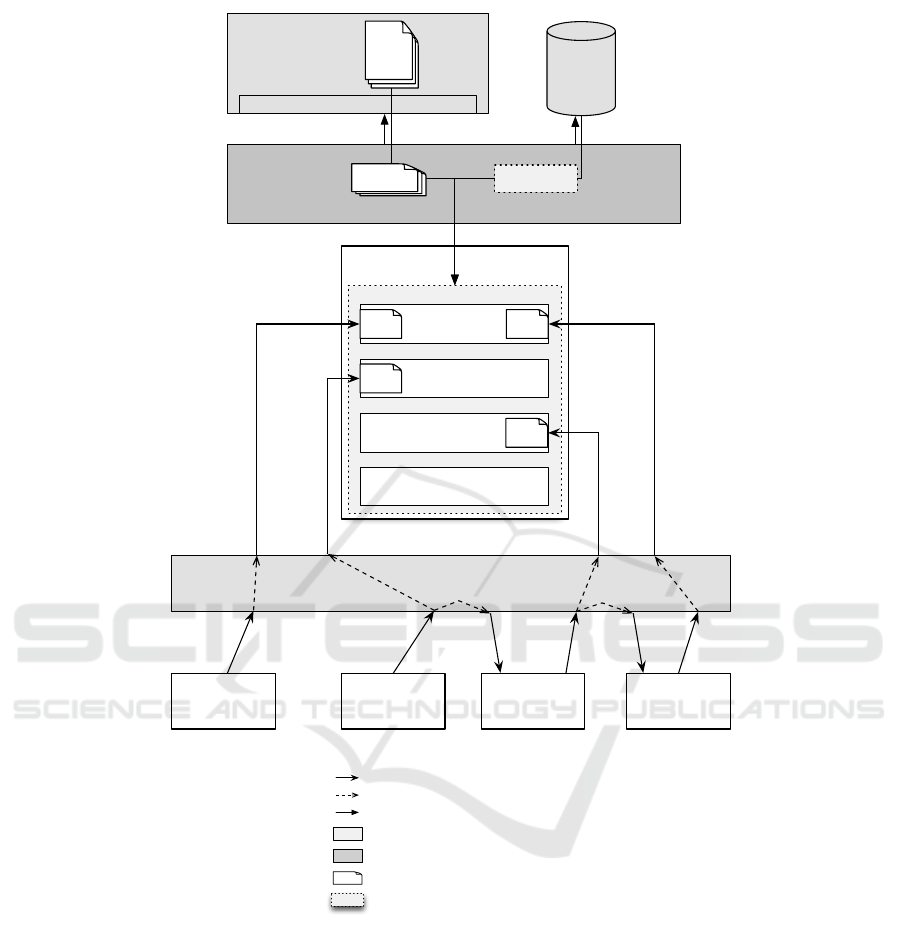
3.2 Architecture
In eStoRED, the main entities created by users are
called Stories. Stories contain different Elements:
Data Elements are the connected elements visualiz-
ing data, Input Elements are the analysis parts written
by the users. At its core, the eStoRED platform is
composed of a web application backed by a relational
database, a message broker and a repository of snip-
pets of code for visualizing data, called Vislets. We
describe eStoRED’s components and how they inter-
act together:
• On one end, the data sources are the processes, ap-
plications and systems that produce the data. They
publish data into messages handled by a publish /
subscribe system that orchestrates and distributes
messages to the processes that have subscribed.
The third-party system chosen for this role is Rab-
bitMQ
2
, an open-source, secure, robust and scal-
2
https://www.rabbitmq.com
able system for software messaging, using the
AMQP protocol
3
.
• The Java web application is using the Spring
MVC framework, Hibernate ORM to map its data
model to a MySQL database storing the internal
eStoRED data (Stories, Data Elements, Input El-
ements, etc.). When working on a Story, a user
can create Data Elements and define one or more
Subscriptions for each of them.
• A Subscription is composed of a subscription ex-
pression, the expected format of the data to be re-
ceived and the snippet of code, called Vislet that
will handle and visualize the data once it is re-
ceived. eStoRED is connected via a REST API
to a curated repository of Vislets and can filter
them according to some metadata attached to each
Vislet. The eStoRED graphical user interface au-
tomatically filters the Vislets to only show those
that can handle the expected data format.
• The topic subscription mechanism of RabbitMQ
is used for subscribing. The mechanism uses rout-
ing keys to match publishers and subscribers. The
subscription expression defined in eStoRED is
used as the RabbitMQ routing key, a sequence of
characters up to 255 bytes, defining dot-separated
words and allowing the wildcards characters *
(star) substituting for exactly one word and #
(hash) substituting for zero or more words. This
enables a powerful and flexible mechanism to
easily create subscription expressions spanning
a wide range of data sources. For example:
australia.2016.rainfall, australia.2016.*, #.rain-
fall are valid routing keys.
Data sources can also use this mechanism to sub-
scribe to each other via the messaging system, and
this way create data workflows. This is illustrated at
the bottom of Figure 1 where Data Source #3 is sub-
scribed to Data Source #2, and Data Source #4 is sub-
scribed to Data Source #3.
Once Data Elements have been defined, when-
ever a Story is loaded, the following steps happen,
as shown in Figure 1 : 1. eStoRED retrieves the
Story and the Data Elements it contains. 2. It con-
nects to the Vislet repository and retrieves the Vislets
defined in the Subscriptions of each Data Element.
3. The web application then generates a web page
where the Vislets are included. 4. On the web page,
a JavaScript client for RabbitMQ is executed directly
into the client’s web browser to subscribe to the ex-
pression. 5. When a Data source publishes a message,
if a Data Element is subscribed to it, the message bro-
ker passes it on, and the Vislet code is called to in-
3
https://www.amqp.org/
ENASE 2017 - 12th International Conference on Evaluation of Novel Approaches to Software Engineering
40
Data Source #2
MySQL
Database
REST API
Data Source #3 Data Source #4
Data Element #1
Data Element #2
Data Element #3
Data Source #1
Web Page
from eStoRED
...
eStoRED
Java Web Application
Story structure
Vislets
Vislet Vislet
Vislet
Vislet
Message Broker
RabbitMQ Server
Vislets repository
MyTardis
Vislets
Story
LEGEND:
Messages published/delivered (AMQP protocol)
Message-passing internal to the broker
Web request/response
Third-party entity belonging to the architecture
eStoRED Platform
Visualisers code snippets
eStoRED Story and Data Elements
Figure 1: eStoRED software architecture.
terpret the data contained in the message, and act on
it by displaying it or performing specific computation
on it.
4 DEMONSTRATOR AND
EVALUATION
We have created a factory demonstrator and con-
nected it to our framework. Figure 2 shows an
overview of our food-processing factory demonstra-
tor. The conveyor belt circle for pallets in the mid-
dle part and the bottling machinery in the lower left
of the picture are visible. One of our Raspberry Pi-
based controllers is shown in Figure 3. It features a
Raspberry Pi including network connectivity as well
as IO-boards to communicate with the sensor and ac-
tuator world.
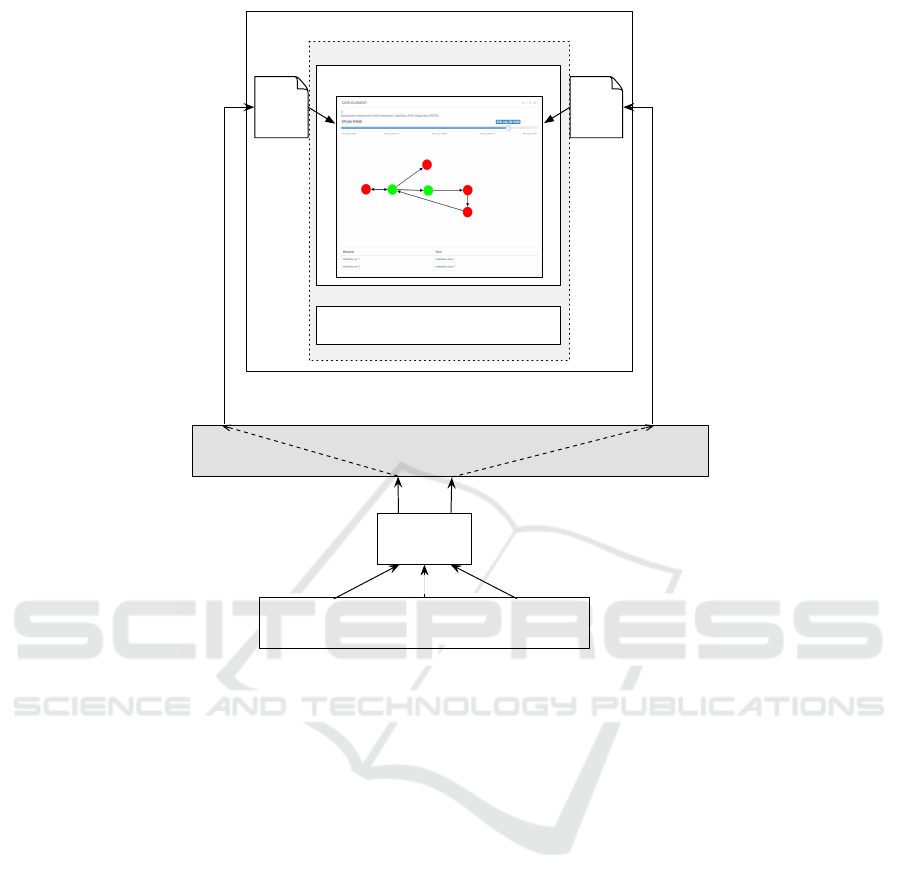
The Figure 4 shows how the eStoRED architecture
is used in the context of visualizing that demonstrator.
The topology of the food processing plant demonstra-
tor is formalized in BeSpaceD as part of the configu-
ration of the program monitoring the plant. It is con-
verted into the JSON format and sent to the message
An Architecture for Visualization of Industrial Automation Data
41
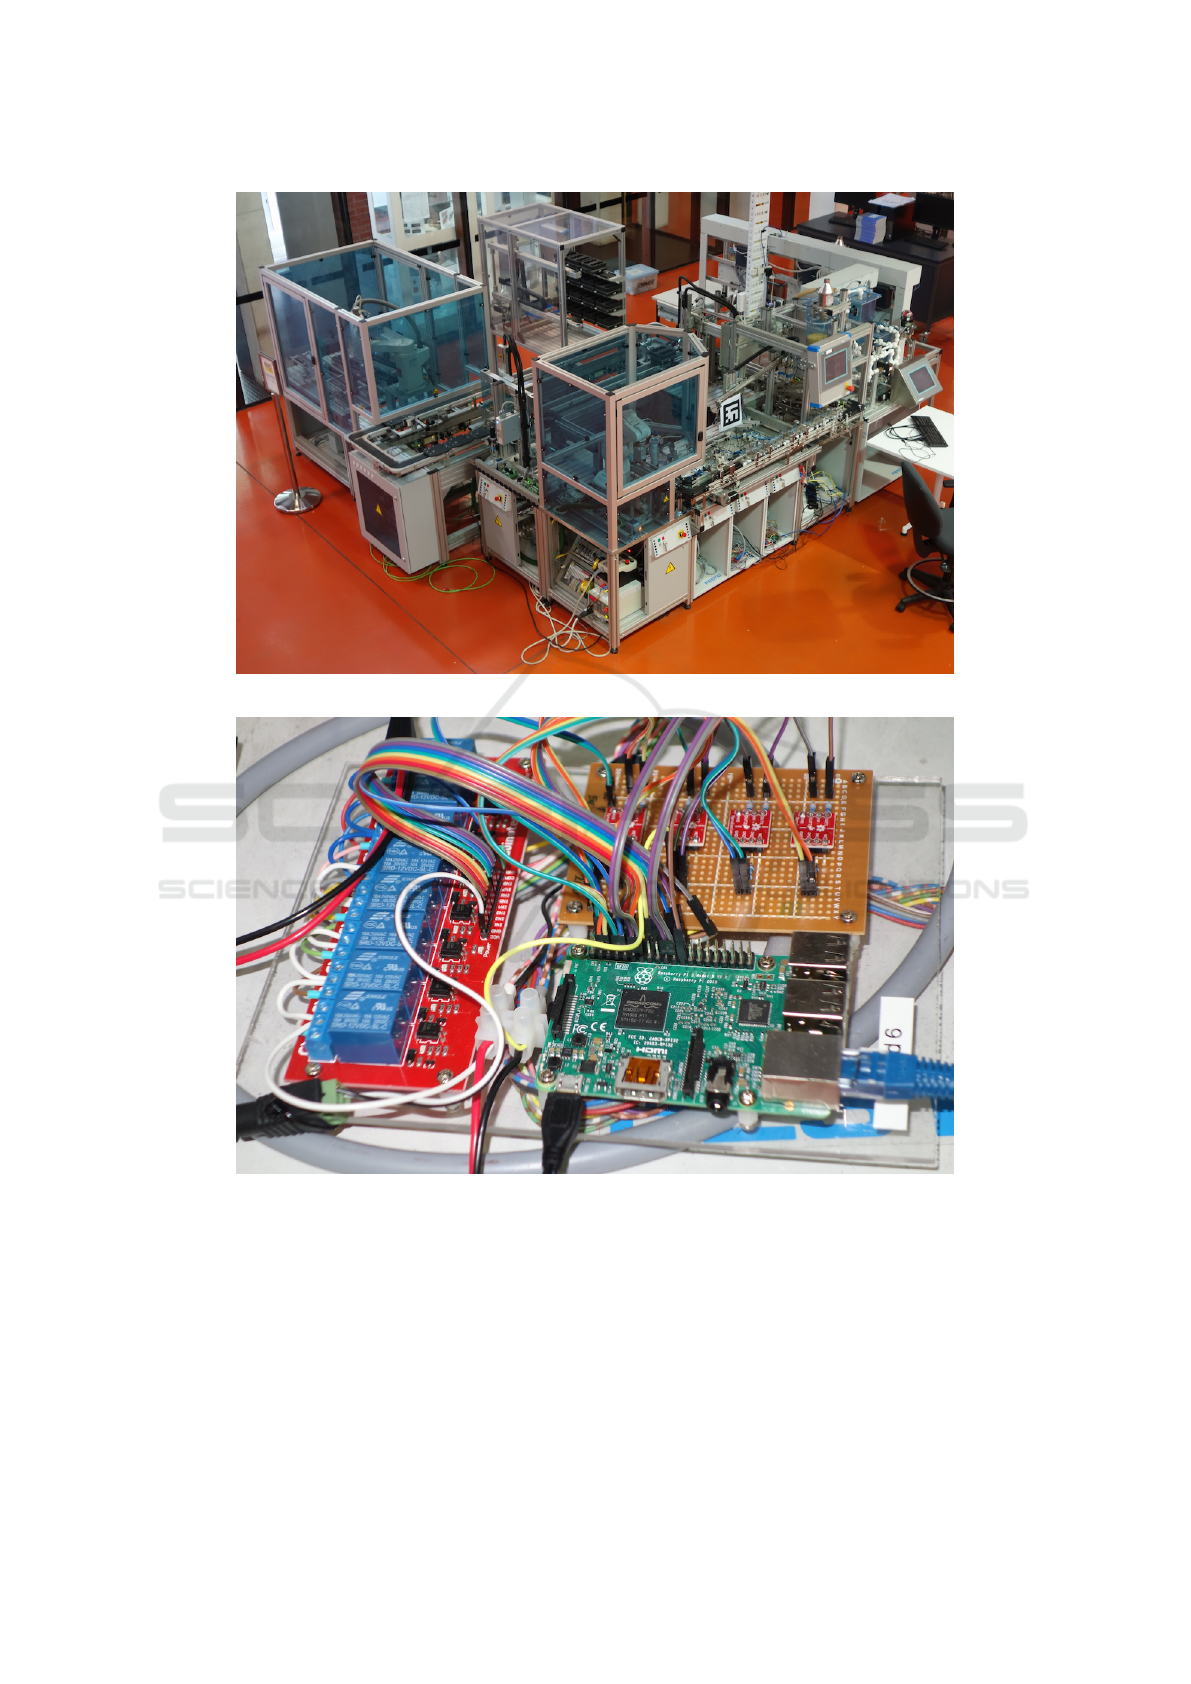
Figure 2: Food processing plant demonstrator.
Figure 3: Raspberry Pi-based controller.
broker at initialization. Whenever the sensors’ sta-
tuses change over time, the sensors send signals to
their respective Raspberry Pi-based controller. A pro-
gram to monitor this is deployed on the Raspberry Pi.
After converting these into the BeSpaceD language,
the corresponding events are sent to the message bro-
ker via a simple AMQP client.
At the other end, a Data Element is created in the
eStoRED platform, with two Subscriptions: one for
the topology, and one for the sensor events. The spe-
cific visualizers are retrieved and loaded into the web
browser. Being in the same data element, both visual-
izers are acting on the same graph visualization. The
topology visualizer draws the nodes and edges of the
graph representing the process, and the sensors visu-
alizer re-draws the status of the sensors by colouring
the nodes whenever they get updated.
Figure 5 shows an eStoRED Data Element which
ENASE 2017 - 12th International Conference on Evaluation of Novel Approaches to Software Engineering
42
BeSpaceD
eStoRED Platform
...
Topology
Visualiser
Sensors
Visualiser
Message Broker
RabbitMQ Server
Story
Food processing factory demonstrator
Sensors data
Data Element
Topology data
Sensors data
Figure 4: eStoRED in the factory data visualization context.
has received both topology data and sensor data. A
timeline control can be observed at the top of the Data
Element, which is updated when receiving new sen-
sor data. Since each sensor signal encompasses the
exact time when it happened, the visualizer enables
scrolling through signals received in the past, using
this timeline control. At the bottom of the Data El-
ement are displayed metadata that can optionally be
added to AMQP messages as key-value pairs. Here
it only shows metadata as an example, but this could
be important data such as the factory location or staff
responsible for it. To provide a look and feel, Figure 6
shows a larger graph visualized using eStoRED.
An excerpt of the semantic model represented as
a topology in the JSON format is shown below:
{"type":"BIGAND","terms":[ {
"type" : "EdgeAnnotated",
"source" : {"type":"Component",
"id":"Stack Ejector Retracted"},
"target" : {"type":"Component",
"id":"Stack Ejector Extended"},
"annotation" : "ProcessSequence"
} , {
"type" : "EdgeAnnotated",
"source" : {"type":"Component",
"id":"Stack Ejector Extended"},
"target" : {"type":"Component",
"id":"Stack Empty"},
"annotation" : "ProcessSequence"
} , ...
Two edges representing material flow are shown
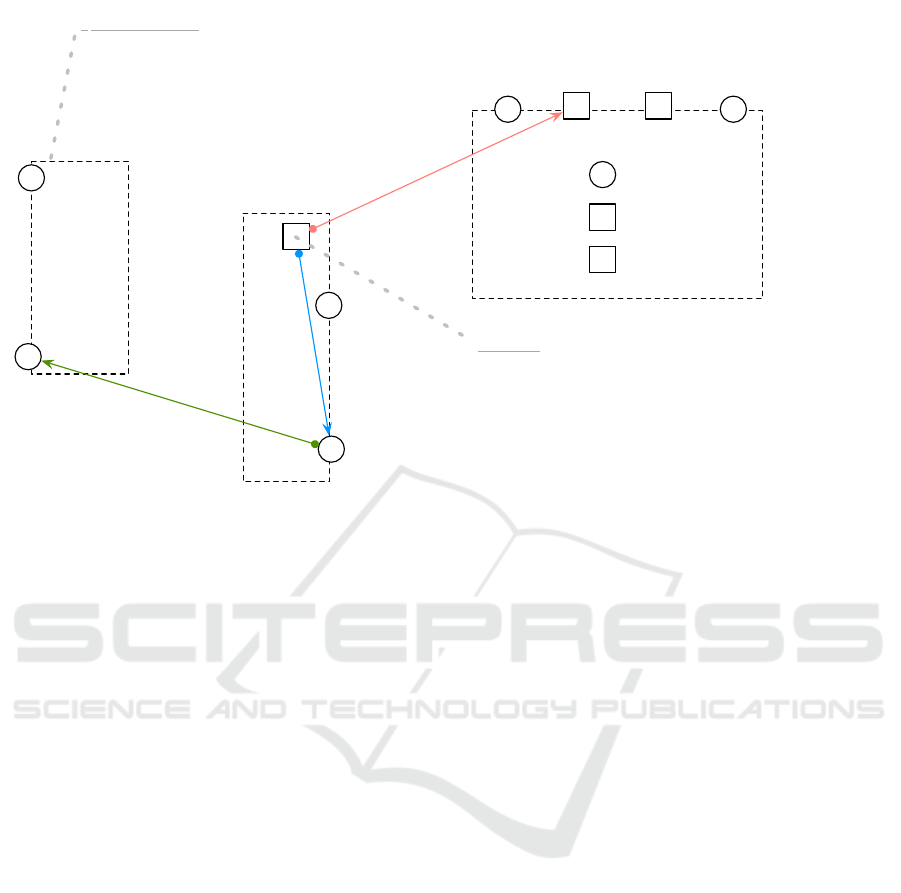
with their annotations. Another graphical depiction
of a factory element is shown in Figure 7. Only a lim-
ited number of edges are shown for readability pro-
poses The dashed lines represent parts of the factory
and these correspond to their relative spatial position
and size. Squares represent actuators and circles rep-
resent sensors.
Some meta data is shown that is used for config-
uration, debugging and automatic decision support.
Of note is the General Purpose Input Output (GPIO)
Pin number of the Raspberry Pi-based PLC that is
mapped to the actuator that controls and actuator: it
extends a stack ejector. The signal mapping defines
the binary voltage level (e.g. zero or 24 volts) that
the actuators or sensors accept or emit. This relates to
sensor states in our model (e.g. [de]activate actuator;
[un]obstructed light sensor). Spatial measurements
for a tube that holds bottling caps are shown to il-
An Architecture for Visualization of Industrial Automation Data
43
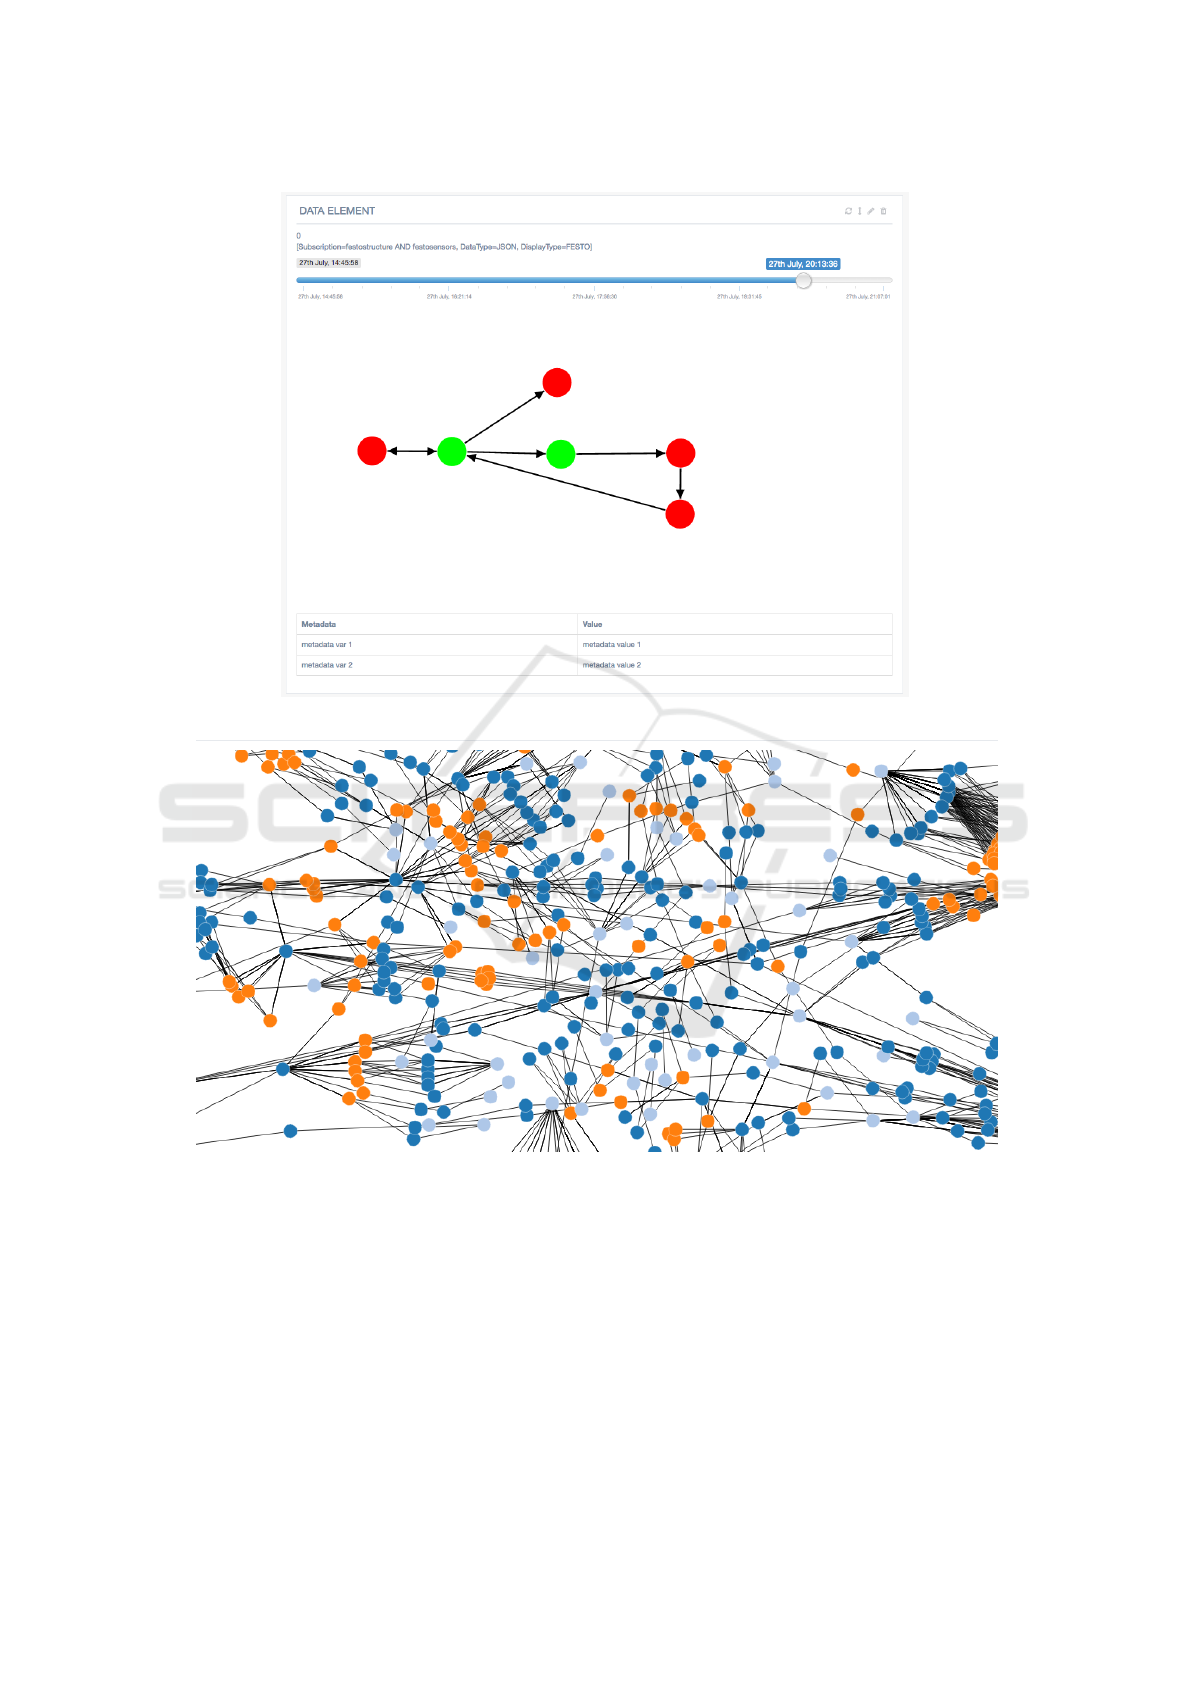
Figure 5: Example of an eStoRED data element including topology and sensor data.
Figure 6: Larger graph visualized with eStoRED.
lustrate the annotation of geometric information. The
symbols are reference points and intermediate values
used to formulate absolute measurements.
There are three different qualitative topological
aspects that can be distinguished in our factory model.
One edge from each aspect is added to the diagram to
illustrate them.
• Material Flow Topology (green)
In the example, this edge is asserting that the stack
empty sensor becomes obstructed exactly one sec-
ond before the stack ejector extended sensor be-
comes unobstructed. In other words, it takes one
second to eject the last cap from the stack.
• Interdependency aspects (blue)
This edge is asserting that the stack ejector ex-
tended sensor becomes unobstructed between 200
to 300 milliseconds after the stack ejector extend
actuator is inactivated (passive). In other words,
it takes 200–300 ms for the light sensor to indi-
cate retraction after the actuator starts retracting
ENASE 2017 - 12th International Conference on Evaluation of Novel Approaches to Software Engineering
44
Stack Ejector Retracted
Stack Ejector Extended
Stack Ejector
Tube
Stack Full
Stack Empty
Workpiece Gripped
Loader Picked Up Loader Dropped Off
Loader
Vacuum Grip
Eject Air Pulse
Stack Ejector Extend
Loader
Pick Up
Loader
Drop Off
-500..1000ms
Active
Passive
Passive
Unobstructed
200..300ms
Unobstructed
Obstructed
-1sec
Spatial META DATA
x = Station1EdgeLeft + 68
y = StackEjectorFront + 55
= Station1EdgeFront + 76 + 55
z = Base + 34
width = Diameter.Tube = 60
depth = Diameter.Tube = 60
height = Z.TubeTop - Z.TubeBottom
= Base + 230 - StackEjectorPlatform
= Base + 230 - Base + 34
= 264
META DATA
Category = Actuator
Type = Solenoid
GPIO = 4
SignalMapping = (High -> Active, Low -> Passive)
Figure 7: Partial model of a factory element.
the stack ejector.
• Safety aspects (red)
This edge is asserting a constraint that we want the
loader to move to the pick-up position from half a
second before to one and a half seconds after the
stack ejector starts extending in order to avoid a
collision.
5 CONCLUSION
This paper described our cloud-based data collec-
tion and visualization framework for industrial au-
tomation. We presented the incorporation of spatio-
temporal models into the framework and discussed
some detailed examples. In addition, we introduced
a demonstrator and a visualization application. The
cloud-based software framework and the example fac-
tory are integrated and serve as a demonstrator plat-
form for our lab. The presented work facilitates
monitoring, operation and maintenance of production
plants. In particular remote plants such as mining
sites in the Australian outback are a targeted appli-
cation area. Future work will connect additional ser-
vices to the AMQP server in order to establish a com-
mon interchange platform for factory data.
REFERENCES
P. Balbiani, J.-F. Condotta, and L. F. del Cerro. A new
tractable subclass of the rectangle algebra. In Proceed-
ings of the 16th International Joint Conference on Ar-
tifical Intelligence - Volume 1, pages 442447, 1999.
B. Bennett, A. G. Cohn, F. Wolter, M. Zakharyaschev.
Multi-Dimensional Modal Logic as a Framework
for Spatio-Temporal Reasoning. Applied Intelligence,
Volume 17, Issue 3, Kluwer Academic Publishers,
November 2002.
J. O. Blech, L. Fernando, K. Foster, Abhilash G and
Sudarsan Sd. Spatio-temporal Reasoning and Deci-
sion Support for Smart Energy Systems. Emerging
Technologies and Factory Automation (ETFA), IEEE,
2016.
J. O. Blech, I. Peake, H. Schmidt, M. Kande, A. Rahman,
S. Ramaswamy, Sudarsan SD, V. Narayanan. Efficient
Incident Handling in Indus- trial Automation through
Collaborative Engineering. Emerging Technologies
and Factory Automation (ETFA), IEEE, 2015.
J. O. Blech, H. Schmidt. BeSpaceD: Towards a Tool Frame-
work and Methodology for the Specification and Ver-
ification of Spatial Behavior of Distributed Software
Component Systems, http://arxiv.org/abs/1404.3537.
arXiv.org, 2014.
L. Caires and L. Cardelli.A Spatial Logic for Concurrency
(Part I). Information and Computation, Vol 186/2
November 2003.
L. Caires and L. Cardelli. A Spatial Logic for Concurrency
(Part II). Theoretical Computer Science, 322(3) pp.
517-565, September 2004.
DS DELMIA V6R2013x – Fact Sheet: 3DEXPERIENCES
An Architecture for Visualization of Industrial Automation Data
45

of Global Production Systems for all stakeholders in
the extended supply chain. Dassault Syst
`
emes 2013.
ENOVIA V6R2013x – Fact Sheet. Dassault Syst
`
emes 2013
S. Hordvik, K. Oseth, J. O. Blech, P. Herrmann. A Method-
ology for Model-based Development and Safety Anal-
ysis of Transport Systems.Evaluation of Novel Ap-
proaches to Software Engineering, 2016.
H. Kagermann, W. Wahlster, J. Helbig (eds.). Recommen-
dations for implementing the strategic initiative IN-
DUSTRIE 4.0 – Final report of the Industrie 4.0
Working Group. Acatech, 2013.
H. K. Lin and Jenny A. Harding. A manufacturing system
engineering ontology model on the semantic web for
inter-enterprise collaboration. Computers in Industry
58, no. 5 (2007): 428-437.
M. Loskyll, J. Schlick, S. Hodek, L. Ollinger, T. Gerber,
& B. Pirvu. Semantic service discovery and orches-
tration for manufacturing processes., 16th Confer-
ence on Emerging Technologies & Factory Automa-
tion (ETFA). IEEE, 2011.
S. Skiadopoulos and M. Koubarakis. On the consistency of
cardinal direction constraints. Artificial Intelligence,
163(1):91135, 2005.
N. Van de Weghe, B. Kuijpers, P. Bogaert, and P. De
Maeyer. A qualitative trajectory calculus and the com-
position of its relations. In Proceedings of the 1st
International Conference on GeoSpatial Semantics,
pages 6076. Springer, 2005.
M. Wenger, A. Zoitl, J. O. Blech, I. Peake. Remote Mon-
itoring Infrastructure for IEC 61499 Based Control
Software. 8th International Congress on Ultra Mod-
ern Telecommunications and Control Systems, IEEE,
2016.
ENASE 2017 - 12th International Conference on Evaluation of Novel Approaches to Software Engineering
46
