
Relationship between Personality Traits and Software Quality
Big Five Model vs. Object-oriented Software Metrics
Anderson S. Barroso
1,2
, Jamille S. Madureira da Silva
2,3
, Thiago D. S. Souza
1,2
,
Bryanne S. de A. Cezario
2
, Michel S. Soares
2
and Rogerio P. C. do Nascimento
2
1
Computing Department, Tiradentes University, Aracaju, Brazil
2
Computing Department, Federal University of Sergipe, São Cristóvão, Brazil
3
Computing Department, Federal Institute of Sergipe, Aracaju, Brazil
Keywords:
Personality, Object-oriented Software Metrics, Software Development, Big Five, Software Quality.
Abstract:
The activity of analyzing personality of software developers has been a topic discussed by many researchers
over the past few years. However, their relation to software metrics has hardly been mentioned in the literature.
This work aims to identify the influence of human personality on quality of software products. At first, a
psychological test was performed using the Big Five model for a set of developers working in industry and,
subsequently, object-oriented software metrics were applied to individual software developed by members of
the same group. As a result, it was evidenced, through statistical analysis, that the factors Consciousness,
Neuroticism and Openness to Experience have a significant relationship with the Cyclomatic Complexity
metric. In addition, factors Extroversion, Agreeableness and Neuroticism have significant relation with metric
Coupling between Objects. In another analysis, taking into account ideal average values for each software
metric, it was evidenced that Extroversion and Neuroticism factors have a significant relationship with metric
Depth of Inheritance Tree. Extroversion and neuroticism were the only factors that obtained a significant
relation with software metrics in the two proposed analyzes. Therefore, additional studies are needed to
determine any deeper connection between personality and software quality.
1 INTRODUCTION
Modern organizations are increasingly concentrating
their efforts on creativity and innovation as they strive
to remain competitive considering the pace of changes
in industry (Varona et al., 2012). Considering this
scenario, managing the software development process
has become a difficult and complex task, where ac-
tivities require diverse competencies from developers.
Creativity and short-term to meet goals need to be bal-
anced throughout process.
Qualification of software professionals is not
enough to guarantee that the project will be success-
ful to its end (Brooks Jr, 1995) (Varona et al., 2012).
This assertion comes from the fact that, every day, de-
velopers are under pressure to deliver faster results.
Thereby, external factors to their technical skills may
influence the quality of their work products.
Among several non-technical factors that may im-
pact daily work of a developer, the approach on hu-
man personality traits is the result of a historical con-
cern, given that relevant researches on the personal-
ity of software developers have been published since
the 1980’s (Bartol and Martin, 1982), (Varona et al.,
2012), (Salleh et al., 2012), (Kanij et al., 2015) (Gu-
lati et al., 2016). In most surveys, attempts are made
to identify the relationship between emotional, moti-
vational, and behavioral patterns and the software de-
velopment environment.
In this paper, we take into account two con-
cerns. First one considers software quality, because
the difficulties of developing, maintaining and de-
ploying software have been studied extensively over
the years. One of the main focus of studies is
software metrics for object-oriented (OO) program-
ming paradigm (Berry, 2004), (Boehm, 2006), (Wirth,
2008), (Kitchenham, 2010) and (Johari and Kaur,
2012). The second concern is with non-technical at-
tributes, more precisely the personality of the devel-
oper, since there are results that show the influence
of personality in activities of software development
(Varona et al., 2012), (Salleh et al., 2012), (Kanij
et al., 2015) and (Gulati et al., 2016).
Based on this contextualization, the objective of
Barroso, A., Silva, J., Souza, T., Cezario, B., Soares, M. and Nascimento, R.
Relationship between Personality Traits and Software Quality - Big Five Model vs. Object-oriented Software Metrics.
DOI: 10.5220/0006292800630074
In Proceedings of the 19th International Conference on Enterprise Information Systems (ICEIS 2017) - Volume 3, pages 63-74
ISBN: 978-989-758-249-3
Copyright © 2017 by SCITEPRESS – Science and Technology Publications, Lda. All rights reserved
63

this work is to perform an analysis in software repos-
itories that use an object-oriented programming lan-
guage, in the software industry, to describe evidence
of developers’ personality influences on their source
code quality. Software quality was measured by ap-
plying OO metrics to software developed in C# lan-
guage (Cod, 2016), and developer personality was an-
alyzed using the Big Five model (Kanij et al., 2015).
Results were analyzed to evidence the influence of de-
veloper personality on the software developed by each
developer.
2 RELATED WORKS
Several works have considered an association be-
tween the Big Five model and Software Engineering.
The Big Five model has gained prominence in
Software Engineering research and has been applied
at both individual and team levels (Gomez and Acuna,
2007). It has been common for researchers to use the
Big Five model to analyze cooperation between soft-
ware developers and to examine pair programming
(Chao and Atli, 2006)(Hannay et al., 2010)(Salleh
et al., 2011). These studies showed a contradiction
in the influence of personality in relation to perfor-
mance. While Salleh et al. (Salleh et al., 2011) claim
that certain personality traits, such as satisfaction, sig-
nificantly affect developer performance, Chao et al.
(Chao and Atli, 2006) and Hannay et al. (Hannay
et al., 2010) did not find any statistical correlation
showing evidence of this influence.
Gulati et al. (Gulati et al., 2016) performed a study
on the relationship between personality and perfor-
mance of software engineering students and found no
positive evidence.
To the best of our knowledge, no further stud-
ies were found in the literature that correlate the Big
Five model with the application of object-oriented
software metrics to measure the quality of software.
Only one work that deals with quality of software was
found, but the authors considered group evaluation
(Gomez and Acuna, 2007), not individual developers
as performed in this paper. The authors of this article
carried out a study involving software quality (Bar-
roso et al., 2016), but with the MBTI Model (Myers
et al., 1998).
Among the related works, we identified points of
intersection between our work and previous works, as
described in the following subsections.
2.1 Empirical Study of How
Personality, Team Processes and
Task Characteristics Relate to
Satisfaction and Software Quality
In 2007, Gomez and Acuña (Gomez and Acuna,
2007) analyzed the relationships between personality,
task characteristics, product quality and satisfaction in
software development teams. Within their study, they
collected data from a sample of 35 student teams (105
participants) from a Spanish university. These teams
used eXtreme Programming (XP) to develop the same
software product. They found that the most satis-
fied teams at work are precisely those whose members
scored higher for the affability and awareness factors
of the BigFive test.
Levels of satisfaction are higher when members
can decide how to develop and organize their work
and fall down when there are more conflicts between
team members. They also came to conclusion that ex-
troversion should be considered as a valid predictor of
software quality for software development in an ag-
ile methodology because the high interaction among
team members is essential for this method of devel-
opment. According to them, all participants could be
classified as project managers and they all were re-
sponsible for the success or failure of the product de-
veloped. In addition, they concluded that traits such
as sociability, loquacity, communicability, friendli-
ness and openness seem to be conducive to the de-
velopment of high quality software as well as to the
satisfaction of team members.
In their work (Gomez and Acuna, 2007), the au-
thors measured software quality through analysis of
source code and project documentation. The follow-
ing equation was used:
Grade = (((Modularization * 2 + Testability * 2 +
Functionality * 2 + Reusability * 2 + Style * 2) / 4) *
0.8) + ((Participation * 10 / 4) * 0.2))
For our work we take into account the statistical
analysis performed by the authors and involving the
factors of the Big Five model. In contrast we evalu-
ated quality of software in the context of information
systems developed by a single developer in an indus-
trial environment. We use object-oriented software
metrics to measure software quality.
2.2 Investigating the Effects of
Personality Traits on Pair
Programming
In 2012, Salleh et al. (Salleh et al., 2012) carried out
a set of three experiments to investigate the effect of
ICEIS 2017 - 19th International Conference on Enterprise Information Systems
64

the Big Five factors in the context of students from a
university in New Zealand, in order to investigate the
influence of these factors considering programming in
pairs.
The results showed that Conscientization and
Neuroticism did not present a statistically significant
effect on academic performance of the evaluated stu-
dents. However, Openness to Experience played a
significant role in the academic differentiation of stu-
dents in the field of pair programming.
The tool for performing the psychological test
used by the authors was also used in our study.
2.3 An Empirical Investigation of
Personality Traits of Software
Testers
In 2015, Kanij, Merkel and Grundy (Kanij et al.,
2015) researched whether the personality of a soft-
ware tester differs from personality of the other pro-
fessionals involved with the software development
process. They used the BigFive model and have con-
cluded, through statistical testing, that testers have
higher levels of Conscientiousness compared to other
developers. The authors themselves report that the
work has a strong threat to validity that is related
to comparison of Australian testers with testers from
other countries, since, in Australia, they used specific
test tools.
In order to mitigate this problem, our experiment
was performed in an industrial environment and used
object-oriented software metrics widely published in
the literature. These metrics measure software qual-
ity through mathematical calculations that are geo-
graphic independent.
Finally, this work has helped us to identify statisti-
cal relationships we could make between the Big Five
factors of developers and the quality of software pro-
duced by them.
3 METHODOLOGY
First we performed a review of the literature, with sys-
tematic approaches, with the purpose of identifying
the state of the art of research on the use of the Big
Five model to identify personality and its relationship
with developers in the industrial environment. Then, a
controlled experiment was conducted, which involved
the execution of a Big Five psychological test and the
extraction of OO metrics from software produced by
the participants.
According to Wohlin et al. (Wohlin et al., 2012),
an experimentation is not a simple task as it involves
preparing, conducting and analyzing experiments cor-
rectly. One of the main advantages of experimenta-
tion is the control of subjects, objects and instrumen-
tation, which makes it possible to draw more general
conclusions about the subject investigated. Other ad-
vantages include the ability to perform statistical an-
alyzes using hypothesis testing methods and opportu-
nities for replication.
Juristo et al. (Juristo and Moreno, 2013) also
claim that scientific research can not be based purely
on opinions or commercial interests. Scientific inves-
tigations are represented by studies based on observa-
tion and/or experimentation about real world and their
measurable behaviors. These aspects were observed
when preparing our experiment.
Summarizing, the experiment has 4 steps: (1) Ex-
ecution of personality test by the participants; (2) Ex-
traction of OO metrics from software produced by
participants; (3) Data collection and; (4) Analysis of
results.
4 THEORETICAL
FOUNDATIONS
Developers and project managers often devote them-
selves to the latest programming languages, frame-
works, modern processes or innovative tools, but in
all cases they are the people who design software.
Thus, the human aspects of engineering have as much
to do with the success of a project as the technical at-
tributes (Pressman and Maxim, 2014). When we talk
about human aspects in computing, we also talk about
human personality and its behavioral, emotional and
motivational characteristics.
Human personality encompasses psychological
characteristics about an individual that helps to de-
scribe differences between people, how they interact,
and adaptation to their social environment (McCrae
and John, 1998). Criteria by which people differ from
one another are called psychological traits. Traits are
representative factors for predicting one’s own pat-
terns of behavior, feeling, thinking, and related ac-
tivities (Hannay et al., 2010). From that point on, sur-
veys indicate that software developers, analysts, and
testers have different types of personalities and behav-
iors. Studies show that the skills required by a specific
developer may be related to personality style and in-
dividual behavior.
Several studies have been developed seeking to
identify personal characteristics that may influence
performance at work. These characteristics can be
Relationship between Personality Traits and Software Quality - Big Five Model vs. Object-oriented Software Metrics
65

identified through various personality tests. One of
the most used indicator is the Big Five test. The next
two subsections explains the Big Five model for trac-
ing personality of software developers and evaluating
software quality by means of object-oriented metrics.
4.1 Big Five Personality Model
The Big Five model was originally created in the
1970s by two independent research teams - Paul
Costa and Robert McCrae (at the National Institutes
of Health) and Warren Norman (at the University of
Michigan) / Lewis Goldberg (At the University of
Oregon) (Norman, 1967) - who have followed differ-
ent paths to achieve the same results. According to
the authors, most human personality traits can be re-
duced to five large dimensions regardless of language
or culture.
The identification of these five dimensions was
possible after the researchers conducted interviews
with hundreds of questions to thousands of people and
then analyzed data using as factorial analysis, which
is used to reduce a large amount of information to a
synthetic and relevant set (McCrae and John, 1998)
(Norman, 1967).
In scientific circles, the Big Five is one of the most
accepted and used models to trace contemporary psy-
chological personality. This model classifies human
personality into five factors:
• Extraversion: relates to the degree of sociability,
gregariousness, assertiveness, talkativeness, and
activeness (Driskell et al., 2006). A person is con-
sidered an extravert if he/she feels comfortable
in a social relationship, if he/she is friendly, as-
sertive, active, and outgoing;
• Agreeableness: refers to positive traits such as co-
operativeness, kindness, trust, and warmth. A per-
son who is low on Agreeableness tends to be skep-
tical, selfish, and hostile. A team that requires a
high level of collaboration or cooperation can ben-
efit from agreeable team members (Kanij et al.,
2015);
• Conscientiousness: concerned with one’s
achievement orientation. Those who have a
high score tend to be hardworking, organized,
able to complete tasks thoroughly and on time,
and reliable. On the other hand, low Conscien-
tiousness relates to negative traits such as being
irresponsible, impulsive, and disordered (Driskell
et al., 2006);
• Neuroticism: refers to the state of emotional sta-
bility. Someone low in Neuroticism tends to ap-
pear calm, confident, and secure, whereas a high
Neuroticism individual tends to be moody, anx-
ious, nervous and insecure (Driskell et al., 2006).
Neuroticism is also reported to be consistently re-
lated to self-efficacy (Schmitt, 2007);
• Openness to experience: describes intellectual,
cultural, or creative interest (Driskell et al., 2006).
Someone who is high in Openness tends to ap-
pear as imaginative, broad-minded, and curious,
whereas those at the opposite end of this spec-
trum usually show a lack of aesthetic sensibilities,
preference for routine, and favouring conservative
values (Schmitt, 2007).
According to Srivastava and Kumar (Srivastava
and Kumar, 2013), the five Big Five dimensions rep-
resent one’s personality at the broadest level of ab-
straction and each dimension sums up a large number
of distinct and specific personality traits. These traits
are understood as a complete description of personal-
ity, are stable over a period of ten years and may vary
between cultures (Kanij et al., 2015).
4.2 Object-oriented Software Metrics
Software Engineering proposes several types of met-
rics that have been applied for measuring both the
process and the software product. Among those who
evaluate the product, one can cite metrics for the re-
quirements model, for the source code and also for the
project model.
For this study, object-oriented metrics were se-
lected because they are often used by researchers
in Software Engineering (Radjenovi
´
c et al., 2013),
for example, to reduce failures (Fenton and Bieman,
2014), in features such as maintainability, testabil-
ity and comprehensibility (Olbrich et al., 2009), for
maintenance of object-oriented software (Johari and
Kaur, 2012), and for refactoring forecast (Al Dallal,
2012).
Another positive point is that, according to a sys-
tematic review (Radjenovi
´
c et al., 2013), the authors
identified that object-oriented metrics were used ap-
proximately twice as much (49%) as other metrics.
As the proposed experiment was executed in an
environment that uses Microsoft C# language, the
metrics used in this work are compatible with C#
projects. Several metrics can be calculated in a project
developed in C#, using the Visual Studio platform, but
according to Microsoft itself (Cod, 2016), the follow-
ing metrics are the most important: Depth of Inheri-
tance Tree (DIT), Coupling between Objects (CBO),
Cyclomatic Complexity (CC) and Maintenance Index
(MI).
Table 1 highlights the characteristics of the five
metrics chosen for this experiment.
ICEIS 2017 - 19th International Conference on Enterprise Information Systems
66
Table 1: Specific Characteristic of OO Software Metrics.
Metric Characteristics
DIT (Depth of In-
heritance Tree)
Represents the number of lev-
els that a class inherits from
another class. The greater the
depth, the more complex the
project is.
CBO (Coupling be-
tween Objects)
Represents the number of
classes called by another class.
The more coupling a class has,
the more difficult to understand
and maintain it is
CC (Cyclomatic
Complexity)
Represents the number of inde-
pendent paths from the source
code. The greater the complex-
ity, the more deviations in the
source code flow is found (Mc-
Cabe, 1976).
MI (Maintenance
Index)
Represents the degree of main-
tainability of software based on
status of the respective source
code. (McCabe, 1976)
5 DEFINITION AND PLANNING
OF THE EXPERIMENT
In this and the next two sections, our work is pre-
sented as an experimental process following Wohlin
et al. guidelines (Wohlin et al., 2012). The focus of
this section is to describe the goal setting and experi-
ment planning.
5.1 Definition
The main elements of the experiment are the vari-
ables, the objects, the participants, the experiment
context, the hypotheses and the experimental design
type. With these elements, the objective is to carry out
studies that may evidence the improvement of some
development process. This improvement is related
to the verification of theories formulated through hy-
pothesis of the experiment.
The objective of this work is to evaluate, through
a controlled experiment, the influence of human per-
sonality on the quality of software. The experiment
will target programmers working on a high education
institution, with at least 2 years of industry experience
and at least 1 year of programming experience using
the object-oriented paradigm.
The objective of the experiment is formalized us-
ing the GQM model originally proposed by Basili
(Basili and Weiss, 1984): Object of study: human
personality has influence on software development;
Purpose: to evaluate the Big Five model for person-
ality identification against the application of OO soft-
ware metrics; Focus: software quality produced in-
dividually; Perspective: developers and software de-
velopment managers; Context: industry developers
working in a High Education Institution.
5.2 Planning
5.2.1 Research Hypotheses
Based on the premise that no studies associating the
Big Five personality with OO software metrics have
been found, sharing the same concern of (Gomez and
Acuna, 2007), which identifies that there is a broad
field to be worked on in the relationship between per-
sonality and quality of developed software, the re-
search items that need to be evaluated are: 1) Dif-
ferences in personality traits do not affect quality of
software developed by professionals; 2) Differences
in personality traits do affect quality of software de-
veloped by professionals.
To evaluate these items, software engineering
metrics will be used. Chosen metrics are: Depth
of Inheritance Tree (DIT), Coupling between Objects
(CBO), Cyclomatic Complexity (CC) and Mainte-
nance Index (MI) (McCabe, 1976).
With the objectives and metrics defined, the fol-
lowing hypotheses are considered:
• Hypothese 1
– H0DIT: Personality traits affect software qual-
ity for DIT metric.
– H1DIT: Personality traits do not affect software
quality for DIT metric.
• Hypothese 2
– H0CBO: Personality traits affect software qual-
ity for CBO metric.
– H1CBO: Personality traits do not affect soft-
ware quality for CBO metric.
• Hypothese 3
– H0CC: Personality traits affect software quality
for CC metric.
– H1CC: Personality traits do not affect software
quality for CC metric.
• Hypothese 4
– H0MI: Personality traits affect software quality
for MI metric.
– H1MI: Personality traits do not affect software
quality for MI metric.
Relationship between Personality Traits and Software Quality - Big Five Model vs. Object-oriented Software Metrics
67

5.2.2 Independent Variables
Independent variables of the experiment are described
below.
• Big Five Personality Test
The goal was to conduct a psychological test with par-
ticipants (Big, 2016). The test was the same used in
the related work of Salleh et al. (Salleh et al., 2012).
Test popularly known as Big Five has 120 ques-
tions with affirmations about daily activities of peo-
ple. For each statement, the experimenter must an-
swer at least one of the levels “Very Inaccurate”,
“Moderately Inaccurate”, “Neither Accurate Nor In-
accurate”, “Moderately Accurate” and “Very Accu-
rate”.
Test result indicates a score between 1 and 7 for
each factor. Each factor has a mean population score
and those who are above this score have strong char-
acteristics of the factor evaluated (see Table 2).
For adopting ideal values for the five factors that
we use in the work, we follow the values that corre-
spond to the average of the population (Big, 2016).
Values are shown in Table 2.
Table 2: Big Five ideals values.
E A C N O
H ≥ 4.44 ≥ 5.23 ≥ 5.4 ≥ 4.8 ≥ 5.38
L <4.44 <5.23 <5.4 <4.8 <5.38
E=Extraversion; A=Agreeableness; C=Conscientiousness;
N= Neuroticism; O= Openness to Experience; H=High;
L=Low
To better understand, an individual has high char-
acteristics for extraversion when he has a score
greater than or equal to 4.44 for this factor.
• Object Oriented Software Metrics
Metrics were collected using CodeAnalysis (Cod,
2016), part of Microsoft’s Visual Studio 2010, which
is the object-oriented paradigm development environ-
ment used by the chosen institution. The stored code
was on the TFS server (Team Foundation Server),
which is a Microsoft application life cycle manage-
ment collaboration platform (TFS, 2016).
The chosen institution for experiment was iden-
tified as having all the prerequisites required to per-
form the tests: it had a well-defined development
framework, using Microsoft Visual Studio, it had soft-
ware developed by a single developer with controlled
changes. An important point is that the target institu-
tion does not use tools that generate automatic source
code, which could interfere in the results of the indi-
vidual quality of the developers (Gomez and Acuna,
2007).
For each software produced by the participants,
the OO software metrics disposed in Table 3 were ap-
plied.
For adopting ideal values for the five metrics to
be use at work, developers followed McCabe’s guide-
lines (McCabe, 1976) and Bhasin, Sharma and Popli
(Bhasin et al., 2014), which define a set of “good”,
“regular” and “critical” values for each metric evalu-
ated, as presented in Table 3.
Table 3: C# metrics ideal values.
DIT CBO CC MI
Good 1-2 0-9 1-10 20-100
Regular 3-4 10-30 11-20 10-19
Critical > 4 > 30 >20 < 9
5.2.3 Dependent Variables
Dependent addressed variables were: Average of
Maintainability Index (MI); Average of Cyclomatic
Complexity (CC); Average of Depth of Inheritance
(DI); Average of Coupling between Objects (CBO).
5.2.4 Intervener Variables
We can highlight two variables that can influence re-
sults of the experiment:
• Developers’ experience in the applied psycholog-
ical test, though all have confirmed that they had
never tested;
• Developers’ commitment to respond the test.
5.2.5 Participants Selection
Participants are the individuals selected to conduct the
experiment. They are responsible for informing pa-
rameters for the experiment, such as the value of vari-
ables.
For our experiment, we took into account software
implemented by a single developer, considering that
analysis “personality X software quality” should be
1x1.
In this context, the versioning repository of the in-
stitution, by means of TFS (TFS, 2016), is used to
verify which developers fit the pre-established condi-
tions. Twenty softwares were found that were devel-
oped by a single developer.
According to the software manager, we found out
that among the twenty developers, fifteen were still
working in the company. In order not to violate the
principle of randomness and to avoid interference in
the outcome of the experiment, all 15 participants per-
formed the psychological test at one time (Shull et al.,
2001).
ICEIS 2017 - 19th International Conference on Enterprise Information Systems
68

Chosen institution was interested in ascertaining
the influence of developers’ personality on quality of
software, cooperating with the researchers and au-
thors of this article, who are totally impartial, without
having any demand, interest or preference.
5.2.6 Experiment Project
Experiment was designed so that all participants per-
formed the psychological test Big Five (Big, 2016).
All 15 participants performed the experiment at one
time to mitigate exchange of experiences between
them.
Experimenters explained about psychological Big
Five test and told the participants that they could ask
for help for understanding the issues. Participants
were placed in a computer lab at the institution se-
lected. They did not talk to each other during the test
period.
After the test was executed, the experimenters in-
formed the participants that the Big Five test result
would be associated with quality of software they had
developed. Experimenters also reported that they had
already collected the values of the software metrics.
Participants were told that the results would be dis-
closed to the IT manager.
5.2.7 Instrumentation
Instrumentation process was initially performed with
configuration of environment for the experiment and
planning of data collection. This was performed in the
computer lab of the selected Institution. The test was
performed with people in their working environment,
setting up an experiment in vivo.
The tools used were: Code Analisys, part of Vi-
sual Studio 2010, version 10.0.40219.1, coupled to
the Microsoft .NET Framework, version 4.6.01055
(Cod, 2016); Team Foundation Server with last up-
date on 26/09/2016 (TFS, 2016); Online tool for run-
ning the Big Five test (Big, 2016).
6 EXPERIMENT OPERATION
In the following sections we will report on how the
experiment process occurred, highlighting data prepa-
ration, execution and validation.
6.1 Experiment Preparation
The following steps were considered: Characteri-
zation Form- participants answered questions about
formal training and work experience; Software
Metrics Collection- experimenters collected object-
oriented metrics from software developed by partic-
ipants; Allocation of developers to respond to Big
Five psychological test - the computers were already
previously connected with link to run the test. Partic-
ipants did not have to make any configuration; Feed-
back Form- Participants answered questions about
the experience with the experiment, whether liked the
test and whether think the test was effective in tracing
the personality.
6.2 Experiment Execution
After preparation of the experiment and initial in-
structions, participants had had five minutes to set-
tle in. Each participant had ten minutes to answer
the characterization form. At this point, there was no
doubt as to the interpretation of what was being asked.
All participants agreed that associating personal-
ity with software quality could be a positive point in
the individual assessment of the developer. However,
the participants were not informed about the exact hy-
potheses to be tested, avoiding the phenomenon De-
mand Characterization (Orne, 1962).
Data Collect
Experimenters collected metrics from software devel-
oped individually by each participant. The experi-
menter copied the screen with each participant’s Big
Five test result. Upon completion of the test, the de-
veloper called one of the experimenters to copy the
test response to a flash drive, identifying the file with
the participant’s name.
Results of the collected data are presented in the
Results Analysis Section.
6.3 Data Validation
As support for analysis, interpretation and validation,
two types of statistical tests were applied:
• Shapiro-Wilk test to verify the normality of the
samples, since it is an indicated test for sam-
ples smaller than 30 (Shapiro and Wilk, 1965)
(Boslaugh, 2012).
• Mann-Whitney (U Test) test to verify the level of
relationship between Big Five psychological fac-
tors and OO Software Metrics, since we are deal-
ing with two independent samples. This test is
commonly applied for the analysis of psycholog-
ical factors (Mann and Whitney, 1947)(MacFar-
land and Yates, 2016). Another justification is that
the related work of (Kanij et al., 2015) obtained
satisfactory results using this test.
Relationship between Personality Traits and Software Quality - Big Five Model vs. Object-oriented Software Metrics
69

The statistical tests were performed using the R
tool, created by the Foundation for Statistical
Computing, version 3.2.2.
7 ANALYSIS OF RESULTS
In this section we will continue with the Analysis and
Results Interpretation and with the Threats to the Va-
lidity of the Experiment.
7.1 Analysis and Results Interpretation
In this section we will discuss the results of the exper-
iment.
7.1.1 Participants Analysis
All participants had proven experience in software de-
velopment and were appropriately tailored to the C#
development model used by the institution.
Although the level of experience and the number
of software maintained were different among partic-
ipants, no specific training was required for develop-
ment, since the metrics were taken from software that
they had already developed and were already in use
by the users of the institution.
7.1.2 Results of Big Five Test
Figure 1 depicts the distribution of factors by each de-
veloper who performed the test. To better explain the
distribution, note that the participant P1 scored 4 for
the Extraversion factor, 5.5 for Agreeableness, 5.5 for
Consciousness, 6 for Neuroticism, and 5 for Open-
ness to Experience.
Comparing the participants, we can point out that
participants P8, P10 and P15 are the least extroverted
and participants P2, P7 and P13 are the most extro-
verted. Participants P2 and P9 obtained the lowest
scores for the Neuroticism factor.
Factor Openness to Experience was the one that
obtained less variation between the scores obtained
by participants.
7.1.3 Software Metrics Values
Figures 2, 3, 4 and 5 represent the distribution of OO
software metrics for softwares developed individually
by each participant.
Taking into account Table 3, which describes the
quality levels acceptable in the literature for each met-
ric, we can point out that all 15 participants main-
tained levels considered “good” for the Maintenance
Index (Fig. 2), Cyclomatic complexity (Fig. 4) and
Coupling between objects (Fig. 5).
Participants P3, P9, and P15 developed software
with a level considered “good” for metric Depth of
Inheritance Tree (Fig. 3). In contrast, participants P4,
P5, P7 and P8 are rated at a “critical” level consider-
ing the same metric.
7.1.4 Relationship between Big Five and OO
Metrics
For analysis of results, we used conclusive statistical
evidence. First, a significance level of 0.05 was set
for the whole experiment, as well as the Shapiro-Wilk
test (Boslaugh, 2012) was applied to verify if the sam-
ples have a normal distribution. Data are presented in
Table 4.
Table 4: Shapiro-Wilk normality test.
W p-value
Extroversion 0.9522 0.561
Agreeableness 0.9362 0.3379
Conscientiousness 0.8989 0.0916
Neuroticism 0.9516 0.5506
Openness to Exp. 0.9006 0.0973
Maintainability Index 0.9713 0.8772
Cyclomatic Complexity 0.9860 0.9951
Depth of Inheritance Tree 0.8940 0.0773
Coupling Between Objects 0.9719 0.8863
By respecting the level of significance of 0.05
adopted, we can observe that all samples have normal
distribution, that is, they have p-values higher than
0.05. Results of normality test indicate that our sam-
ple is normally distributed for each of the Big Five
factors and for each of the OO software metrics ana-
lyzed.
From this point, we will analyze two different sce-
narios. In the first one, we will make the general rela-
tion of psychological factors with OO software met-
rics. In the second, we will make the relation tak-
ing into account the ideal values found in Tables 2
and 3. For both scenarios, we will adopt a signifi-
cance level of 0.05 and apply the Mann-Whitney test
(U Test) to provide evidence of relationship between
variables. In the first scenario, we provide relation
of each factor individually with all collected software
metrics, each value of Table 5 represents the level of
significance (p-value) of the relationship between the
psychological factor and the analyzed OO software
metrics. These two scenarios will help comparing the
results of our research with the results of related work.
In order to find evidence of the relation, p-value
must be greater than the significance level 0.05. By
observing Table 5, one can observe that the level of
significance is reached in the following relationships:
ICEIS 2017 - 19th International Conference on Enterprise Information Systems
70
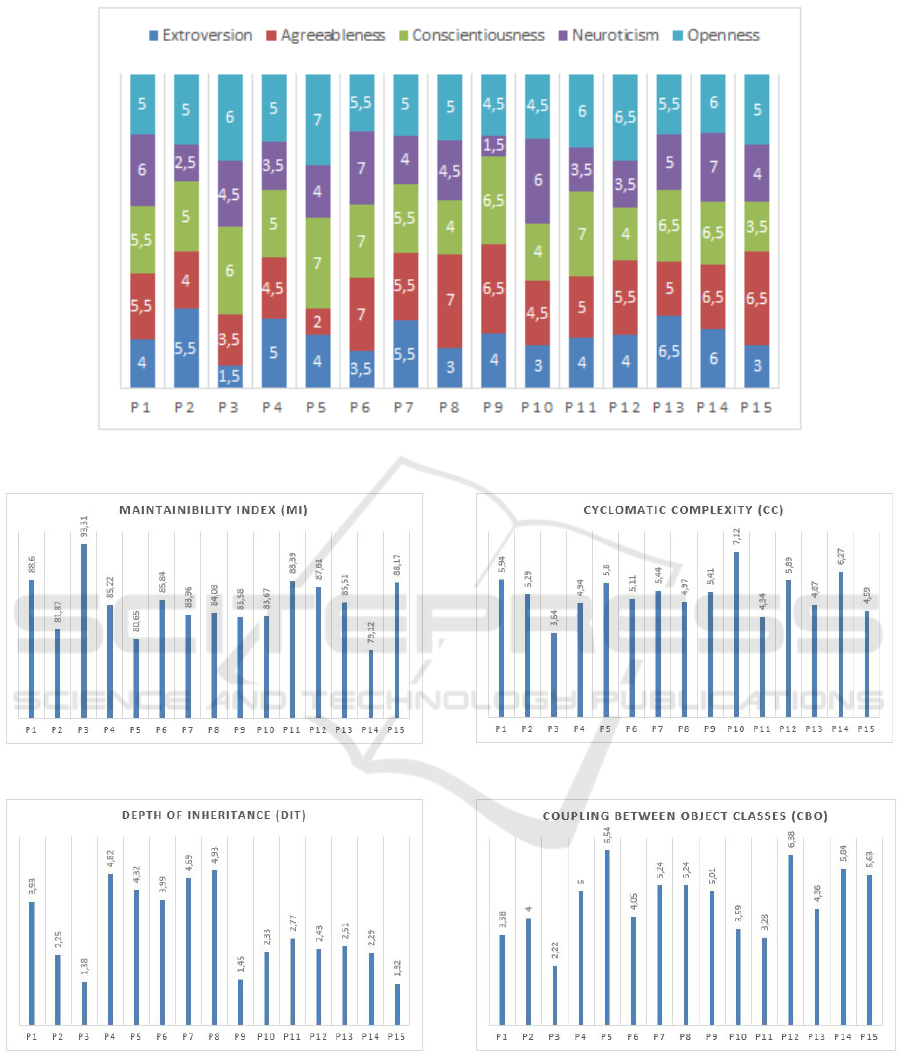
Figure 1: Participants X Factors Big Five.
Figure 2: Participants X MI Metric.
Figure 3: Participants X DIT Metric.
E x CBO; A x CBO, C x CC, C x CBO, N x CC, N x
CBO and O x CC.
In this first scenario, by adopting a general con-
text, we can show that only the CC and CBO met-
rics are influenced by some Big Five psychological
factors. Therefore, we can refute the null hypotheses
Figure 4: Participants X CC Metric
Figure 5: Participants X CBO Metric.
H0MI and H0DIT and accept the alternative hypothe-
ses H1CBO and H1CC.
In the second scenario, we take into account the
level of scores of the psychological factors (Table 2)
and the ideal levels of OO metrics. We perform an
analysis in Figs. 2, 3, 4 and 5, and observe that met-
Relationship between Personality Traits and Software Quality - Big Five Model vs. Object-oriented Software Metrics
71
Table 5: Scenario 1: Relation Big Five factors X Metrics
OO.
MI CC DIT CBO
E 0,0000610 0,0114 0,0215 0,2454
A 0,000724 1 0,00262 0,0596
C 0,000061 0,550 0,00132 0,1026
N 0,0000610 0,0648 0,02155 0,6701
O 0,00072 0,599 0,000061 0,0445
E=Extraversion; A=Agreeableness; C=Conscientiousness;
N= Neuroticism; O= Openness to Experience
rics MI, CC and CBO had values considered homo-
geneous and classified as “good” according to Table
3. Only the DIT metric has heterogeneous values for
the acceptable levels. Based on this analysis, we used
only the DIT metric in the assessment of scenario 2.
Once again we adopted a significance level of 0.05
and the Mann-Whitney test (U Test).
Only the Extraversion and Neuroticism factors
obtained levels of significance higher than 0.05 (p-
value), compared to the DIT software metric.
Thus, after analyzing scenario 2 separately, there
is evidence that respecting the ideal values for psy-
chological factors and OO metrics, we can refute the
H0DIT hypothesis and accept the alternative hypoth-
esis H1DIT.
In summary, the analysis of results of the pro-
posed experiment, in a first scenario, without taking
into account the ideal levels of psychological factors
and OO metrics, evidenced the influence of some Big
Five factors over the metrics Cyclomatic Complexity
(CC) and Coupling between Objects (CBO).
In a second scenario, by considering ideal levels
as presented in Tables 3 and 2, the analysis evidenced
influence of the factors Extraversion and Neuroticism
on the metric Depth of Inheritance Tree (DIT). A
comparison between the two scenarios is depicted in
Table 6.
Table 6: Comparison between the two scenarios analysed.
Scenario 1 Scenario 2
MI CC DIT CBO DIT
E X X
A X
C X X
N X X X
O X
E=Extraversion; A=Agreeableness; C=Conscientiousness;
N= Neuroticism; O= Openness to Experience
Extroversion and neuroticism were the only fac-
tors that obtained a significant relation with software
metrics in the two analyzes proposed.
7.1.5 Comparison with Related Work
In order to create a comparison with related works,
we will analyze Table 7.
Table 7: Comparison between related works and the two
scenarios.
Factor
Our work
T1 T2 T3
Scenario 1 Scenario 2
E X X
A X X
C X X
N X X
O X X X
E=Extraversion; A=Agreeableness; C=Conscientiousness;
N= Neuroticism; O= Openness to Experience
As discussed in Section on related works, authors
Gomez and Acunã (Gomez and Acuna, 2007), in
work T1, found that the factors Agreeableness and
Openness to Experience may be conducive to the de-
velopment of software with high quality, remember-
ing that they analyzed the project and not each metric
individually. In our study, these two factors also had
significant values. Agreeableness obtained significant
relation in scenario 2 and Openness to Experience in
scenario 1.
Authors of work presented in (Salleh et al., 2012)
(work T2), indicated that the Openness to Experience
factor can play a significant role in the academic dif-
ferentiation of students in the field of pair program-
ming. In our work, we also found a significant rela-
tionship for Opening the Experience in scenario 1.
Finally, authors of work T3 (Kanij et al., 2015)
have reached the conclusion that software testers have
higher levels of Conscientiousness compared to other
development professionals. In our work, Conscien-
tiousness also obtained a level of significance relevant
to scenario 1 of the experiment.
After this analysis, we can observe that our find-
ings are consistent with those found in the literature,
and that there is evidence of the influence of person-
alities in the quality of software in the experimented
environment.
7.2 Threats to Validity
Even though we have achieved satisfactory results in
the experiment, we can not disregard the following
threats to validity.
• Internal validity: Since the applied Big Five test
had 120 questions, it is possible that the devel-
oper lost concentration at some point of the test.
This was mitigated with clarification from experi-
menters as to the importance of focusing on each
issue.
ICEIS 2017 - 19th International Conference on Enterprise Information Systems
72

• External validity: Since in the experiment envi-
ronment there were only 15 developers who sat-
isfied the main prerequisite of the experiment (to
have developed software or part of it alone, with-
out any other developer having helped or par-
ticipated in the project), the results could have
changed if the number of participants was greater.
The difference in complexity between the soft-
wares was mitigated by the use of the values mean
of metrics. According to work (Kanij et al., 2015)
the BigFive factor characteristics are understood
as a complete description of personality and are
stable over a period of ten years. With this there
was the concern in choosing software under 10
years.
• Construct validity: The website (Big, 2016) that
had the Big Five test applied may not have been
intuitive enough. This was mitigated with a thor-
ough explanation on the site and the test ques-
tions.
8 CONCLUSION AND FUTURE
WORKS
The objective of experiment presented in this paper
was to verify if there is a relation between the psy-
chological factors of a developer and the quality of the
software they produce. The experimenters conducted
a controlled experiment with 15 software developers
working in an educational institution. This institution
had all the necessary prerequisites for the experiment,
considering that the company owns software, or parts
of it, developed by a single developer.
In the experiment, the experimenters collected
data from Big Five psychological test of the 15 devel-
opers and collected the software metrics developed by
the same 15 developers.
Through an analysis of results for collected sam-
ples, we found evidence that when we relate the Big
Five factors to the software metrics, without concern
for the ideal levels adopted in the literature, (see Ta-
bles 2 and 3), one can suggest that CC metric was
influenced by the factors Consciousness, Neuroticism
and Openness to Experience, and the CBO metric was
influenced by the Extraversion, Agreeableness and
Neuroticism factors. On the other hand, if there is
concern about the ideal levels adopted in the litera-
ture, it is possible to suggest that the DIT metric was
influenced by the Extraversion and Neuroticism fac-
tors.
One important finding is that Neuroticism factor
was the only one to generate positive evidence in
the two evaluated scenarios. That is, the higher the
Neuroticism score, the greater the chances the devel-
oper will control Anxiety, self-awareness and anger.
He/she will hardly have sign of depression and will be
less vulnerable to sudden mood swings. These quali-
ties can help the developer to improve quality of their
software, at least with respect to the Cyclomatic Com-
plexity (CC), Coupling Between Object (CBO) and
Depth of Inheritance Tree(DIT) metrics.
Further studies are needed to determine any
deeper connection between personality and software
quality. As for future work, we suggest that the same
experiment can be performed with a larger number of
participants and in a different development environ-
ment, since the experiment was executed in a single
geographical location.
ACKNOWLEDGEMENTS
The authors would like to thank the Brazilian re-
search agency CNPq (grant 445500/2014-0) for finan-
cial support.
REFERENCES
(2016). Analyzing Application Quality by Using Code
Analysis Tools. https://msdn.microsoft.com/en-us/
library/dd264897.aspx.
(2016). International Personality Item Pool Representa-
tion of the NEO PI-R. http://www.personal.psu.edu/
j5j/IPIP/ipipneo120.htm.
(2016). Team Foundation Server. https://msdn.
microsoft.com/pt-br/vstudio/ff637362.aspx. Ac-
cessed:05/09/2016.
Al Dallal, J. (2012). Constructing Models for Predict-
ing Extract Subclass Refactoring Opportunities using
Object-Oriented Quality Metrics. Information and
Software Technology, 54(10):1125–1141.
Barroso, A. S., Madureira, J. S., Melo, F. S., Souza, T. D. S.,
Soares, M. S., and do Nascimento, R. P. C. (2016). An
evaluation of influence of human personality in soft-
ware development: An experience report. In 8th Euro
American Conference on Telematics and Information
Systems (EATIS), pages 1–6.
Bartol, K. M. and Martin, D. C. (1982). Managing Informa-
tion Systems Personnel: A Review of the Literature
and Managerial Implications. MIS Quarterly, pages
49–70.
Basili, V. R. and Weiss, D. M. (1984). A Methodology for
Collecting Valid Software Engineering Data. IEEE
Transactions of Software Engineering, 10(6):728–
738.
Berry, D. M., K. E. (2004). Ambiguity in Requirements
Specification. International Series in Engineering and
Computer Science, 753(1):7–44.
Relationship between Personality Traits and Software Quality - Big Five Model vs. Object-oriented Software Metrics
73

Bhasin, H., Sharma, D., and Popli, R. (2014). On the Re-
liance of COM Metrics for a C# Project. International
Journal of Computer Science and Information Tech-
nologies, 5(3):4288–4291.
Boehm, B. (2006). A View of 20th and 21st Century Soft-
ware Engineering. In Proceedings of the 28th Inter-
national Conference on Software Engineering, pages
12–29.
Boslaugh, S. (2012). Statistics in a nutshell. " O’Reilly
Media, Inc.".
Brooks Jr, F. P. (1995). The mythical man-month (anniver-
sary ed.).
Chao, J. and Atli, G. (2006). Critical Personality Traits in
Successful Pair Programming. In Agile Conference,
pages 88–93.
Driskell, J. E., Goodwin, G. F., Salas, E., and O’Shea, P. G.
(2006). What Makes a Good Team Player? Personal-
ity and Team Effectiveness. Group Dynamics: Theory,
Research, and Practice, 10(4):249.
Fenton, N. and Bieman, J. (2014). Software Metrics: A
Rigorous and Practical Approach. CRC Press.
Gomez, M. and Acuna, S. T. (2007). Study of the Rela-
tionships Between Personality, Satisfaction and Prod-
uct Quality in Software Development Teams. In Proc.
of the 19th Int. Conf. on Software Engineering and
Knowledge Engineering(SEKE), pages 292–296.
Gulati, J., Bhardwaj, P., Suri, B., and Lather, A. S. (2016).
A Study of Relationship Between Performance, Tem-
perament and Personality of a Software Programmer.
In ACM SIGSOFT Software Engineering Notes, pages
1–5.
Hannay, J. E., Arisholm, E., Engvik, H., and Sjøberg,
D. I. (2010). Effects of Personality on Pair Program-
ming. IEEE Transactions on Software Engineering,
36(1):61–80.
Johari, K. and Kaur, A. (2012). Validation of Object Ori-
ented Metrics using Open Source Software System:
An Empirical Study. ACM SIGSOFT Software Engi-
neering Notes, 37(1):1–4.
Juristo, N. and Moreno, A. M. (2013). Basics of Software
Engineering Experimentation. Springer Science &
Business Media.
Kanij, T., Merkel, R., and Grundy, J. (2015). An Empirical
Investigation of Personality Traits of Software Testers.
In 8th International Workshop on Cooperative and
Human Aspects of Software Engineering (CHASE),
pages 1–7.
Kitchenham, B. (2010). What’s up with Software Metrics?–
A Preliminary Mapping Study. Journal of systems and
software, 83(1):37–51.
MacFarland, T. W. and Yates, J. M. (2016). Mann–Whitney
U Test. In Introduction to Nonparametric Statistics
for the Biological Sciences Using R, pages 103–132.
Mann, H. B. and Whitney, D. R. (1947). On a Test of
Whether One of Two Random Variables is Stochas-
tically Larger than the Other. The Annals of Mathe-
matical Statistics, pages 50–60.
McCabe, T. J. (1976). A Complexity Measure. IEEE Trans-
actions on Software Engineering, (4):308–320.
McCrae, R. R. and John, O. P. (1998). An Introduction to
The Five-Factor Model and Its Applications. Person-
ality: Critical Concepts in Psychology, 60:295.
Myers, I. B., McCaulley, M. H., Quenk, N. L., and Hammer,
A. L. (1998). MBTI Manual: A Guide to the Devel-
opment and Use of the Myers-Briggs Type Indicator,
volume 3. Consulting Psychologists Press Palo Alto,
CA.
Norman, W. T. (1967). 2800 Personality Trait Descriptors–
Normative Operating Characteristics for a University
Population.
Olbrich, S., Cruzes, D. S., Basili, V., and Zazworka, N.
(2009). The Evolution and Impact of Code Smells:
A Case Study of Two Open Source Systems. In Proc.
of the 2009 3rd Int. Symposium on Empirical Software
Engineering and Measurement, pages 390–400. IEEE
Computer Society.
Orne, M. T. (1962). On the Social Psychology of the Psy-
chological Experiment: With Particular Reference to
Demand Characteristics and their Implications. Amer-
ican psychologist, 17(11):776.
Pressman, R. S. and Maxim, B. (2014). Software engineer-
ing: a practitioner’s approach. McGraw-Hill Sci-
ence/Engineering/Math.
Radjenovi
´
c, D., Heri
ˇ
cko, M., Torkar, R., and Živkovi
ˇ
c, A.
(2013). Software Fault Prediction Metrics: A Sys-
tematic Literature Review. Information and Software
Technology, 55(8):1397–1418.
Salleh, N., Mendes, E., and Gru, J. (2011). The Effects
of Openness to Experience on Pair Programming in a
Higher Education Context. In 24th IEEE-CS Confer-
ence on Software Engineering Education and Training
(CSEE&T), pages 149–158.
Salleh, N., Mendes, E., and Gru, J. (2012). Investigating the
effects of personality traits on pair programming in a
higher education setting through a family of experi-
ments. Empirical Software Engineering, 12(4):714–
752.
Schmitt, N. (2007). The Interaction of Neuroticism and
Gender and its Impact on Self-Efficacy and Perfor-
mance. Human Performance, 21(1):49–61.
Shapiro, S. S. and Wilk, M. B. (1965). An Analysis
of Variance Test for Normality (Complete Samples).
Biometrika, 52:591–611.
Shull, F., Carver, J., and Travassos, G. H. (2001). An
Empirical Methodology for Introducing Software Pro-
cesses. ACM SIGSOFT Software Engineering Notes,
26(5):288–296.
Srivastava, S. and Kumar, R. (2013). Indirect Method to
Measure Software Quality using CK-OO Suite. In
Int. Conf. on Intelligent Systems and Signal Process-
ing (ISSP), pages 47–51.
Varona, D., Capretz, L. F., Piñero, Y., and Raza, A. (2012).
Evolution of Software Engineers’ Personality Profile.
ACM SIGSOFT Software Engineering Notes, 37(1):1–
5.
Wirth, N. (2008). A Brief History of Software Engineering.
IEEE Annals of the History of Computing, 1(3):32–39.
Wohlin, C., Runeson, P., Höst, M., Ohlsson, M. C., Reg-
nell, B., and Wesslén, A. (2012). Experimentation in
Software Engineering. Springer Science & Business
Media.
ICEIS 2017 - 19th International Conference on Enterprise Information Systems
74
