
An Experiment to Assess an Acquisition Platform and Biomedical
Signal Conditioning
Diego Assis Siqueira Gois, João Paulo Andrade Lima,
Marco Túlio Chella and Methanias Colaço Rodrigues Júnior
Computer Department, Sergipe Federal University,
Av. Marechal Rondon, S/n - Jardim Rosa Elze, São Cristóvão - SE, Brazil
Keywords: Acquisition, Conditioning, ECG, EMG, EOG, Usability.
Abstract: As physical computing has grown and the concept of “Do it Yourself” (DIY) increased, various open-source
electronics platforms emerged, such as Arduino and Raspberry pi. Still, these platforms aren't suited for
acquisition and conditioning of biomedical signals. Inspired by the DIY concept, this paper presents a
framework for acquisition and conditioning of biomedical signals composed of various interconnected,
interchangeable, inter-configurable and reconfigurable boards, called YouMake. Moreover, they are low cost
and have good documentation, making it easy for prototyping. The experimental evaluation of the platform
was performed in a group of people who used it to show the level of usability and the time spent. The results
showed that there are no statistical differences between the groups “with experience” and “without
experience”, and even more, that it can reliably be used for a low cost alternative for acquisition and
conditioning of biomedical signals.
1 INTRODUCTION
The Luigi Galvani (1737-1798), Alessandro Volta
(1755-1832), George Ohm (1787-1854) and Michael
Faraday (1791-1867) researches provided the basis
for the understanding of electrical potential and
electric current, which helped studies of the electrical
properties of cells and tissues, also known as
electrophysiology. They have also shown that living
tissues have electrical properties (Collura, 1993).
Collura (1993) also claims that the first scientists
to focus their work on the electrical phenomena were
Carlo Matteucci (1811-1868) and Emil du Bois-
Reymond (1818-1896). The first studied the muscle
properties of frogs and was the first to observe the
potential action that precedes the contraction and the
extent reduction of muscle during this contraction.
Meanwhile, Du Bois-Reymond built a galvanometer
of more than 4000 turns of wire in its coil, increasing
its sensitivity. Moreover, Du Bois-Reymond
developed non-polarizable electrodes made of clay
and understood the importance of their use.
This study and the use of physiological signals
increased in the engineering community. Thus, new
application fields were born in addition to the more
traditional areas of medicine. Such applications range
from monitoring of human activity, human-machine
interactions in games, and even biometrics, through
new systems based on electrocardiography
(Guerreiro, 2013).
As the high cost of professional equipment
prevents the use of such equipment for engineering
students in the field of physiological signals,
alternatives to acquisition and conditioning of these
signals are necessary.
In practice, it is often necessary to make
measurements of different electrical human signals
through simple devices. Although there are many bio-
amplifiers with excellent precision and multi-
channel, these are very expensive for general purpose
(Babusiak and Borik, 2013).
Physical computing has grown as a field in its own
right field (O'Sullivan and Igoe, 2004) and with the
increasing concept of “Do it Yourself” (DIY) various
open-source electronics platform emerged, such as
Arduino and Raspberry pi.
However, until now, physical computing has been
mainly used with equipment designed to meet
requirements which are not compatible with the
acquisition of physiological signals, such as relatively
high noise tolerance and low sampling rate (Silva et
Gois, D., Lima, J., Chella, M. and Júnior, M.
An Experiment to Assess an Acquisition Platform and Biomedical Signal Conditioning.
DOI: 10.5220/0006293100750086
In Proceedings of the 19th International Conference on Enterprise Information Systems (ICEIS 2017) - Volume 3, pages 75-86
ISBN: 978-989-758-249-3
Copyright © 2017 by SCITEPRESS – Science and Technology Publications, Lda. All rights reserved
75

al., 2014). In addition these requirements,
physiological computing requires a circuit for
acquisition of biomedical signal, which is not suitible
through equipment designed for physical computing.
Thus, equipment commonly used in physical
computing such as Arduino or Raspberry Pi are not
viable in physiological computing, because they
interact with simple actuators and sensors, not having
channels for acquisition of biomedical signals and
besides having few signals requirements.
Since then, many researchers turned to the study
of physiological signals, improving the acquisition
and conditioning of signals obtained and making it
possible to find high-precision apparatus for use in
modern medicine. However, such devices are
expensive as they are meant for professional use in
hospitals and clinics.
Thus, continuing the "DIY (Do-It-Yourself)"
idea, this work presents a platform for acquisition and
conditioning of physiological signals with low cost,
versatile, generic and easy prototyping. This platform
has the characteristics the fact of being composed of
interlocking, interchangeable, inter-configurable and
reconfigurable boards. It also has a strong
documentation, enabling easy prototyping and
manipulation.
The evaluation of this tool was made by the SUS
scale developed by Brooke (1996) in what concerns
the usability of the system. For comparison, it was
used the usability of “experienced people” with “less
experienced people” in the studied area, and a
comparison was made with another work which used
the same scale in its context.
The development of a tool such as presented here
may be of interest to the Hardware laboratory in the
computer department of the Sergipe Federal
University (UFS) and other engineering such as
electronics or electric, as well as people who work
with biomedical engineering. The technology domain
enables its flexibility and adaptation in several
different surveys, enabling the possibility of
integrating hardware with various laboratory
equipment, allowing undergraduate and postgraduate
students work in biomedical engineering.
The results of this experiment showed that there is
no statistical difference between the prototyping time
obtained for the "experienced people" and
"inexperienced people" groups, also showing the
platform usability note with a value A+ (on a scale
going from F to a A+). It was also shown that the
average usability of the "experienced" group is not
different from the average usability of the "no
experience" group, thus showing that a person with
no experience in the field makes the prototyping with
the same ease of a person with experience due to the
platform's usability.
The work is divided into eight sections, the first
introduction, and the second related work. The third
section presents the methodology of the work
focusing on describing how the board is designed and
assembled. The fourth section contains the
experiment planning and the fifth section details the
operation of the same. The sixth section presents the
results and discussion of the experiment. The seventh
section highlights the threats to the validity of the
experimental study and eighth section presents the
conclusion and future work.
2 RELATED WORKS
Due to mismatch between the relevance and
timeliness of biomedical engineering and the
structure of electrical engineering courses in Brazil
(Andrighetto et al., 2008), a postgraduate team of
biomedical engineering institute of UFSC has
developed a platform called SPSB-MD (Biomedical
Signal Processing System - Teaching Modules) for
acquisition and digitalization of electrocardiogram,
electromyogram, electrooculogram and
electroencephalogram signals, in order to fill the gap
in biomedical engineering disciplines in
undergraduate and postgraduate in UFSC. Despite the
platform developed by Andrighetto et al. (2008)
allow user access to analog components, it has
distinct modules for acquisition and conditioning of
each type of physiological signal. Unlike YouMake
that has a module of acquisition and signal
conditioning that can be modified by the user through
prototyping to the specifications of the signal of
interest.
The BITalino, developed by Silva et al. (2014)
consists of a hardware card type framework for
acquiring physiological signals focused in all in one,
low cost. This cost is €149 in a configuration "Board
Kit", €159 in the configuration "Freestyle Kit" and
169 euros in the configuration "Plugged Kit"
(Bitalino, 2016). This platform is for general purpose
and able to acquire electromyography signals,
electrocardiography, electrodermal activities and
accelerometry by fitting sensors blocks in the control
block. While BITalino does not allow the change and
adjustment of frequency bands and gains in filters and
amplifiers, YouMake allows the user to modify these
values freely, adapting the platform to the signal of
interest. Furthermore, in BITalino it is not possible to
connect a sensor block in another sensor block, in
order to integrate the filter and improve them. In
ICEIS 2017 - 19th International Conference on Enterprise Information Systems
76
YouMake it is possible to connect the boards to
integrate filters and gains of the amplifiers. There is
still a difference in cost, since the BITalino has
estimated cost of between €149 and €169 and
YouMake can be mounted with only €3,06.
Babusiak and Borik (2013) developed a four-
channel amplifier for measuring the
neurophysiological signals of humans, able to acquire
the electrocardiogram, electroencephalograms and
electrooculogram signals. This amplifier features
variable gain and programmable through digital
potentiometers, and allows you to change the lead in
the measurement, considering the type and
characteristics of the signal to be measured. However,
in this device it is not possible to learn through
prototyping and even interconnection between filters,
which can be found in YouMake.
Meanwhile, Zanetti (2013), decided to develop a
platform focused in the acquisition of
electroencephalogram called RITMUS, having high
performance, but because of its robustness, the price
is high, around $495.36. Besides the high price, it is
not as versatile and general as YouMake.
Finally, much of the work related to the
acquisition of biological signals uses it for an
application, such works develop a platform specific
to acquire the desired signal, this is the case of Silva
et al (2008), which develops a platform to acquire the
signals of heart rate, respiration, and galvanic skin
response in order to detect anxiety levels. Thus,
Vijayprasath, Sukanesh and Rajan (2012) also
focused on creating a platform for a specific
application. This platform performs the acquisition
and amplification of electrooculogram signals in
order to use such signals in mouse cursor control
through the eyes.
3 METHODOLOGY
As this work is to develop a low-cost platform for
acquisition and conditioning of biomedical signals,
specifically ECG, EOG and EMG, the first step was
to design the acquisition and conditioning circuits,
paying attention to the use of cheap and commercial
components the manufacture of the boards.
With the boards ready and the components
purchased, a guide and video was made for the user,
in which show how to mount the platform and use it.
For evaluation of the work, usability study for the
platform was performed, checking the easiness of and
the average time spent by users to mount. This
usability study was done experimentally and with
humans, for this reason, the study was submitted to
the ethics committee and approved under the number
CAAE: 58536416.6.0000.5546.
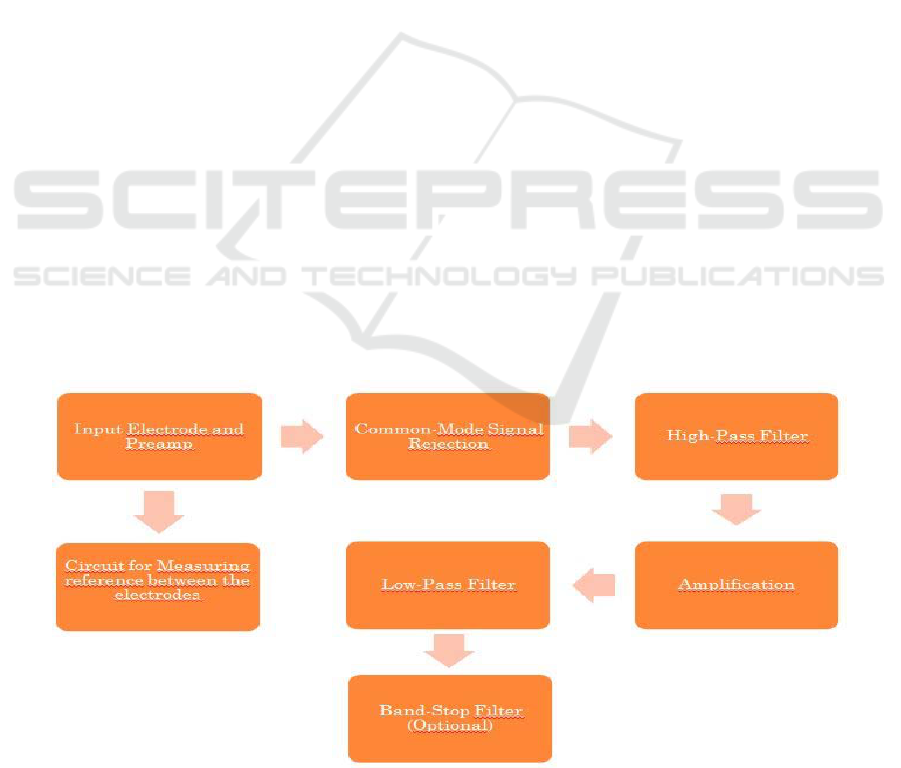
The block diagram in Figure 1 illustrates the
YouMake’s modules.
The following sections describe how it was
designed and assembled the proposed platform.
3.1 Materials
The necessary low cost materials for the assembly of
the platform are:
• Set of printed circuit boards with the project that
will be shown in the following sections: each plate
cost $1.4 and it took only two plates in this work;
Figure 1: Platform block diagram.
An Experiment to Assess an Acquisition Platform and Biomedical Signal Conditioning
77

• Integrated circuit LM324: only one was used and
cost $0,32;
• Integrated circuit AD620: It was not used in the
experiments, but could be used as an option for
LM324 in the platform. The average cost is $11,94;
• Integrated circuit LM741: two were used in this
work. About $0,32 each;
• Electronic Components: Resistors and
capacitors costing a few cents each.
Thus, the estimated cost for the assembly of the
platform in this paper was about $3,23 using LM324,
3.2 Supply
The supply of the whole circuit was made with two
9V batteries connected in series forming a
symmetrical source of + 9V and -9V. However, it can
be powered by any source of symmetrical voltage 5V
to 15V. Special care should be taken, since the
maximum voltage of the supply is the maximum
value that the signal output voltage can reach, due to
saturation of the operational amplifiers.
3.3 Biomedical Signals Acquisition
Circuit
Figure 2 shows the schematic of the data acquisition
board divided into blocks for better viewing. In
addition to the blocks, the terminals were named
curtly and standardized so that would fit on the board.
The following shows the nomenclature of each
terminal:
• IN1.AD: electrode input 1 to the circuit using the
AD620 and must be connected to an electrode;
• IN2.AD: electrode input 2 to the circuit using the
AD620 and must be connected to an electrode;
• TO.AUX.AD: AD620’s circuit output that must
be connected to the reference circuit (IN.AUX
terminal).
• SAIDA.AD: output of the acquisition circuit
formed by AD620 and must be connected at the input
of the conditioning plate;
• IN1.LM: electrode input 1 to the circuit using the
LM324 and must be connected to an electrode;
• IN2.LM: electrode input 2 to the circuit using the
LM324 and must be connected to an electrode;
• TO.AUX.LM: instrumentation amplifier output
formed by the LM324 and must be connected to the
reference circuit (terminal IN.AUX);
• SAIDA.LM: output of the acquisition circuit
formed by the LM324 and must be connected at the
input of the conditioning board;
• IN.AUX: reference circuit input and must be
connected to TO.AUX.LM terminal if the user is
using the acquisition circuit formed by LM324, or
TO.AUX.AD terminal if the user is using the
acquisition circuit formed by AD620;
• SAIDA.AUX: the reference circuit output and to
be connected to an electrode;
• V+: supply positive voltage;
• V-: supply negative voltage;
• TERRA: supply reference (ground).
Block 1 of Figure 2 shows AD620 integrated
circuit, a circuit suitable for acquisition of biomedical
signals. It has three resistors, where R13 and R14 are
set to 22K forming a voltage divider in TO.AUX.AD
terminal and a resistor R12 which is the resistor which
can be varied to obtain different gain values. The
terminal TO.AUX.AD must be connected to IN.AUX
in block 4 to use the reference circuit with AD620.
The circuit’s gain is given by formula 1. Such gain
should not be too high, otherwise a significantly
increase in gain at this stage may adversely affect the
signal with noise. The maximum gain achieved,
without much noise, was 100, being advisable a gain
smaller than 10 at the early stage. This paper uses a
gain of 6.26.
R
G
= (49.4K)/(G—1) (1)
The block 2 of Figure 2 shows the instrumentation
amplifier mounted with LM324, where the values of
the resistors R2 and R3 were selected to be 47K (these
values enable a wide range of gain variation
according to the value of R1). The value of the gain
of this amplifier is given by (2), such gain is varied in
accordance with the resistor R1 (also called gain
resistor) as it can be seen in Figure 2. This gain must
not be too high, since a high gain at this stage may
harm the signal with noise. The maximum gain
achieved, without much noise, was 8, being advisable
not to exceed this value. This paper uses a gain of
7.26.
G = 1 + ((R3 x R2)/(R1)) (2)
Block 3 of Figure 2 is rejection circuit for
common mode signal, where all resistors have the
same value, 10K (R4 = R5 = R6 = R7 = 10K). These
values mean that there is no gain in this block.
For acquisition of biomedical signal a reference is
required to measure between IN1 and IN2. This
reference is provided by the circuit in block 4, as
shown in Figure 2.
Resistor values in the block 4 were chosen
according to the datasheet of AD620: R10 = 10K and
R11 = 1M. The capacitor C1 has its value set at
100nF. The input circuit (IN.AUX) must be
connected to the terminal TO.AUX.LM, which is
located at the voltage divider formed by R8 and R9
ICEIS 2017 - 19th International Conference on Enterprise Information Systems
78
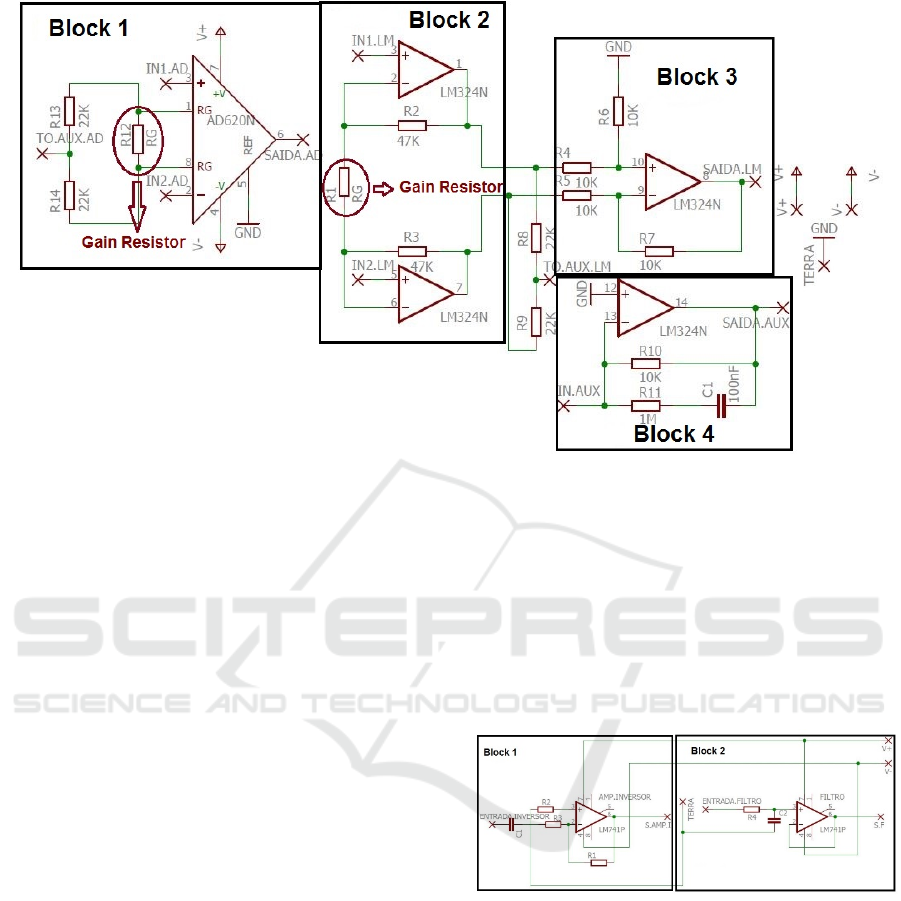
Figure 2: Acquisition board of biomedical signals.
(both resistors have the 22K value) if the user decides
to use the LM324 circuit. If you want to use the
AD620 circuit, the input of the reference circuit
(IN.AUX) must be connected to the terminal
TO.AUX.AD, which is located at the voltage divider
consisting of R13 and R14 (both with 22K values).
Observing Figure 2, note that there are two
separate and distinct acquisition circuits, one formed
by AD620 and another by LM324, and blocks 2 and
3 are connected, because together they form the
acquisition circuit through LM324. Thus, when one
of the two is chosen to be used, you only need to
solder the components referred on the chosen circuit,
including the electrodes. Also, the block 4 is shared,
so if you are using the acquisition circuit formed by
AD620, it is necessary that the input of the reference
circuit formed by block 4 is connected with block 1.
However, if you are using an acquisition circuit
formed by LM324, it must connect the block 4 input
to terminal TO.AUX.LM between the blocks 2 and 3.
3.4 Biomedical Signals Conditioning
Circuit
Figure 3 shows the schematic of the conditioning
board. It is divided into blocks for better viewing. In
addition to the blocks, the terminals were named
curtly and standardized so that they fit on the board.
The following shows the nomenclature of each
terminal:
• ENTRADA.INVERSOR: inverting amplifier
input. Must be connected to the output of the
acquisition board;
• S.AMP.I: inverting amplifier output;
• ENTRADA.FILTRO: filter input;
• S.F: filter output;
• V+: supply positive voltage;
• V-: supply negative voltage;
• TERRA: supply reference.
Figure 3: Conditioning circuit schematic.
Figure 3 shows the schematic of the conditioning
board. Block 1 consists of an inverting amplifier
formed by a LM741, where the gain can be seen in
(3), for being an amplifier in the inverting
configuration, it inverts the input signal. In this block
there is a coupling capacitor C1, since it is positioned
at the signal input, it also functions as a high-pass
filter with a cutoff frequency defined by (4).
G = -R1/R3 (3)
F
c
= 1/(C1 x R3)
(4)
An Experiment to Assess an Acquisition Platform and Biomedical Signal Conditioning
79

It is in block 1 of Figure 3 that is applied the
largest gain in the signal, in the order of tens or
hundreds. Thus, R1 and R3 values are not fixed, and
the values depend on the signal gain. The resistor R2
is used to minimize the effect of operational amplifier
input bias current, so the resistors R2 and R1 must be
equal.
Block 2 of Figure 3 shows the Butterworth type
active low-pass filter and following the Sallen & Key
setting that is applied to the signal, this is a first order
filter and can be easily changed to a high-pass filter
only inverting the position the capacitor with the
resistor. R4 and C2 values were not fixed, as these
depend on the value of the cutoff frequency of the
filter (5).
F
c
= 1/(2 x π x R4 x C2) (5)
4 EXPERIMENT PLANNING
4.1 Objective Definition
The purpose of this experiment is to evaluate, through
a controlled experiment, the acquisition platform of
biomedical signals using the Brooke systems (1996)
usability scale as a measuring tool. This experiment
will target two groups of participants, a group with
experience and one without experience in electronics.
The goal was formalized using the GQM model
proposed by Basili (1984): analyze the biomedical
signals platform in order to evaluate with respect to
the usability and time prototyping in the point of
view of students and former students of
undergraduate and postgraduate with and without
experience in the study area, in the context of people
interested in the study area.
4.2 Hypothesis Formulation
In this experiment, we want to answer the research
questions QP1, QP2 and PQ3:
QP1: The group with the most knowledge and
experience in the area has an average value of
usability higher than the group with less experience
and knowledge?
QP2: The platform can be used as a low cost
alternative for the acquisition and conditioning of
biomedical signals?
QP3: The group with the most knowledge and
experience in the area has the lowest average value of
prototyping time than the group with less experience
and knowledge?
To assess these questions, three metrics will be
used:
Average usability of each group
(SUS_Valor);
Overall average value of the usability of the
experiment;
Average time prototyping of each group.
With the research questions and metrics defined,
the following hypotheses were defined:
a. Hypothesis 1
H
0SUS
: The average usability value of the
"experienced" group is equal to the average usability
value of the "no experience" group.
H
aSUS
: The average usability value of the "with
experience" group is higher than the average usability
value of the "no experience." group.
b. Hypothesis 2
H
0tempo
: The average prototyping time of the
"experienced" group is equal to the average
prototyping time of the "no experience." group.
H
atempo
: The average prototyping time of the
"experienced" group is higher than the average
prototyping time of the "no experience" group.
4.3 SUS Usability Scale
Usability is a quality suitability of any device, for a
particular purpose, and their ability to be used in a
given context. For being a subjective and complex
evaluation, Brooke (1996) developed the Systems
Usability Scale (SUS), which is a scale of ten simple,
fast and reliable items that provides an overview of
subjective usability reviews and is used as a tool to
measure the usability of a wide variety of products
and systems.
Composed of 10 questions that evaluate the
effectiveness, efficiency and satisfaction of the user
in relation to a particular product or service, the SUS
scale has three characteristics that make it quite
attractive in usability measurement. First is a scale
with few questions, which makes it quick and easy for
both respondents and the research administrator to
calculate the values. Secondly, it is a free scale, which
can be used without the need for any payment. Third,
the SUS is an agnostic of technology, and can be used
by a large group of professionals in the evaluation of
almost any type of interface or product. Finally, the
result is a single score, ranging from 0 to 100, which
is relatively easy to understand by people from
different study areas (Bangor, Kortum and Miller,
2009).
SUS works as follows: the user reads a statement
about the system he wants to evaluate and then
immediately must choose from a five-point scale
ICEIS 2017 - 19th International Conference on Enterprise Information Systems
80

ranging from strongly disagree to strongly agree of
the statement.
With the questionnaire completed, the user’s
opinion is converted into a score that represents the
system usability for that individual.
4.4 Variables
We describe in this section the independent,
intervening and dependents variables of the
experiment in this paper.
For independent variables, there are the tool used
in case the biomedical signals acquisition and
conditioning platform YouMake and its electronic
components.
For dependent variables, there are two metrics:
the average prototyping time, which was obtained by
means of a chronometer and the average usability of
SUS scale (Brooke, 1996).
As intervening variable, there is the emotional
state of the participants, as they might be nervous
during of the experiment.
4.5 Participants
Tullis and Stetson (2004) claims the use of SUS scale
permit to obtain a system usability mean with a small
sample number (8-12). Besides that, the authors assert
this sample number has a confidence enough of a
good evaluation of how people see your system or
product. Thus, it was chosen twenty four participants
for the study.
The question P1 was asked at twenty-four
participants, mixed among students and former
students of undergraduate and postgraduate in UFS,
with the sole purpose to classify the participants into
more experienced or less experienced in the study
area.
• P1: Have you ever studied electronics?
Thus, the participants were divided into two
groups, the group G1, with experience, represented
by the people who answered yes and the second group
G2 that have only basic knowledge of circuits,
represented by those who answered no.
4.6 Pilot Study
Before the experiment, a pilot study was conducted
with student with a master in electrical engineering
and a degree in electrical engineering. This student
has experience in electronic circuits and is currently a
Professor of in the Electrical Engineering Department
of the Federal University of Sergipe - Campus São
Cristóvão (Sergipe, Brazil). This study was
conducted in a laboratory at the Federal Institute of
Sergipe - Campus Itabaiana (Sergipe, Brazil). It was
given to the participant a user guide and a video
showing how to prototype ECG, EMG and EOG.
Soon after, the participant performed the
experimental work described in the following
sections.
The participant got a 12 minute prototyping time
and 95 points in SUS usability scale. The pilot study
was used to better understand the study procedures. It
also helped to assess the usability obtained by a
person with considerable experience, and the time
required to perform the task.
Thus, the pilot study was useful to show that it
was possible to prototype the experiment in a timely
manner. It also showed that people with enough
experience possibly will feel easily in prototyping.
4.7 Experiment Design
4.7.1 ECG Acquisition and Conditioning
For acquisition and conditioning of the ECG, which
is the potential heart rate, it is needed to position the
surface electrodes that will acquire the signal of the
first derivation of the ECG in the chest, just below the
shoulder and the reference in the right arm, as shown
in Figure 4. This figure also shows the acquisition
circuit using the AD620. Since, with the LM324 it is
similar.
In this paper, the ECG is detected through surface
electrodes, which requires a passing frequency range
between 0,67-40Hz (Prutchi and Norris, 2005). Also,
one needs a high gain, since the ECG signal
amplitude is around 1 mV (Babusiak and Borik,
2013).
As has already been performed several tests in this
work, commercial values of components that enable
the display the ECG with a good degree of acceptance
were found. They are:
• Gain of 6.26 in the acquisition board in case of
using the AD620 circuit, also possible with a gain
resistor of 6,8KΩ;
• Gain of 7.26 in the acquisition board in case of
using the circuit LM324, this gain is also possible
with a gain resistor of 15KΩ;
• Gain of 150 in the conditioning board through
the inverting amplifier in block 1 of Figure 3, using
R1 = R2 = R3 = 1KΩ 150KΩ;
• High pass filter of about 0.5 Hz with a 2200uF
capacitor C1 shown in block 1 in Figure 3;
• Low pass filter of about 34Hz through a 47K
resistor in R4 and a 100nF capacitor C2 in block 2 in
Figure 3.
An Experiment to Assess an Acquisition Platform and Biomedical Signal Conditioning
81
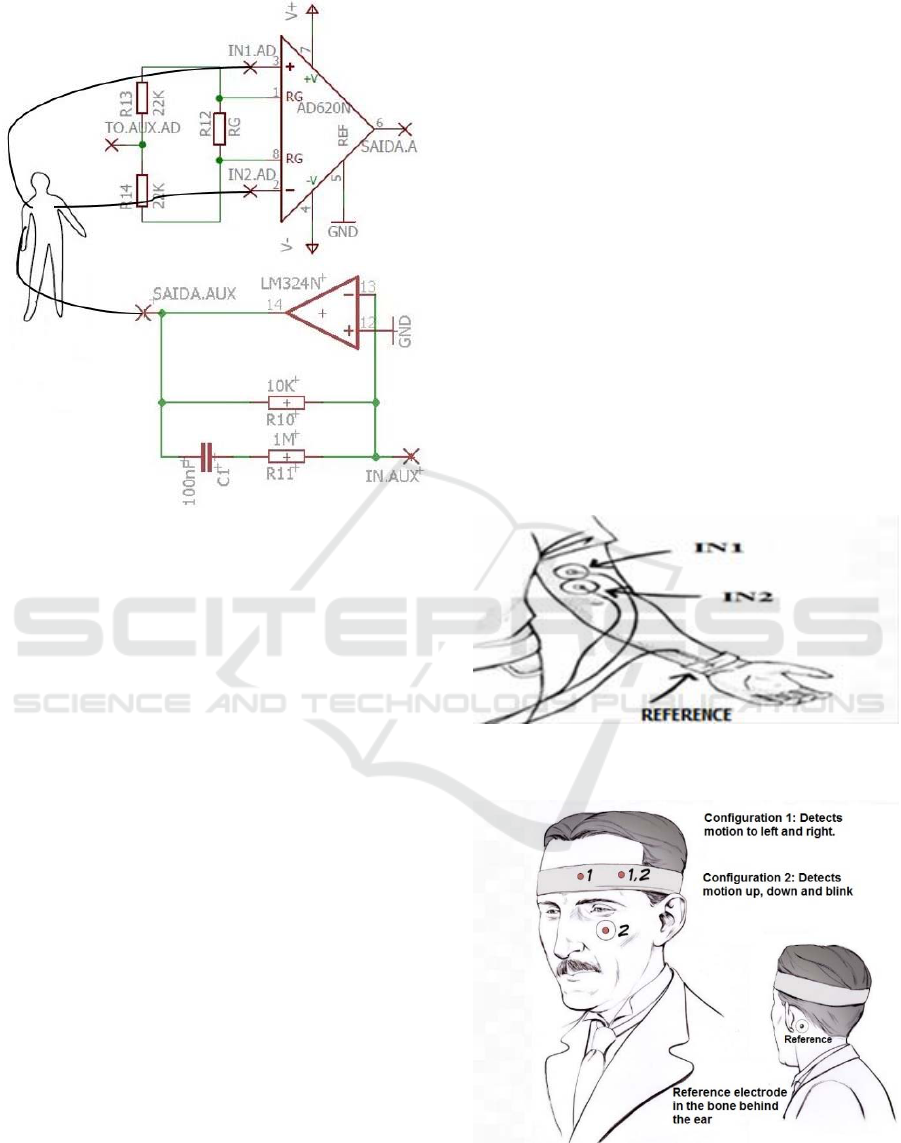
Figure 4: ECG acquisition schematic.
If the signal appears inverted, there is no problem,
since the voltage difference between the inputs is
acquired to observe the signal, reverse the electrodes
on the chest, placing what was on the left side goes to
the right, and what was on the right side goes to the
left side. This will make the signal before appeared
inverted and it will shown correctly.
In addition to these values, it is possible to vary
both the gain and the frequency passband and special
care should be taken with the 60Hz interference from
the power grid. For this, it is interesting to acquire the
signal away from wires connected to the electricity
grid and, if necessary, apply a band pass filter to
eliminate the interference (this was not applied in this
paper).
4.7.2 EMG Acquisition and Conditioning
For acquisition and conditioning of the EMG, it is
necessary to position the electrodes that will acquire
the muscle signal. For this, one electrode is placed in
the middle of the muscle and other electrode in
muscle base as shown in Figure 5. These positions
serves for both the AD620 and for the LM324, simply
connect the electrodes wires as in ECG.
The procedure is equal to ECG, but the passband
of the EMG signal with surface electrodes is
generally between 2-500Hz frequency and amplitude
between 50μV and 5mV amplitude (Cohen, 2006).
So the cutoff frequency of the low pass filter was
changed to 498Hz and the high pass remained the
same, in 0.5Hz, which had a good answer. The gain
in the conditioning board in Figure 3 was changed to
56, since the EMG signal has higher amplitude than
ECG.
4.7.3 EOG Acquisition and Conditioning
For acquisition and conditioning of EOG, one needs
to position the electrodes that will acquire the small
signal of the eye movement. The positioning depends
on which parts of the eye movement is wanted. If it is
the signal from moving to the left or to the right, the
electrodes are positioned at the side of the right
eyebrow and the other at the side of the left eyebrow.
If it is the signal from moving up, down, or blinking,
the electrodes must be placed as in configuration 2 in
Figure 6. The reference electrode is always at the
bone behind the left ear. Such placement serves for
both AD620 and LM324, simply connect the
electrode wires as in ECG.
Figure 5: EMG electrode positioning. SOURCE: adapted
from (Backyard Brains, 2016).
Figure 6: EOG electrode positioning. SOURCE: adapted
from (Backyard Brains, 2016).
ICEIS 2017 - 19th International Conference on Enterprise Information Systems
82

The value of the EOG signal varies from 50 to
3500µV with a frequency range between 0.001-
100Hz (Barea et al., 2002). The procedure is the same
as the ECG, but the low pass filter passband changed
to 1.5Hz and the gain to 220 times in the conditioning
board in Figure 3. Although there are frequencies up
to 100Hz in EOG, a 1.5Hz filter exhibits an
acceptable signal.
5 EXPERIMENT STEPS
In the following sections, the steps for the operation
of the experiment are presented, ranging from
preparation and implementation to validation of data.
5.1 Preparation
To prepare the participants for the experiment, a
quick assembly guide and a video showing how to
prototype EMG, ECG and EOG were provided.
Furthermore, a framework with the components (the
fixed ones) and connectors at the locations of the
variable components were provided already welded.
5.2 Execution
The experiment was conducted in the hardware
laboratory of the Federal University of Sergipe -
Campus São Cristóvão and in the electronics
laboratory at the Federal Institute of Sergipe –
Campus Itabaiana. After watching the video, reading
the user guide and answered some questions from the
participants, the experiment was started. It was the
prototyping of the acquisition and conditioning of
EMG, ECG and EOG signals, it is worth mentioning
the electrodes were placed on the body of the author
of this paper.
• Data Collection
After the experiment, the participants answered
the platform evaluation questionnaire (SUS) (Brooke,
1996). In the end, the authors performed the
calculations for the SUS usability score (SUS_Valor
metric) of each participant.
5.3 Data Validation
For the experiment, it was considered a factor
(prototyping of the acquisition and conditioning
platform of biomedical signals), and a treatment
(prototyping by the participants with more and less
experience). Given this context, the average
prototyping time and the mean of SUS usability scale
(Brooke, 1996) were computed.
To aid the analysis, interpretation and validation,
four types of statistical tests were used: Kolmogorov-
Smirnov (K-S), Shapiro-Wilk (S-W), Student’s t-test
(for independent samples), and Levene. K-S and S-W
tests were used to verify the normality of the samples.
The Student’s t-test was used to compare the average
of two independent samples, and finally, Levene's test
was used to evaluate the homogeneity of variances.
All statistical tests were performed using the
SPSS - IBM (2013) tool.
6 RESULTS AND DISCUSSION
With twenty four samples obtained at the end of the
experiment, the SUS score properly calculated, and
the classified participants, the experiment resulted in
G1 "with experience" with twelve samples and G2
"No Experience" with twelve samples. According to
Lopes et al. (2013), a great number of statistical tests
assume that the data follow a normal distribution to
be applied. Therefore, the Kolmogorov-Smirnov (K-
S) and Shapiro-Wilk (S-W) tests were applied to
assess the normality of the sample through the
Statistical Package for Social Sciences (SPSS)
(2013).
The K-S and S-W tests provide the p-value, which
according to Lopes et al, (2013), can be interpreted as
the degree of agreement between the data and the null
hypothesis (H0) and H
0
being the hypothesis that the
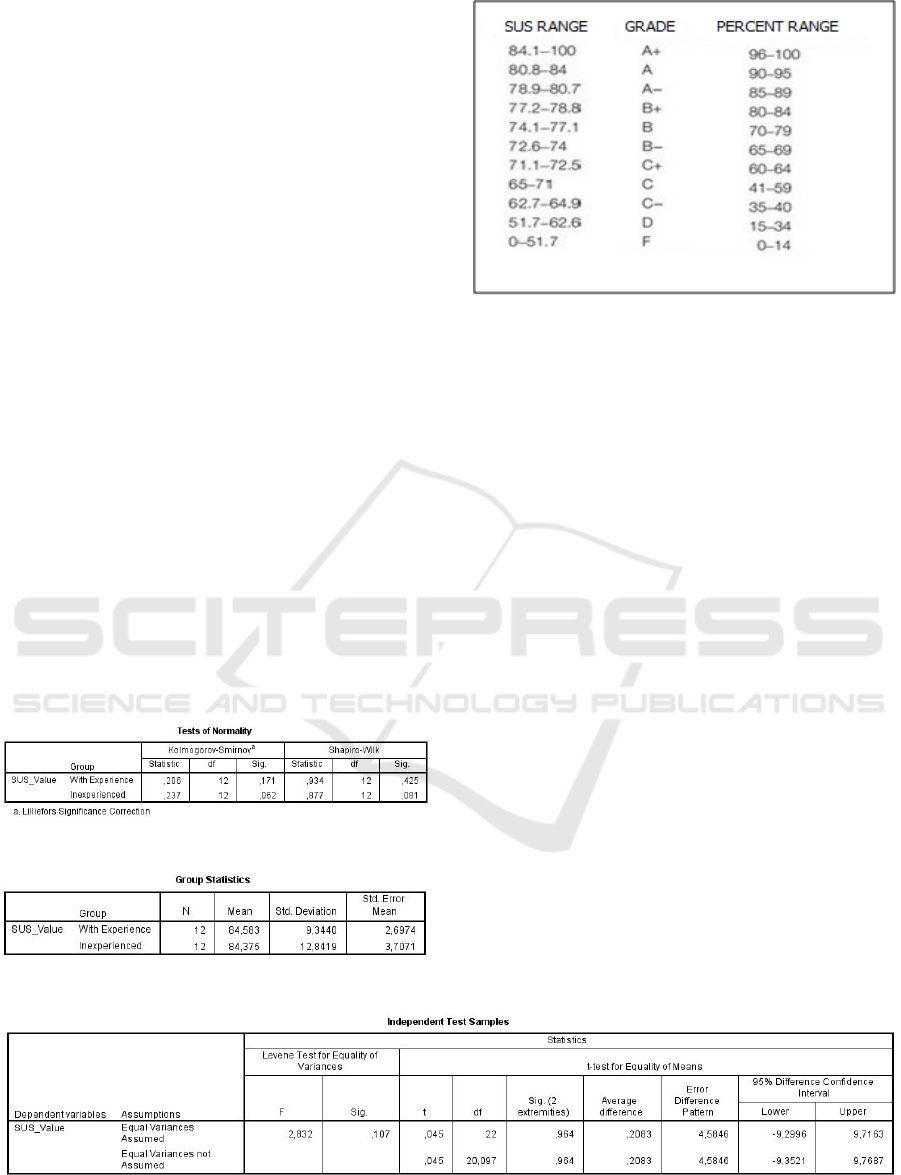
distribution is normal. Figure 7 shows the result of
normality test conducted in SPSS with a confidence
level of 95% (significance level α = 0.05). Note that
the group with experience obtained a p-value (sig)
larger than the alpha in both K-S (0.171> 0.05) and
S-W (0.425> 0.05), which means that there is no
evidence to reject the H
0
. This also happens to those
without experience, sig is greater than the alpha in
both K-S (0.062> 0.05) and S-W (0.081> 0.05). So
the normal distribution is a possible distribution for
this sample set and thus the T-student statistical test
can be applied. This test evaluates the hypothesis that
two population means are identical, in which case,
H
0SUS
claims the G1 average is equal to G2 average.
Figure 10 shows the result of the T-student test in
the SPSS with a confidence level of 95% (α = 0.05).
Note that the value of sig on Levene's test is greater
than alpha (0.107> 0.05), which means that there is
homogeneity of variance, and in this case one uses the
0.954 sig which is greater than the alpha and so there
is no evidence to reject the H
0SUS
. Thus, there is not
enough significance for the group means to differ.
From this, it can be concluded that the average
usability from the "experienced" group does not differ
An Experiment to Assess an Acquisition Platform and Biomedical Signal Conditioning
83
from the "no experience" group, which answers the
research question QP1. Thus, there is evidence that a
person with no experience in the field makes the
prototyping with the same ease of a person with
experience, due to the platform's usability.
To answer the research question QP2, the overall
average of usability of the platform this paper was
compared to BITalino platform (Silva et al., 2014),
which is a framework that works by fitting sensors
blocks in the main control block and has an overall
average of 84.62 and rated A+ for usability by the
rating scale of Sauro and Lewis (2012). It is also
characterized, according to the authors, as a user-
friendly platform.
Regarding the platform of this experiment, figure
8 shows the average from the "experienced" group
and "inexperienced" group and from it we can
identify the average overall usability of the
experiment, which is 84.479. According to figure 9,
the correlation of the SUS score is performed with the
note from the scale built by Sauro and Lewis (2012)
and it shows that, from a scale F to A+, the system
note is A +. Comparing these values, it can be seen
that both YouMake and BITalino, have grade A+ and
a general average of 84.479 and 84.62 respectively.
Thus, to have similar values, we can infer that
YouMake can be used as a low cost alternative for the
acquisition and conditioning of biomedical signals,
answering QP2.
To answer QP3 focused on the prototyping time
for each group.
Figure 7: Sample normality test of SUS.
Figure 8: Groups’ averages of SUS.
Figure 9: Grading scale interpretation table for SUS score.
SOURCE: Adapted from table 8.6, page 204 from (Sauro
and Lewis, 2012).
Figure 11 shows the result of the normality test
conducted in SPSS with a confidence level of 95% (α
= 0.05) and with H
0
the hypothesis that the
distribution is normal. Note that the "experienced"
group got a higher sig than alpha in both K-S (0.200>
0.05) and S-W (0.597> 0.05), which means that there
is no evidence to reject H
0
. This fact also happens
with the "no experience" group, the sig is greater than
alpha in both K-S (0.200> 0.05) and S-W (0.110>
0.05). Then the Normal distribution is a possible
distribution for the set of samples and thus the t-
student statistical test can be applied.
Figure 12 shows the result of the t-student test in
the SPSS with a confidence level of 95%, with H
0
which states that the prototyping time of G1 is equal
to G2. Note that the value of sig on Levene's test is
greater than alpha (0.155> 0.05), which means that
there is homogeneity of variance, and in this case one
uses the sig 0.201 which is higher than alpha and,
therefore, there is no evidence to reject the H
0tempo
.
Thus, there is not enough significance for the groups
prototyping time to differ.
From this, it can be concluded that the prototyping
time from the "experienced" group does not differ
from the "no experience" group, which answers the
research question PQ3.
Figure 10: T-student test for independent sample of SUS.
ICEIS 2017 - 19th International Conference on Enterprise Information Systems
84

Figure 11: Normality test for the time variable of time.
Figure 12: T-student test for independent samples of time.
7 THREATS TO THE
EXPERIMENTAL STUDY
VA L I D AT I O N
7.1 Internal Threat
The internal threat defines if the relationship between
treatment and result is casual, without the influence
of other factors that may not have been measured.
Participants answered the usability scale without
supervision, so there is the possibility of them not
having understood well some of the issues and may
have marked wrongly, besides the scale subjectivity.
However, care was taken so that the participants
didn’t talk among themselves, mitigating the insider
threat.
7.2 External Threat
The external threats are the conditions that limit the
ability to generalize. The experiments were
performed in two different laboratories because the
samples have been collected at the IFS and at the UFS
and, therefore, in different environments. Moreover,
the oscilloscopes (equipment used for signal viewing)
used in each laboratory were different in brand and
model. Thus, there is the possibility of users
answering the questions differently. Although the
overall number of samples are sufficient according to
Tullis and Stetson (2004), a larger number of samples
could better represent the general population of
students interested in biomedical signals.
7.3 Construction Threat
The construction threats are related to the design and
human factors. Such threat can be characterized by
the participants time spent. Perhaps the time is not the
best metric, because some users spend more time just
viewing the signal than others that are more objective.
7.4 Conclusion Threat
The conclusion threats are related to the ability to
reach a correct conclusion about the relationship
between about the treatment and the outcome. To
avoid hypotheses infringement, we used the
normality test, Shapiro-Wilk, and a parametric test, t-
test, for data analysis. To reduce the confiability
impact to the implementation of the treatment, we
followed the same experimental setup in both cases.
8 CONCLUSION AND FUTURE
WORK
From the results obtained in the experiment, we can
see that the platform YouMake can be used as a low
cost alternative for the acquisition and conditioning
of biomedical signals, in addition to showing that a
person with no experience can use the platform with
equal ease, and same prototyping time a person with
experience in the field.
As future work, we intend to integrate the capture
platform with the interfacing and digitalization
An Experiment to Assess an Acquisition Platform and Biomedical Signal Conditioning
85

platform that is being developed in another research.
ACKNOWLEDGMENT
We thank the Sergipe Federal Institute and the
computer department of the Sergipe Federal
University for provide the laboratories for the
experiments.
REFERENCES
Andrighetto, E., Adur, R., Rathke, J., Possa, P., Santos, F.,
Argoud, F., Azevedo, F. and Neto, J. (2008) ‘Proposta
de uma plataforma didática para o ensino de Engenharia
Biomédica em Cursos de Graduação de Engenharia
Elétrica: I Os Sinais Bioelétricos’, IV Latin American
Congress on Biomedical Engineering 2007,
Bioengineering Solutions for Latin America Health.
Springer Berlin Heidelberg, p. 1108-1112.
Babusiak, B. and Borik, S. (2013) ‘Bio-Amplifier with
programmable gain and adjustable leads’,
Telecommunications and Signal Processing (TSP),
2013 36th International Conference on. IEEE, p. 616-
619.
‘Backyard Brains’, (2016) Experiment: Eye Potentials (The
EOG), [Online], Available: https://backyard
brains.com/experiments/EOG. [30 jul 2016].
‘Backyard Brains’, (2016) Experiment: Record Electricity
from Your Muscles!, [Online], Available:
https://backyardbrains.com/experiments/muscleSpiker
Box. [30 jul 2016].
Bangor, A., Kortum, P., Miller, J. (2009) ‘Determining
what individual SUS scores mean: Adding an adjective
rating scale’, Journal of usability studies, v. 4, n. 3, p.
114-123.
Barea, R., Boquete, L., Mazo, M. and López, E. (2002)
‘Wheelchair guidance strategies using EOG’, Journal
of intelligent and robotic systems, 34(3): p. 279-299.
Basili, V. and Weiss, D. (1984) ‘A Methodology for
Collecting Valid Software Engineering Data’, IEEE
Transactions on Software Engineering. Vol 10(3): 728-
738.
‘Bitalino’,(2016) [Online], Available: http://www.bitalino.
com/ [30 Jul 2016].
Brooke, J. (1996) ‘A quick and dirty usability scale’, in
Jordan, P., Thomas, B., Weerdmeester, B. and
McClelland, I. (ed) Usability Evaluation in Industry,
pages 189–194. Taylor & Francis, London.
Cohen, A. (2006) ‘Biomedical signals: Origin and Dynamic
Characteristics; Frequency-Domain Analysis’, in
Bronzino, J. (ed) The Biomedical Engineering
Handbook. 2. ed. [S.l.]: CRC Press. cap. 52.
Collura, T. (1993) ‘History and evolution of
electroencephalographic instruments and techniques’,
Journal of clinical neurophysiology, v. 10, n. 4, p. 476–
504.
Guerreiro, J. (2013) A biosignal embedded system for
physiological computing, Tese de Doutorado. Instituto
Superior De Engenharia De Lisboa.
Lopes, M., Castelo Branco, V. and Soares, J. (2013)
‘Utilização dos testes estatísticos de Kolmogorov-
Smirnov e Shapiro-Wilk para verificação da
normalidade para materiais de pavimentação’,
Transportes, 21 (1), p. 59–66.
O'Sullivan, D. and Igoe, T. (2004) ‘Physical computing:
sensing and controlling the physical world with
computers’, Course Technology Press.
Prutchi, D. and Norris, M. (2005) ‘Design and development
of medical electronic instrumentation: a practical
perspective of the design, construction, and test of
medical devices’, John Wiley & Sons.
Sauro, J. and Lewis, J. (2012) ‘Quantifying the User
Experience: Practical Statistics for User Research’,
[Online], Elsevier Science, Available:
https://books.google.com.br/books?id=VKdoO5m5S0s
C. [30 jul 2016].
Silva, H., Guerreiro, J., Lourenço, A., Fred, A. and Martins,
R. (2014) ‘BITalino: A Novel Hardware Framework
for Physiological Computing’, Proc of the Int’l
Conference on Physiological Computing System
(PhyCS), p. 246–253.
Silva, M., Martucci, H., Santi, R. and Frère A. (2008)
‘Determinação automática da ansiedade por detecção
computadorizada de sinais biológicos’, IV Latin
American Congress on Biomedical Engineering 2007,
Bioengineering Solutions for Latin America Health,
Springer Berlin Heidelberg, p. 118-121.
‘SPSS’, (2013) IBM SPSS Statistics 22.0, [Online],
Available: http://www-01.ibm.com/common/ssi/
rep_ca/9/897/ENUS213-309/ENUS213-309.PDF. [30
jul 2016].
Tullis, T. and Stetson, J. (2004) ‘A comparison of
questionnaires for assessing website usability’,
Proceedings of UPA 2004 Conference, Minneapolis,
Minnesota.
Vijayprasath, S., Sukanesh, R. and Rajan, S. (2012)
‘Experimental explorations on EOG signal processing
for realtime applications in labview’, Advanced
Communication Control and Computing Technologies
(ICACCCT), 2012 IEEE International Conference on.
IEEE, p. 67-70.
Zanetti, R. (2013) Desenvolvimento de um Sistema
Embarcado Para Aquisição de Sinais Biomédicos.
Dissertação de Mestrado. Universidade Federal de
Minas Gerais.
ICEIS 2017 - 19th International Conference on Enterprise Information Systems
86
