
Short-Term Traffic Prediction under Both Typical and Atypical
Traffic Conditions using a Pattern Transition Model
Traianos-Ioannis Theodorou
1,2
, Athanasios Salamanis
1
, Dionysios D. Kehagias
1
, Dimitrios Tzovaras
1
and Christos Tjortjis
2
1
Information Technologies Institute, Centre for Research & Technology Hellas, GR 57001 Thermi-Thessaloniki, Greece
2
International Hellenic University, GR 57001 Thermi-Thessaloniki, Greece
Keywords: Short-Term Traffic Prediction, Atypical Conditions, Automatic Incident Detection, Support Vector Machines,
K-Nearest Neighbour, Autoregressive Integrated Moving Average.
Abstract: One of the most challenging goals of the modern Intelligent Transportation Systems comprises the accurate
and real-time short-term traffic prediction. The achievement of this goal becomes even more critical when the
presence of atypical traffic conditions is concerned. In this paper, we propose a novel hybrid technique for
short-term traffic prediction under both typical and atypical conditions. An Automatic Incident Detection
(AID) algorithm, based on Support Vector Machines (SVM), is utilized to check for the presence of an
atypical event (e.g. traffic accident). If such an event occurs, the k-Nearest Neighbors (k-NN) non-parametric
regression model is used for traffic prediction. Otherwise, the Autoregressive Integrated Moving Average
(ARIMA) parametric model is activated for the same purpose. In order to evaluate the performance of the
proposed model, we use open real world traffic data from Caltrans Performance Measurement System
(PeMS). We compare the proposed model with the unitary k-NN and ARIMA models, which represent the
most commonly used non-parametric and parametric traffic prediction models. Preliminary results show that
the proposed model achieves larger accuracy under both typical and atypical traffic conditions.
1 INTRODUCTION
Nowadays, the interest in developing Intelligent
Transportation Systems has grown significantly with
respect to the need for providing qualitative
transportation services, either for individuals or fleets
of vehicles. In this context, the ability to accurately
predict traffic in various steps ahead in time is of
paramount importance.
The main reason, for which the traditional traffic
prediction models fail to accurately predict traffic in
real conditions is the presence of atypical conditions.
These may include severe weather conditions, car
accidents, road maintenance works and traffic
congestion, due to special cultural events (e.g.
concerts or sport games). These atypical conditions
often result in steep spikes in the traffic time series
that the standard traffic prediction models fail to
accurately represent, as these models are based on big
traffic data with insignificant abnormalities.
Also, atypical events are difficult to classify
because they vary in type, duration, severity, effect on
the state of the traffic network, etc. On the other hand,
incidents may occur that do not cause observable
effects on traffic. Similarly, the occurrence of spikes
in a traffic time series does not necessarily correspond
to atypical conditions. These cases render the
problem of traffic prediction in atypical conditions as
a non-trivial one.
In this paper, we present a novel pattern transition
model for short-term traffic prediction for typical, as
well as (and more importantly) atypical conditions.
We use an SVM-based automatic incident detection
model to automatically detect the presence of an
atypical situation. When this case occurs, the non-
parametric k-NN regression model is fetched to
calculate the predicted traffic value. Otherwise, the
ARIMA parametric model is activated.
In summary, our main contributions can be outlined
as follows:
1. We propose a novel pattern transition model
for short-term traffic prediction under both
typical and atypical conditions. Our model
automatically recognizes the presence of an
atypical situation and activates the most
Theodorou, T-I., Salamanis, A., Kehagias, D., Tzovaras, D. and Tjortjis, C.
Short-Term Traffic Prediction under Both Typical and Atypical Traffic Conditions using a Pattern Transition Model.
DOI: 10.5220/0006293400790089
In Proceedings of the 3rd International Conference on Vehicle Technology and Intelligent Transport Systems (VEHITS 2017), pages 79-89
ISBN: 978-989-758-242-4
Copyright © 2017 by SCITEPRESS – Science and Technology Publications, Lda. All rights reserved
79

appropriate prediction model, based on the
outcome of an incident detection algorithm.
2. The proposed model incorporates the
incident information for more accurate
prediction.
3. We evaluate the functionality and
performance of our model against real data
that includes both traffic and incident
information.
The rest of the paper is organized as follows.
Section 2 summarizes related work. Section 3
describes the data used for training our prediction
model and for its evaluation, whereas Section 4
provides a detailed description of the implemented
model. Section 5 presents the evaluation framework,
including the process of setting up the various
experiments, the selection of the various datasets, the
metrics used for the evaluation of both the incident
detection and traffic prediction models and also the
experimental results. Finally, Section 6 concludes the
paper, reviewing the main contributions and
suggesting future directions.
2 RELATED WORK
The research problem of short-term traffic prediction
has been extensively studied in the last ten years. The
various relevant techniques can be roughly classified
into the following four major categories: naïve,
parametric, non-parametric and hybrid.
The naïve methods are the most cost-effective
prediction models and are mainly used as benchmark
against more sophisticated methods. They are
characterized by the absence of any advanced
mathematical model. Some of the most common
naïve methods for traffic prediction include the use of
the last observed value, the simple moving average
with a predefined time window T and the cumulative
moving average of all past traffic values.
Parametric models are the ones, which involve the
estimation of predefined parameters using historical
traffic data. These methods mainly originate from
time series analysis. Most of the works in this class
are based on the classic Box & Jenkins
Autoregressive Integrated Moving Average model
(Box and Jenkins, 1971). In their work, Stathopoulos
and Karlaftis presented a multivariate state-space
ARIMA approach for modelling and predicting
traffic flow, showing that different model
specifications are more appropriate for different
periods of the day (Stathopoulos and Karlaftis, 2003).
Moreover, Kamarianakis and Prastacos developed a
Space-Time ARIMA model with robust behavior
(Kamarianakis and Prastacos, 2005) which was
extended by Min and Wynter in an effort to deal with
the supposed stationarity of the process and the
constant relationship between the neighbor road
segments in a traffic network (Min and Wynter,
2011). More recently, an Auto-Regressive Moving
Average with an eXogenous input (ARMAX) model
with an optimal multiple-step-ahead predictor of
traffic demand was proposed by Wu et al. (Wu at al,
2014). In the same class, Mu et al. proposed a method
that utilizes heterogeneous delay embedding (HDE)
to extract an informative feature space for regression
analysis of traffic data (Mu et al., 2012). Additional
similar approaches include the works of (Guo and
Williams, 2010, Kamarianakis et al., 2012, Ghosh et
al., 2009).
The non-parametric models are mainly originated
from the machine learning field and are based on k-
NN regression, Artificial Neural Networks (ANN)
and Support Vector Regression (SVR) techniques.
The k-NN in short-term traffic prediction was
introduced by Smith and Demetsky who claimed that
it performs better than both the historical average and
parametric ARIMA model in terms of robustness
against variable data sets (Smith and Demetsky,
1996). The k-NN non-parametric regression
algorithm was utilized by several other researchers
for building accurate traffic prediction models (De
Fabritiis et al., 2008, Kindzerske and Ni, 2007,
Myung et al., 2012, Zheng and Su, 2014). Regarding
the use of ANNs, Vlahogianni et al. introduced the
auto- and cross-correlated effect of the traffic flow
time series in a neural network model in the form of
external information (Vlahogianni et al., 2003).
Finally, Wu et al. (Wu et al., 2003) and Hu et al. (Hu
et al., 2015) used the SVR algorithm for increasing
the accuracy of prediction.
Noticeable research effort has been given on the
development of hybrid traffic prediction techniques
that try to exploit the strong characteristics of both
parametric and non-parametric approaches. These
include e.g. a model that combines ARIMA and ANN
processes (Zhang, 2003), but also the combination of
Non-linear Autoregressive Moving Average with
exogenous inputs (NARMAX) that involves fuzzy
systems with ANN (Gao and Er, 2005). Similarly,
Quek et al. presented a special case of a fuzzy neural
network for short-term traffic prediction that shows
high adaptation to the input and high prediction
capacity (Quek et al., 2006).
Despite the multitude of proposed models for
short-term traffic prediction, very few of them deal
with the problem of traffic prediction under atypical
traffic conditions, such as rapid weather changes,
VEHITS 2017 - 3rd International Conference on Vehicle Technology and Intelligent Transport Systems
80
traffic incidents, road maintenance works, and special
events (e.g. concerts or sport events) etc. These
abnormalities lead to traffic conditions that the
traditional traffic predictions models are difficult to
capture. To this end, relevant research efforts are
quite limited. Amongst those, Castro-Neto et al.
proposed the Online Support Vector Regression (OL-
SVR) model for short-term traffic prediction under
both typical and atypical conditions (Castro-Neto et
al., 2009). They compared their model with well-
known models including Gaussian Maximum
Likelihood (GML), Holt exponential smoothing and
ANN and have proved that even if the GML model
shows the best performance in terms of prediction
accuracy under typical traffic conditions, the OL-
SVR model performs even better under non-recurring
atypical traffic conditions. Another example is the use
of three different prediction models, each with a
different configuration of the explanatory traffic
variable (Guo et al., 2010).
In this approach, it is shown empirically that k-
NN in conjunction with the third configuration of the
explanatory variable outperforms the ANN under all
conditions. Also in an extension of the previous work,
it is proven that the k-NN and SVR non-parametric
regression models have similar prediction accuracy
under typical traffic conditions but k-NN outperforms
SVR during atypical ones (Guo et al., 2012). By
enhancing the previous k-NN model with data
smoothing and de-noising components an even better
accuracy can be achieved (Guo et al., 2014). Hybrid
approaches have been also developed, such as the
Online Boosting Non-Parametric Regression
(OBNR), consisting of two parts: (a) a typical non-
parametric regression model for typical conditions,
and (b) a boosting part activated when atypical traffic
conditions occur and deactivated when the traffic
state turns back to normal. Real data experiments
prove that the OBNR model performs better than the
classic non-parametric regression and SVR models
during atypical traffic conditions (Wu et al., 2012).
Finally, an alternative approach was proposed by
Ni et al. which, in addition to traffic, it also uses data
from social networks (Twitter) in order to predict
traffic, prior to major sport game events. By fusing
both tweet rate and semantic features into the typical
prediction model, improved prediction accuracy can
be achieved (Ni et al., 2014).
A closer look on the current literature, does reveal
that in none of the aforementioned models traffic data
with atypical incidents is used for training. On the
contrary, training is based solely on data from typical
1
Available at: http://pems.dot.ca.gov/
conditions, whereas data from both typical and
atypical conditions is used for testing. Hence, the key
characteristic that distinguishes our work from the
current literature, is that in our model we incorporate
traffic data with atypical condition into the training
process of our proposed model. This is expected to
produce more accurate traffic prediction models.
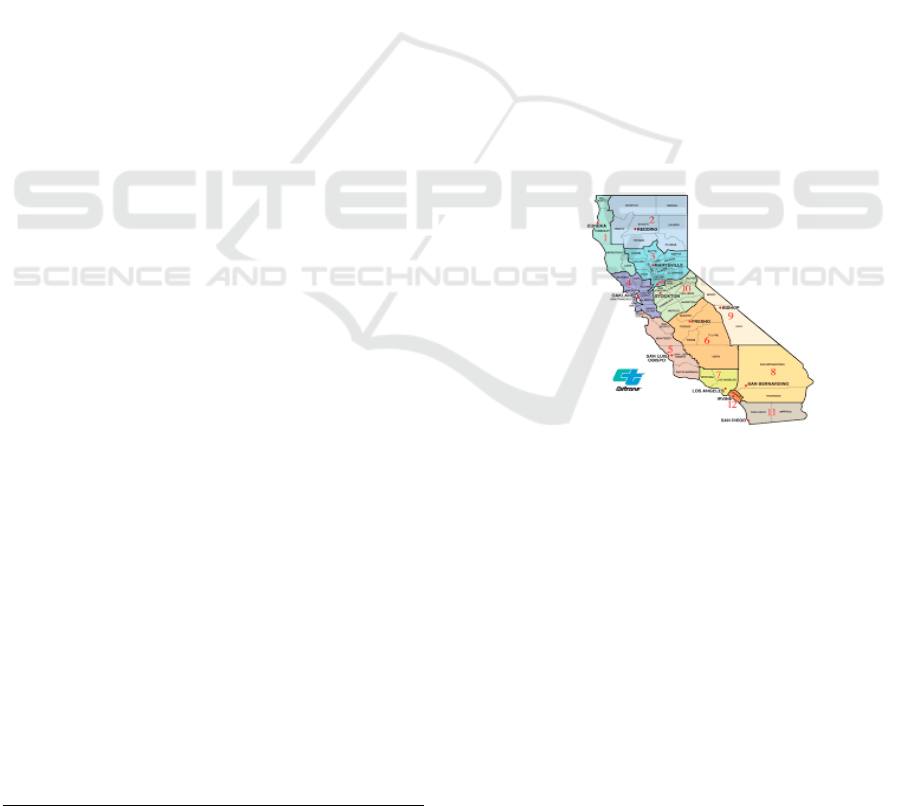
3 DESCRIPTION OF DATA
The Caltrans Performance Measurement System
(PeMS
1
), was used for building and evaluating our
model. PeMS is an Archived Data User Service that
collects over ten years of data for historical analysis.
The traffic data is coming from over 39,000 Vehicle
Detection Stations (VDS) scattered on the freeway
system of all major metropolitan areas of the State of
California, USA. They include flow, occupancy and
speed values, as well as meta-information about the
VDS, e.g. the identification numbers of the district
and the freeway, in which the VDS is located, the
coordinates of the VDS, etc. Traffic data is sampled
every 30 seconds and aggregated into 5-minute and
1-hour time intervals. The user can select to acquire
the data either in raw or aggregated format.
Figure 1: PeMS Caltrans map.
PeMS also provides incident data collected by the
California Highway Patrol (CHP). This dataset
contains information about the incidents occurred on
the Caltrans network, such as location of the incident
(latitude, longitude), timestamp, type (e.g. car
accident, road maintenance works etc.), duration (in
minutes), etc. The incidents are reported by network
users to CHP, which maintains logs. The map of the
overall area that provides traffic and incident data in
PeMS is shown in Figure 1.
For the purpose of our research we have used a
small part of the above dataset for training and
evaluating our model. In particular, our dataset
Short-Term Traffic Prediction under Both Typical and Atypical Traffic Conditions using a Pattern Transition Model
81
includes speed probes recorded in the areas of San
Jose, Oakland, California (district 4 in Figure 1) and
covers a total time period of 123 days, from May 1 to
August 31, 2015. We acquired data in their
aggregated form in 5-minute intervals. Also, the
dataset contains only incident data in the same area
and time period.
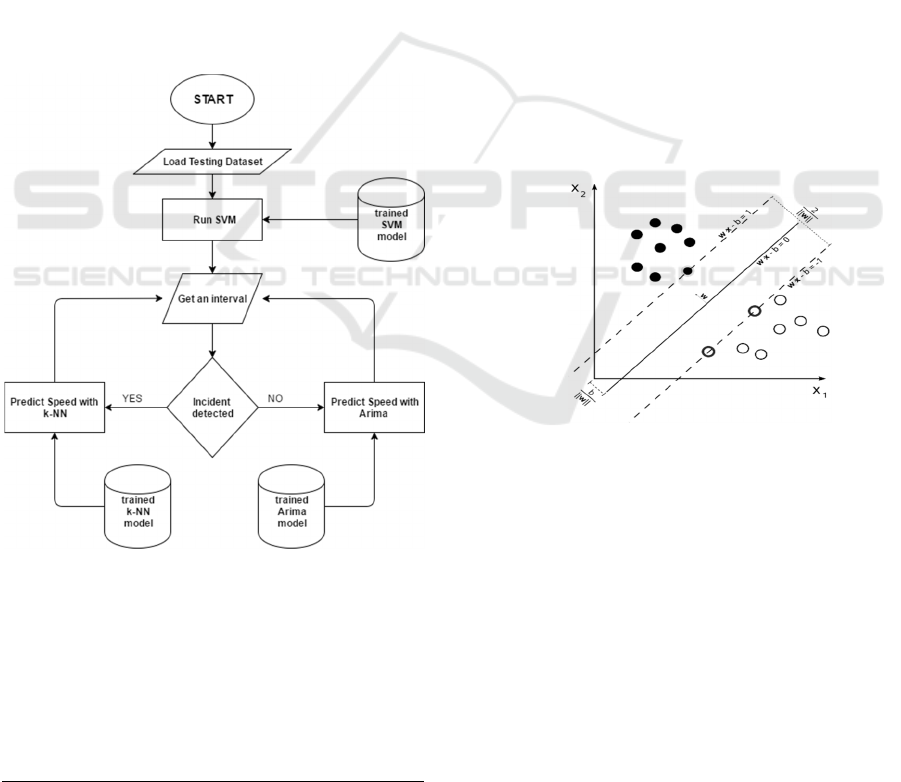
4 PATTERN TRANSITION
ALGORITHMS
In this section, we present the pattern transition model
we have developed for traffic prediction under both
typical and atypical conditions. We use a SVM-based
AID model to detect the occurrence of atypical
conditions. On detection of an atypical situation by
the AID, the k-NN non-parametric regression model
is activated. Otherwise, the ARIMA parametric
model is used. The flow chart of the Figure 2 shows
the whole process.
Figure 2:Flow Chart of the proposed method.
In the following subsections, we present all
modules that comprise the proposed model.
4.1 Automatic Incident Detection
In order to create our AID model, we used a
supervised machine learning algorithm. Specifically,
2
https://en.wikipedia.org/wiki/Support_vector_machine
we chose the Support Vector Machines algorithm,
which is fairly robust to irrelevant features (Gakis et
al. 2014). The basic idea of SVM is to generate a
hyperplane that divides the data set into classes. Our
problem is a binary classification one, thus we have
two classes, which represent the presence or absence
of an incident at a specific time interval and road of
the traffic network.
In the linear SVM, we are given a training data set
with n points of the form (x
1
, y
1
), …, (x
n
, y
n
) where y
i
indicates the class and takes either 1 or -1 as a value,
and x
i
is a p-dimensional real vector, called feature
vector. In our case the number of features is five,
hence x
i
is a 5-dimensional vector. The objective is to
find the maximum-margin hyperplane that divides the
group of points x
i
for which y
i
= 1, from the group of
such points that y
i
= -1, so that the distance between
the hyperplane and the nearest point x
i
from either
group is maximized. Any hyperplane can be written
as the set of all vectors x that satisfy:
0wx b⋅− =
(1)
where w is the normal vector to the hyperplane and
b/|w| a parameter that defines the offset of the
hyperplane from the origin, along the normal vector
w as shown in Figure 2.
Figure 3: Maximum-margin hyperplane and margins on
linear SVM kernel
2
.
In the feature extraction process, we tested both
speed and occupancy values in order to select the best
features. Initially we used only speed values to create
the features, and then we added features derived from
occupancy values. When the occupancy values
were
included to the feature extraction process, the
accuracy of the AID model was reduced and as a
consequence the traffic prediction accuracy. Finally,
different types of data (e.g. weather data) could be
used in the feature extraction process, but this remains
to be examined as future work.
VEHITS 2017 - 3rd International Conference on Vehicle Technology and Intelligent Transport Systems
82

For this reason, we used only speed in order to
detect the incidents occurred in a highway. Therefore,
we extracted two features based on the speed of the
road of interest and its adjacent roads. In addition to
the current time interval, the speed values of previous
intervals are also taken into account.
The first extracted feature F
1
is taken as the
difference between the speed of the road of interest
and the average speed of its adjacent roads, in the
direction that the vehicles travel, at current time. This
value was normalized by the speed of the road of
interest at the same time.
,(),
1
1
,
1
k
roi t ar j t
j
roi t
SS
k
F
S
=
−
=
(2)
In (2), S represents speed, whereas index ar refers to
the adjacent road, roi refers to the road of interest, k
is the total number of adjacent roads and t is the
current interval.
We also extracted the following three features
(based on F
1
) for three time intervals prior to the
current one:
,1 (),1
1
2
,1
1
k
roi t ar j t
j
roi t
SS
k
F
S
−−
=
−
−
=
(3)
,2 (),2
1
3
,2
1
k
roi t ar j t
j
roi t
SS
k
F
S
−−
=
−
−
=
(4)
,3 (),3
1
4
,3
1
k
roi t ar j t
j
roi t
SS
k
F
S
−−
=
−
−
=
(5)
The selection of the optimal number of previous
intervals, was made after experimentation with
various numbers.
The selection of the above features is based on the
observation that when an incident occurs on a road,
the average speed of this road and its neighbouring
ones, in the same direction, decreases. However,
taking into account only the values of these features,
results in a biased model, prone to error, as it becomes
capable of detecting low speeds, and especially much
lower than the speed of the adjusted roads. Therefore,
the selection of one more feature was necessary. To
this end, we used as an extra feature the average
absolute deviation of the real speed of the road of
interest at current time with respect to its average
value of all previous intervals up to the current one
(including this).
,
0
5
,
0
|()|
,
1
()
1
p
roi t j roi
j
p
roi t k
k
roi
SmS
F
p
S
mS
p
−
=
−
=
−
=
+
=
+
(6)
where S is the speed of the road of interest, p is the
number of past intervals, over which we calculate the
average value m(S). As a fifth feature, we also tested
the squared deviation from the mean of the speed.
This resulted in reduced classifier’s accuracy. These
are the five feature that comprise the vector space
model for each road of interest. Based on the feature
vectors produced in this way, a different SVM-based
AID model is built for each road of interest.
Finally, we experimented with various values for
the C parameter of the SVM algorithm, using one-out
cross validation, in order to estimate those that fit
better to our case. Using a grid search on C = 2
-5
, 2
-3
,
…, 2
15
with step 2, we concluded that the most
appropriate value is C = 1.1.
4.2 Traffic Prediction
For the task of traffic prediction, we used two models:
(a) the ARIMA parametric model and (b) the k-NN
model, in order to predict traffic under typical and
atypical conditions, respectively. Based on the
relevant literature regarding traffic prediction under
atypical conditions (Section 2), the time series models
fail to capture the abnormalities on the values of the
examined traffic variable, that are generated during a
traffic incident. On the other hand, the non-parametric
models and specifically the non-parametric
regression (e.g. k-NN regression) can follow these
abnormalities especially when these models have
been fitted using data from similar past abnormal
conditions.
4.2.1 Autoregressive Integrated Moving
Average
The Auto Regressive Integrated Moving Average
(ARIMA) family of models is the most widely
deployed approach for vehicular traffic prediction
and for time series prediction in general. ARIMA is a
generalisation of the Auto-Regressive Moving
Average (ARMA) model, which is applied strictly to
stationary time series.
An ARIMA (p, d, q) process is expressed as:
Short-Term Traffic Prediction under Both Typical and Atypical Traffic Conditions using a Pattern Transition Model
83

()
11
11 1
pq
d
ii
itit
ii
LLX L
ϕ
θε
==
−⋅−⋅=+⋅
(7)
where p is the order of the autoregressive model, d is
the degree of differencing and q is the order of the
moving average model. In our case, we used an
ARIMA (3, 1, 0) model with three previous terms and
1
st
degree of differencing for reaching stationarity.
The resulted model is show in equation:
'' ' '
,1,12,23,3roi t roi t roi t roi t
SS S S
ϕϕ ϕ
−− −
=⋅ +⋅ +⋅
(8)
where
'
,,,1roit roit roit
SSS
−
=−
(9)
is the differenced S
’
process, which is wide-sense
stationary. According to Pfeifer and Deutsch, the best
estimate of parameters φ are the maximum likelihood
estimates (Pfeifer and Deutsch, 1980). As without a
priori knowledge of their initial values, these
estimates cannot be exactly computed, a close
approximation via ordinary least squares (OLS) is
used. In particular, for every training sample an
equation of the form of (9), is constructed where φ are
the unknown parameters. This forms a linear
overdetermined system of equations of the form:
yX
β
=⋅
(10)
The system given by the aforementioned equation can
be re-written by the use of normal equations, as:
()
^
TT
X
XXy
β
⋅= ⋅
(11)
Using the OLS method we take the following
solution.
()
^
1
TT
X
XXy
β
−
=⋅⋅⋅
(12)
When the model is built (the φ parameters have been
estimated) we use the following equation for
calculating the predicted value:
''''
12132th t t t
SSSS
ϕϕ ϕ
+−−
=⋅+⋅ +⋅
(13)
where, h is the prediction horizon.
4.2.2 k-Nearest Neighbors
For the prediction of the speed values under atypical
conditions we have chosen the k-NN regression
model which appears to be a suitable algorithm for
atypical traffic prediction, using an atypical historical
dataset. k-NN is a non-parametric algorithm that
stores all available cases and predicts the numerical
target based on a similarity measure and an averaging
scheme. The k-NN algorithm has been used in
statistical estimation and pattern recognition tasks,
already since the beginning of 1970’s as a non-
parametric technique.
k-NN prediction is based on the current state
vector (at current time interval t), of the form:
,,,1,2,
,, ,,
roi t roi t roi t roi t roi t p
ySSS S
−− −
=
(14)
where S is the traffic variable (in our case speed) and
p the number of past intervals. As shown, the current
state vector of a road of interest depends on the values
of speed at the current and previous p time intervals.
In order to make prediction, the k-NN algorithm
creates vectors of the form (14), y
1,t
, y
2,t
, … , y
N,t
for N
other roads of the network. When a prediction for the
road of interest for h intervals ahead in time is
requested, the algorithm compares y
roi,t
, with y
1,t
, y
2,t
,
… , y
N,t
using a distance metric (usually Euclidean
distance) and keeps the k vectors with the shortest
distances.
Then, it calculates the value S
roi,t+h
using an averaging
scheme on the estimated k neighbors, which in the
simplest form is given by (15).
,
1
,
k
it h
i
roi t h
S
S
k
+
=
+
=
(15)
In our implementation, we used the inverse
distance weighted average as the averaging scheme,
as shown in (16).
,
1
,
k
iith
i
roi t h
wS
S
k
+
=
+
=
,
(16)
where:
()
2
,
,,
0
11 1
i
p
iroii
roi t j i t j
j
w
dd
SS
−−
=
== =
−
(17)
VEHITS 2017 - 3rd International Conference on Vehicle Technology and Intelligent Transport Systems
84

We chose the optimal value for k via one-out cross
validation in our data set, based on the prediction
accuracy results. By this process, we concluded that
the most optimal value of k in our case was 6.
5 EVALUATION
In this section, we present the set-up of the evaluation
framework, including the construction of the traffic
time series and their enrichment with incident
information, the choice of a specific part of the
Caltrans road network as case study and the
separation of the training and test data. Finally, the
preliminary evaluation results are presented.
5.1 Constructing Traffic Time Series
with Incident Information
In order to build and evaluate our model the first step
was to pre-process the initial data (both traffic and
incidents) in order to create traffic time series that will
include incident information. For this reason, we
discretized time into 5-minute intervals and we
aggregated the speed values that belong to each
interval. We used this formulation in order to both fit
our model and to make predictions for a number of
steps ahead in time. In the case of short-term traffic
prediction, the predictions are made for up to 1 hour
ahead in time, i.e. 12 5-minutes intervals.
In the examined area, there are 350 VDS in total,
from which 112 were not taken into account because
they provided only zero values. The traffic data from
the remaining 238 VDS were matched to road
segments of the Caltrans network (based on their
coordinates). This process resulted into 55 road
segments having traffic data. As we described above,
the features of our AID model take into account not
only the speed of the road of interest, but also the
speed of its adjacent roads. For this reason, we kept
only the road segments for which, their spatial
neighbors traffic data exist.
Concerning incident data, there were 4,193
incidents in the area and time period concerned.
These incidents where matched to the aforementioned
55 road segments, for which traffic data is available.
For each day of the total examined period and each of
these 55 road segments, a speed time series was
constructed from speed values occurred in the
specific 5-minute interval of this day and road
segment. In this way 6,765 (55 road segments times
123 days of traffic data for each road segment) speed
were constructed. These time series, in addition to
traffic information, include typical and atypical
intervals, indicated by 0 and 1, respectively. The
value 1 indicates presence of an incident in the
specific time interval and 0 its absence. For instance,
for the road segment with identification number 76 on
May 21, 2015 on time interval 01:10-01:15 the
corresponding value of the speed time series is
‘66.55;0’. This means that the speed was 66.55 mph
and no incident situation was present.
5.2 Case Study: A Part of US101
Highway
One of the main difficulties when trying to predict
traffic under atypical conditions, is that the effect of
abnormalities on traffic time series is not easily
observable and interpretable. For instance, there may
be an incident with specific characteristics (type,
duration, severity, etc.) that caused a steep fall on the
traffic time series of a road network, and another
incident with exactly the same characteristics that
happened on the same road at a different time of the
day and had no effect on the traffic time series. On the
other hand, there may be observable discrepancies
from the typical pattern of the traffic time series that
do not necessarily correspond to the presence of an
incident. These situations may confuse the AID
model. In order to overcome these difficulties, we had
to choose road segments with observable effects on
their traffic time series due to occurring incidents.
5.3 Training Versus Testing Data
The traffic time series of the aforementioned road
segment consist the main data set. From this, the one
that corresponds to 25 August, 2015 was selected as
a test time series, which has both typical and atypical
intervals. This time series was selected because it has
spikes that corresponds to the occurrence of incidents.
The preceding 116 time series formed the training
data set. From this, we created three separated data
sets in order to fit our model and the benchmarking
methods in different traffic conditions. The first data
set includes only the ones without atypical intervals
(incident-free), whereas the second data set includes
those with both typical and atypical (incident).
Finally, the third one contains all time series (total).
We trained the AID and the k-NN models using
the total training data set, whereas for the ARIMA
model the incident-free data set was used. Hence, we
incorporate incident information to the fitting process
of our model, as opposed to the current related work.
Short-Term Traffic Prediction under Both Typical and Atypical Traffic Conditions using a Pattern Transition Model
85

5.4 Benchmarks and Accuracy Metrics
For the evaluation of the AID model we calculated a
number of metrics using one-out cross validation in
the total training data set. The first metric that we
calculated was the accuracy:
TP TN
Accuracy
TP FP TN FN
+
=
+++
(18)
where TP is the true positive, TN the true negative,
FP the false positive and FN the false negative
predicted classes. However, accuracy is not really a
reliable metric for the real performance of a classifier
when the number of samples in different classes vary
greatly (unbalanced target) because it will yield
misleading results. In our case, from the total number
of 288 intervals in the traffic time series, only in 30
or less intervals an incident was occurred. For this
reason, in order to evaluate our model accurately, we
calculated two additional metrics. The first one is
sensitivity, a measurement of the proportion of
positives that are correctly identified, whose formula
is shown below:
TP
Sensitivity
TP FN
=
+
(19)
The second additional metric is specificity, which
measures the proportion of negatives that are
correctly identified. Its formula is given by the
following equation:
TN
Specificity
TN FP
=
+
(20)
Using the sensitivity and specificity we created the
Receiver Operating Characteristic (ROC) curve,
which illustrates the performance of our classifier.
For benchmarking we used the unitary ARIMA
and k-NN models. These models were initially fitted
using only the incident-free training data set, as
happens in most of the works on traffic prediction
under atypical conditions in current literature, and
then using different combinations of all three datasets
(incident-free, incident and total). We assessed the
resulted accuracies by the means of two metrics: (a)
the Root Mean Square Error (RMSE) and (b) the
Symmetric Mean Absolute Percentage Error
(SMAPE).
RMSE is given by the following formula:
2
1
()
n
tt
t
PA
RMSE
n
=
−
=
,
(21)
where n is the number of predictions, A
t
the actual
values and P
t
the predicted values.
SMAPE gives a percentage error that has both a
lower and an upper bound of 0% and 100%,
respectively. This makes its values more easily
interpretable. The formula of SMAPE is the
following:
1
||
100%
||||
n
tt
t
tt
PA
SMAPE
nAP
=
−
=⋅
+
,
(22)
where n is the number of predictions, A
t
the actual
values and P
t
the predicted values.
5.5 Experimental results
The evaluation results of the AID model are shown in
Table 1. Additionally, the ROC curve of the classifier
is shown in Figure 1.
Table 1: The evaluation results of the AID model.
AID evaluation metrics
Accurac
y
0.8986
Sensitivit
y
0.6364
Specificit
y
0.9091
Figure 4: ROC curve of the proposed AID schema.
We can see that although the proposed model is
quite above the line of no-discrimination (the
diagonal line), it is also quite far from the upper left
corner of the ROC space (best possible classification
prediction). This mainly happens due to the
imbalance of the records of the classification classes
(incident, non-incident) in the examined data set. In
any case, the curve shows that there is enough room
for improvement for the proposed AID model.
VEHITS 2017 - 3rd International Conference on Vehicle Technology and Intelligent Transport Systems
86
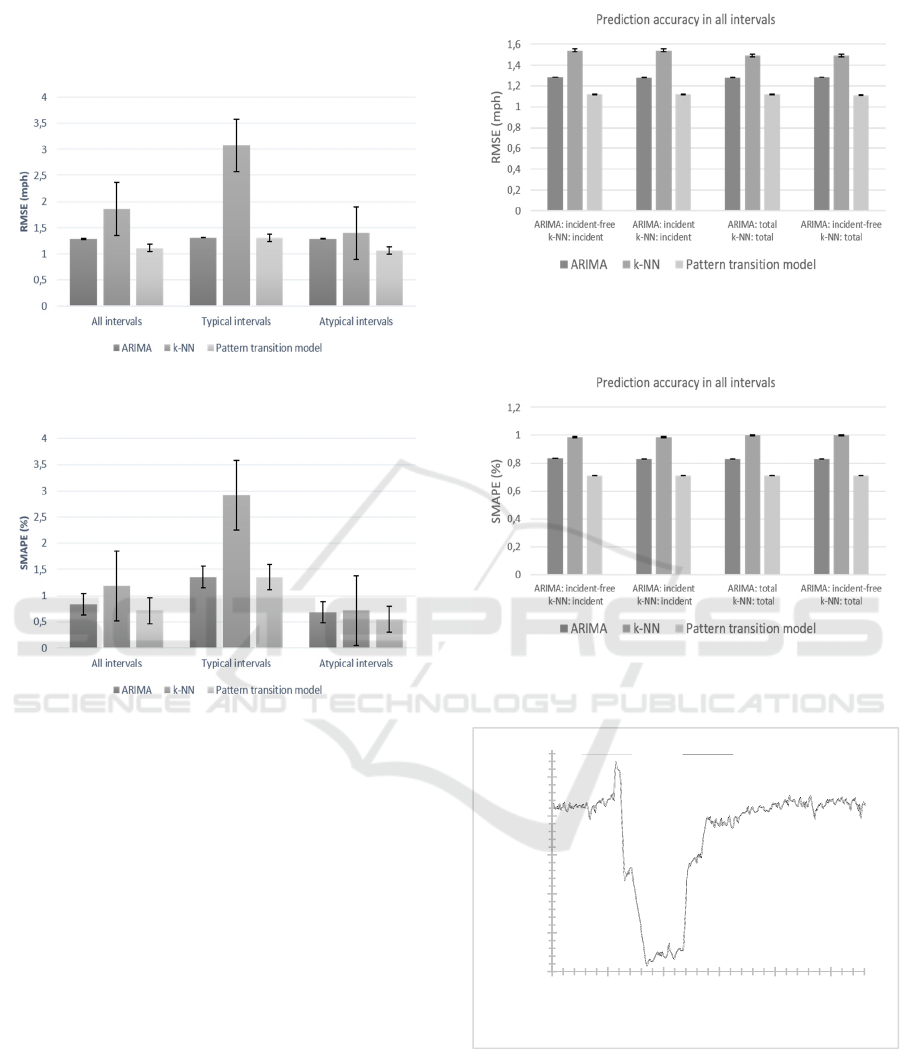
The results of the experiments regarding the
prediction accuracy of our model are shown in Figure
5 and Figure 6.
Figure 5: Prediction accuracy results in RMSE.
Figure 6: Prediction accuracy results in SMAPE.
As shown in the aforementioned figures, in total,
the proposed model outperforms its competitors. In
particular, our model presents almost similar
prediction accuracy with the ARIMA model under
typical conditions, but it exhibits the best
performance under atypical conditions.
As already mentioned, the benchmarking models
were initially trained by incident-free data.
Subsequently, we conducted a series of experiments,
in which the two unitary benchmarking models were
trained using different combinations of the incident-
free, incident and total data sets. In this way, we
incorporated the incident information not only in the
data fitting process of the proposed model, but also in
the fitting process of its competitors. As shown in
Figure 7 and Figure 88, again the proposed model
presents superior accuracy for all intervals.
Figure 7: Prediction accuracy results in RMSE, for different
benchmarking combinations and for all intervals.
Figure 8: Prediction accuracy results in SMAPE, for
different benchmarking combinations and for all intervals.
Figure 9: Real and predicted speed time series.
In Figure 9 is shown both the actual and the predicted
time series of speed. It is obvious that the proposed
model fits the actual values of speed.
In order to evaluate the statistical significance of
the improvement that our model introduces we run a
t-test. To this end, we examine the null hypothesis
23
33
43
53
63
73
0 50 100 150 200 250
Speed (mph)
5-minute inteval
real predicted
Short-Term Traffic Prediction under Both Typical and Atypical Traffic Conditions using a Pattern Transition Model
87

that the proposed model has equal accuracy with the
ARIMA model. Since there is no indication that the
predicted values have normal distributions, we used
the Wilcoxon signed-rank test. The test showed that
at significance level of 0.05 the null hypothesis could
be rejected for all the aforementioned benchmarking
cases. Therefore, we can claim that the proposed
model presents statistically significantly better
accuracy from the ARIMA model in all cases.
6 CONCLUSIONS
In this paper we introduced a novel hybrid method for
short-term traffic prediction under both typical and
atypical traffic conditions. We introduced a SVM-
based AID model that identifies the presence of
atypical conditions. We use the ARIMA parametric
model or the k-NN non-parametric regression model
if the AID identifies typical or atypical conditions,
respectively. We evaluated our model using real open
data from the Caltrans PeMS and showed that it
outperforms the benchmarking models in terms of
prediction accuracy under both typical and atypical
conditions.
The proposed model can be implemented using
either speed or flow data. In this work, we selected
speed data because speed is a traffic variable that
provides clearly interpretable results regarding the
traffic state of a network and also it can be easily
converted to travel time, which is a useful metric for
many ITS applications like vehicle routing.
Future work involves experimenting with
additional feature extraction techniques for
improving the accuracy of the proposed AID model.
Furthermore, more extensive comparison of the
proposed model against additional prediction models
using larger data sets is essential for further
investigating the conditions under which the
proposed model provides the best performance.
ACKNOWLEDGMENT
This work has been partially supported by the
European Commission through the project
RESOLUTE (ID: 653460), funded by Horizon 2020.
The opinions expressed in this paper are those of the
authors and do not necessarily reflect the views of the
European Commission.
REFERENCES
Abdulhai, B., Porwal H., Recker, W., 1997. Short term
freeway traffic flow prediction using genetically
optimized time delay based neural net-works. Proc.,
78
th
Transportation Research Board Annual Meeting,
Washington D. C., USA.
Box, G. E. P. and Jenkins, G. M., 1971. Time series analysis
forecasting and control. Operational Research
Quarterly, 22(2), June, pp.199-201.
Castro-Neto, M., Jeong, Y. S., Jeong, M. K., Han, L. D.,
2009. Online-SVR for short-term traffic flow prediction
under typical and atypical traffic conditions. Expert
Systems with Applications, 36(3), pp.6164-6173.
Clark, S., 2003. Traffic Prediction Using Multivariate
Nonparametric Regression. Journal of Transportation
Engineering, 129(2), pp.161-168.
De Fabritiis, C., Ragona, R., Valenti, G., 2008. Traffic
estimation and prediction based on real time floating car
data. Proc., IEEE 11
th
International Conference on
Intelligent Transportation Systems, pp.197-203.
Dougherty M. S. and Cobbet M. R., 1997. Short term inter-
urban traffic fore-casts using neural networks.
International Journal of Forecasting, 13(1), March,
pp.21-31.
Gakis E., Kehagias D., Tzovaras D., 2014. Mining Traffic
for Road Incidents Detection. IEEE 17
th
International
Conference on Intelligent Transportation Systems,
Qingdao, China, pp. 930-935.
Gao, Y. and Er, M., J., 2005. Narmax time series model
prediction: feed-forward and recurrent fuzzy neural
network approaches. Fuzzy Sets and Systems, 150(2),
March, pp.331-350.
Ghosh, B., Basu, B., O’Mahony, M., 2009. Multivariate
short-term traffic flow forecasting using time-series
analysis. IEEE Transactions on Intelligent
Transportation Systems, 10(2), pp.246-254.
Guo, F., Krishnan, R., Polak, J. W., 2012. Short-Term
Traffic Prediction Under Normal and Abnormal Traffic
Conditions on Urban Roads. 91
st
Transportation
Research Board Annual Meeting, Washington D. C.,
USA.
Guo, F., Krishnan, R., Polak, J. W., 2014. A novel three-
stage framework for short-term travel time prediction
under normal and abnormal traffic conditions. 93
rd
Transportation Research Board Annual Meeting,
Washington D. C., USA.
Guo, F., Polak, J. W., Krishnan, R., 2010. Comparison of
Modelling Approaches for Short-Term Traffic
Prediction under Normal and Abnormal Conditions.
IEEE 13
th
International Conference on Intelligent
Transportation Systems, Madeira Island, Portugal.
Guo, J. and Williams, B. M., 2010. Real-time short-term
traffic speed level forecasting and uncertainty
quantification using layered Kalman filters.
Transportation Research Record: Journal of
Transportation Research Board, 2175, pp.28-37.
Hu, W., Yan, L., Liu, K., Wang, H., 2015. A Short-term
Traffic Flow Forecasting Method Based on the Hybrid
PSO-SVR. Neural Processing Letters, pp.1-18.
VEHITS 2017 - 3rd International Conference on Vehicle Technology and Intelligent Transport Systems
88

Innamaa, S., 2000. Short term prediction of traffic situation
using MLP-neural networks. Proc., 7
th
World Congress
on Intelligent Systems, Turin, Italy, pp.1-8.
Kamarianakis, Y. and Prastacos, P., 2005. Space-time
modelling of traffic flow. Computers & Geosciences,
31(2), pp.119-133.
Kamarianakis, Y., Shen, W., Wynter, L., 2012. Real-time
road traffic forecasting using regime-switching space-
time models and adaptive LASSO. Applied Stochastic
Models in Business Industry, 28(4), pp.297-315.
Kindzerske, M. D. and Ni, D., 2007. Composite nearest
neighbour nonparametric regression to improve traffic
prediction. Transportation Research Record: Journal
of Transportation Research Board. 1993(1), pp.30-35.
Min, W. and Wynter, L., 2011. Real-time traffic prediction
with spatiotemporal correlations. Transportation
Research Part C: Emerging Technologies, 19(4),
August, pp.606-616.
Mu, T., Jiang, J., Wang, Y., 2012. Heterogeneous delay
embedding for travel time and energy cost prediction
via regression analysis. IEEE Transactions on
Intelligent Transportation Systems, 14(1), pp. 214-224.
Myung, J., Kim, D. K., Kho, S. Y., Park, C. H., 2012. Travel
Time Prediction Using k-Nearest Neighbour Method
with Combined Data from Vehicle Detector System and
Automatic Toll Collection System. Transportation
Research Record: Journal of Transportation Research
Board, 2256, pp.51-59.
Ni, M., He, Q., Gao, J., 2014. Using Social Media to Predict
Traffic Flow under Special Event Conditions. 93
rd
Transportation Research Board Annual Meeting,
Washington D. C., USA.
Pfeifer, P. E. and Deutsch, S. J., 1980. A three-stage
iterative procedure for space-time modelling.
Technometrics, 22(1), February, pp.35-47.
Quek, C., Pasqueir, M. and Lim, B. B. S., 2006. Pop-traffic:
a novel fuzzy neural approach to road traffic analysis
and prediction. IEEE Transactions on Intelligent
Transportation Systems, 7(2), June, pp.133-146.
Smith, B. L. and Demetsky, M. J., 1996. Multiple interval
freeway traffic flow prediction. Transportation
Research Record: Journal of Transportation Research
Board, 155(4), pp.136-141.
Stathopoulos, A. and Karlaftis, M. G., 2003. A multivariate
state-space approach for urban traffic flow modelling
and prediction. Transportation Research Part C:
Emerging Technologies, 11(2), April, pp.121-135.
Vlahogianni, E. I., Karlaftis, M. G., Golias, J. C., 2003. A
multivariate neural network predictor for short term
traffic prediction in urban signalized arterial. Proc. 10
th
IFAC Symposium on Control in Transportation
Systems, Tokyo, Japan, August.
Williams, B. M., Dursavula, P. K., Brown, D. E., 1998.
Urban freeway traffic flow prediction – Application of
seasonal autoregressive integrated moving average and
exponential smoothing models. Transportation
Research Record: Journal of Transportation Research
Board, 1644, pp.132-141.
Wu, C. H., Wei, C. C., Su, D. C., Chang, M. H., Ho, J. M.,
2003. Travel Time Prediction with Support Vector
Regression. IEEE 6
th
International Conference on
Intelligent Transportation Systems, Shanghai, China.
Wu, T., Xie, K., Xinpin, D., Song, G., 2012. A online
boosting approach for traffic flow forecasting under
abnormal conditions. Proc., 9
th
International
Conference on Fuzzy Systems and Knowledge
Discovery, Sichuan, China.
Zhang, G. P., 2003. Time series prediction using a hybrid
ARIMA and neural network model. Neurocomputing,
50, January, pp.159-175.
Zheng, Z., Su, D., 2014. Short-term traffic volume
forecasting: A k-nearest neighbour approach enhanced
by constrained linearly sewing principle component
algorithm. Transportation Research Part C: Emerging
Technologies, 43, pp.143-157.
Wu, Cheng-Ju, Schreiter, Thomas, & Horowitz, Roberto
2014. Multiple-clustering ARMAX-based predictor
and its application to freeway traffic flow prediction.
American Control Conference (ACC), 2014 IEEE
Short-Term Traffic Prediction under Both Typical and Atypical Traffic Conditions using a Pattern Transition Model
89
