
An Assessment of Feasibility of Energy Saving Measures
Applied for a Hospital
Cheng-Shu Kuo
1
, Chen-Pu Wang
2
, Fu-Jen Wang
2
, Pei-Yu Yu
1
and Hung-Wen Lin
1
1
Green Energy and Environment Research Laboratories, Industrial Technology Research Institute, Hisnchu, Taiwan
2
Department of Refrigeration, Air Conditioning and Energy Engineering,
National Chin-Yi University of Technology, Taichung, Taiwan
Keywords: Retrofit, Hospital, Energy Saving, EnergyPlus.
Abstract: The objective of this study, including field investigations and simulations, is to evaluate the feasibility of
retrofit for energy performance of a hospital in the midst of Taiwan. This hospital, twelve stories and two
floors of basements, has 37490 m
2
of gross floor area, consuming around 8500000 kWh annually. The
current internal systems of this hospital present relevant signs of degradation and obsolescence. Concerning
this matter, the retrofit plan of internal systems for this hospital is conducted to improve energy
performance. Based on ASHRAE procedures for commercial building energy audits (PCBEA), field study
and energy audits were conducted to collect information of building geometry, building materials, space
types, density and activities of people, capacity of HVAC system, loads and operating schedules of lighting
and internal equipment. Using this information, a hospital energy model with the current internal system
arrangements is established using EnergyPlus software, calibrated by field information of this building as a
baseline. The energy saving potentials of several energy saving measures applied such as high-performance
chillers and lighting devices, window glass with tinted film and energy management resulting from
EnergyPlus simulations have been examined with reference to the cooling energy demand. The retrofit
feasibility has also been evaluated in terms of annual savings and pay-back period of the investment. Those
analyses could be beneficial to establish a feasible retrofit plan for energy saving of this building.
1 INTRODUCTION
Taiwan is a small island with rare indigenous
energy, 97% of energy imported from overseas.
Recently, scales of building in Taiwan such as office
buildings, department stores, hospitals and hotels
were increasing, consuming large amount of
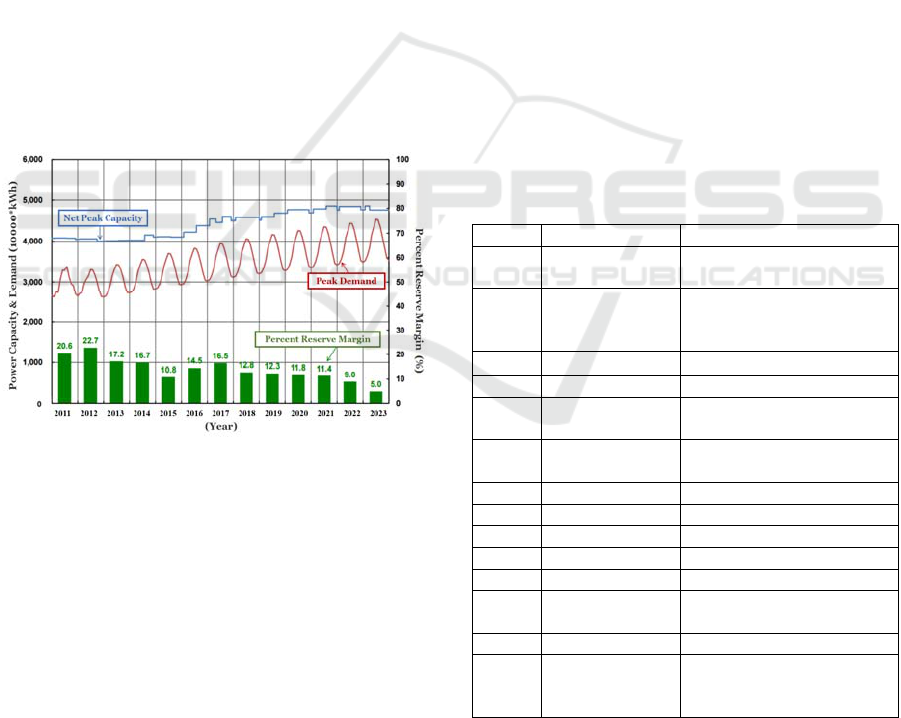
electricity. From the current situation and future
trend of electricity demands and percent reserve
margin of capacity of Taiwan, shown in the Figure
1, it can be found that electricity demands of Taiwan
increase with years while percent reserve margin of
capacity decreases with years. Therefore, how to
reduce the electricity consumption and improve
energy efficiency has become a key issue for energy
management of Taiwan. According to investigations
(Bureau of Energy of Taiwan, 2015) from Bureau of
Energy of Taiwan, there are 145 hospital buildings
with contract capacity above 800 kW, consuming
2.1 billion kWh per year, about 14.9 % of electricity
consumption of non-productive industries in
Taiwan. In addition, average electricity consumption
per unit area of medical centres and regional
hospitals are 245 kWh/m
2
yr and 205 kWh/m
2
yr,
respectively, about 1.47 to 1.75 times of the one of
office buildings. Hospitals provide patients with 24
hours of lighting, air conditioning and healthcare
facilities to meet the requirements of medical care,
thus consuming large amount of electricity. The
Taiwan government has set the energy saving target
that Mega-Watt energy users would have 1% of
energy reduction per year in the following 5 years
(Bureau of Energy of Taiwan, 2015). Concerning
this matter, hospital buildings would have to
implement energy-saving measures in order to
reduce electricity consumption and to reach the
Taiwan government’s energy saving target.
Energy simulation is a useful method to evaluate
influence factors on building energy performance
such as building materials, power densities of
lighting and internal electrical equipment, air
conditioning system, and operation schedules etc.,
especially useful for the early designing or retrofit
planning stage of such large scale hospital buildings.
Kuo, C-S., Wang, C-P., Wang, F-J., Yu, P-Y. and Lin, H-W.
An Assessment of Feasibility of Energy Saving Measures Applied for a Hospital.
DOI: 10.5220/0006293601510157
In Proceedings of the 6th International Conference on Smart Cities and Green ICT Systems (SMARTGREENS 2017), pages 151-157
ISBN: 978-989-758-241-7
Copyright © 2017 by SCITEPRESS – Science and Technology Publications, Lda. All rights reserved
151
Energy simulations have been applied to analyze
energy performance of hospital buildings in several
previous works. The building energy simulations
were employed to evaluate the energy-saving
efficiency of HVAC system by studying two green
hospital buildings (Chen and Kan, 2014), to examine
thermal performance of hospital buildings with
various geometries (Shchuchenko et al, 2013), to
calculate heating and cooling loads of the hospital
(Saipi et al, 2014), to assess the feasibility of 50%
energy savings for large hospitals in various climate
zones of USA (Bonnema et al. 2010), and to
evaluate impacts of both envelope renovation and
HVAC system selection for a hospital building
(Ascione et al, 2016) etc. It is indicated that the
building energy software can help to obtain a better
understanding of energy consumption throughout the
whole building. Therefore, EnergyPlus building
energy simulation software developed by
Department of Energy of USA was used in this
report to calculate energy consumptions of energy
saving measures applied on this hospital to evaluate
the feasibility of a retrofit plan for energy saving of
this building, located in the midst of Taiwan.
Figure 1: Trend of net peak capacity, peak demand and
percent reserve margin of Taiwan. (Taipower Company,
2011).
This paper is organized as follows. Section 2 is to
obtain completed information of the hospital
building employing ASHRAE procedures for
commercial building energy audits (PCBEA)
(ASHRAE, 2011) for information of building
geometry, building materials, space types, density
and activities of people, capacity of HVAC system,
loads and operating schedules of lighting and
internal equipment. Based on collected information,
an energy model for this hospital was established
using EnergyPlus software, while this energy model
was calibrated by actual monthly electricity as a
retrofit baseline. Section 3 describes the evaluations
of applied energy saving measures. It will compare
annual energy saving and pay-back period of the
investment among the existing baseline and energy
saving measures to evaluate retrofit feasibility.
Finally, Section 4 presents our conclusions
2 ENERGY MODEL OF THIS
HOSPTIAL BUILDING
2.1 Specification of Building
This hospital building is located in the midst of
Taiwan, built in twelve floors above ground and two
floors underground, with base area 64 meter by 58.6
meter. The front of this hospital building faces
northwest. The first floor is the lobby and
emergency rooms. From the 5th floor to the 11th
floor, all spaces are wards except some spaces in
10th floor are used for negative pressure isolation
rooms. The 12th floor contains an auditorium,
meeting rooms and negative pressure isolation
rooms. The detailed information of area and space
types of each floor of this building is shown in Table 1.
Table 1: Specification of building.
Floor Floor area (m
2
) Space property
B1 3749
Radiology department;
Morgue; Parking lot
B2 3749
Restaurant; Pharmacy;
Medical records
department
1F 3749
Lobby;
Emergency room
2F 3749 Outpatient Clinic
3F 3749
Intensive care unit;
Operating room
4F 3749
Air conditioning machine
room
5F 1874.5 Ward
6F 1874.5 Ward
7F 1874.5 Ward
8F 1874.5 Ward
9F 1874.5 Ward
10F 1874.5
Ward;
Negative pressure
isolation room
11F 1874.5 Ward
12F 1874.5
Negative pressure isolation
room; Auditorium;
Meeting room
2.2 Construction of the Building
According to the architectural drawing of this
SMARTGREENS 2017 - 6th International Conference on Smart Cities and Green ICT Systems
152
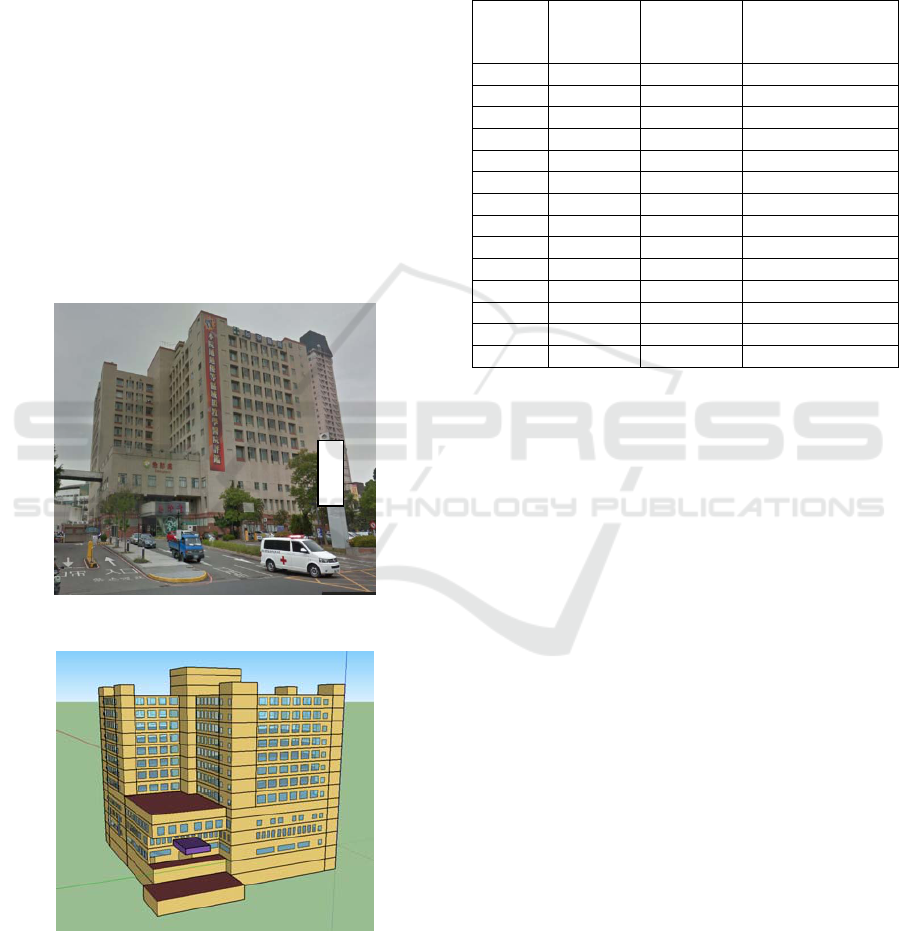
building, the construction, appearance and interior
partition of the building are established. The roof of
this building is reinforced concrete with regular
insulation (overall heat transfer coefficient U = 0.99
W/m
2
K). Exterior wall is 15 cm reinforced concrete
with tiles (overall heat transfer coefficient U = 3.49
W/m
2
K). Window glass is 8 mm brown colour glass
(overall heat transfer coefficient U = 6.07 W/m
2
K,
solar heat gain coefficient SHGC = 0.82). The
building model is built up following the geometric
dimensions of the building in the architectural
drawing. The complicated geometric dimensions of
the building are simplified without influencing the
simulations. The actual appearance and 3D model of
the building are shown in Figure 2 and 3. The
interior partitions of each floor of this building are
independently established according to the
architectural drawing. Some spaces without air
conditioning or with the same property are simply
combined into a space to reduce the complexity of
building model.
Figure 2: Actual appearance of the hospital.
Figure 3: 3D model of the hospital.
2.3 Interior Load Parameters
According to field investigation, the average people,
lighting density and internal electrical equipment
density of each floor of this hospital are shown in
the Table 2.
Table 2: Average interior loads of building.
floor People
number
Lighting
density
(W/m
2
)
Internal electrical
equipment
density(W/m
2
)
B2 100 15 15
B1 200 30 15
1F 300 25 15
2F 160 25 20
3F 160 20 10
4F 5 5 10
5F 160 25 10
6F 160 25 10
7F 160 25 10
8F 160 25 10
9F 160 25 10
10F 160 25 15
11F 160 25 10
12F 100 15 10
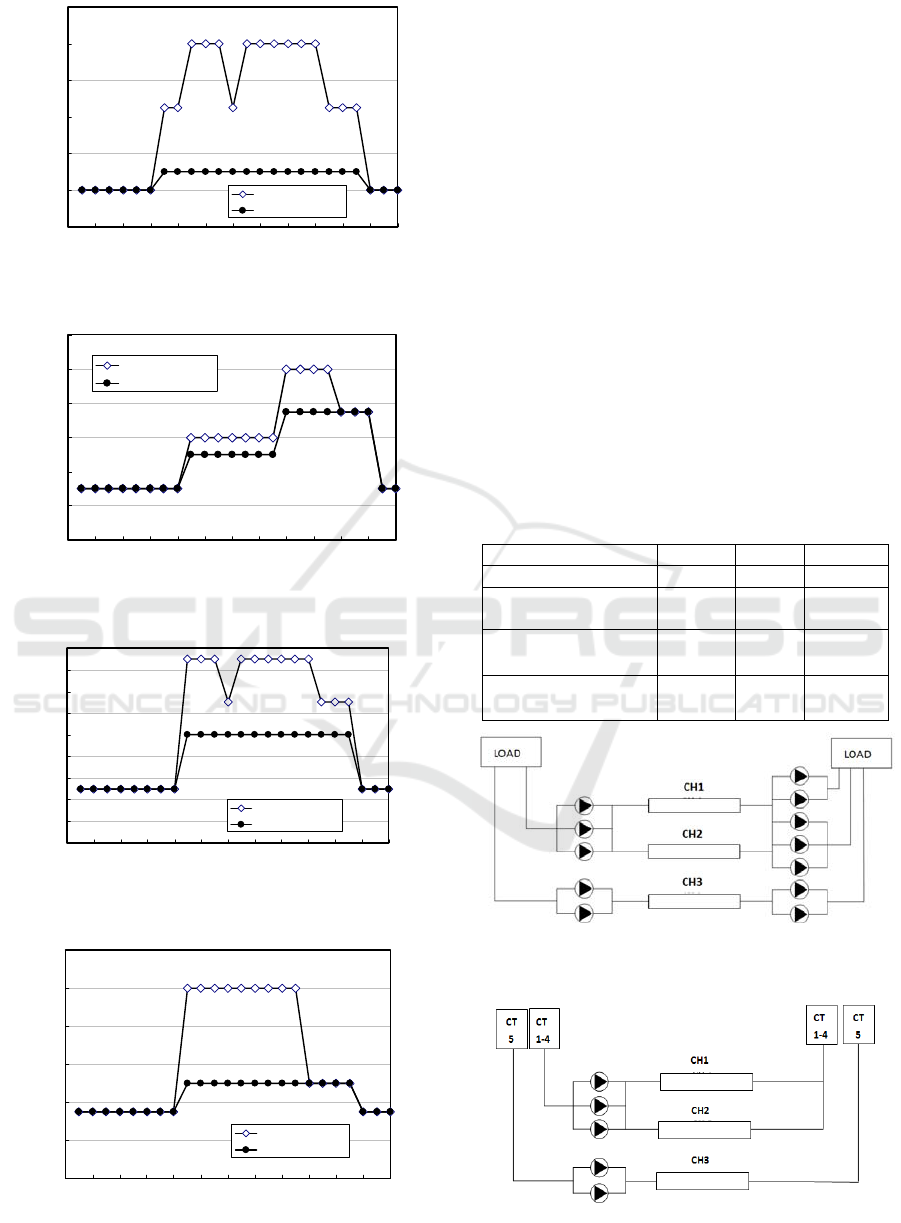
2.4 Schedule
During simulations, schedules of people activity,
lighting, internal electrical equipment and air
conditioning system need to be input to represent
time variation of people number and power density
of related equipment. The effect of time variation is
expressed using the number of fraction of peak.
When full load is done, fraction of peak is set to be 1.
On the other hand, fraction of peak is 0 when the
load is off. The value of fraction of peak is between
0 and 1 when it is partial load. In this report,
schedules were derived based on engineering
judgment and field investigation. Figure 4 shows the
time variation of people number in the hospital
building. Y-axis represents the ratio of people
number of the current time to the peak people
number. Figure 5, 6, and 7 plot the lighting, internal
electrical equipment, and air conditioning system
schedules in the hospital building. For special spaces
in the hospital such as emergency rooms and
intensive care unit, the fraction of peak of schedules
remains one for 24 hours throughout the whole year.
An Assessment of Feasibility of Energy Saving Measures Applied for a Hospital
153
0
0.2
0.4
0.6
0.8
1
1.2
0 2 4 6 8 10 12 14 16 18 20 22 24
Time (hour)
Fraction of pea
k
Weekday schedule
Weekend schedule
Figure 4: Occupancy schedule.
0
0.2
0.4
0.6
0.8
1
1.2
024681012141618202224
Time (hour)
Fraction of pea
k
Weekday schedule
Weekend schedule
Figure 5: Lighting schedule.
0
0.1
0.2
0.3
0.4
0.5
0.6
0.7
0.8
0.9
0 2 4 6 8 1012141618202224
Time (hour)
Fraction of pea
k
Weekday schedule
Weekend schedule
Figure 6: Internal electrical equipment schedule.
0
0.2
0.4
0.6
0.8
1
1.2
0 2 4 6 8 1012141618202224
Time (hour)
Fraction of pea
k
Weekday schedule
Weekend schedule
Figure 7: Air conditioning system schedule.
2.5 Air Conditioning System
This air conditioning system of this hospital contains
two 540 RT chillers in a parallel configuration and a
250 RT chiller, with rated COP of 5.0, 5.0 and 4.0,
respectively. These chillers work using 5 chilled
water pumps and 7 regional chilled water pumps to
cool the rooms inside the building, illustrated in
Figure 8. Also, these chillers employ 5 cooling water
pumps and 5 cooling towers to release heat to the
environment, shown in Figure 9. Specifications of
chillers are indicated in Table 3. The chiller of 250
RT works 24 hours whole year to meet the
requirements of cooling loads of special spaces such
as emergency rooms and intensive care unit. Two
540 RT chillers satisfy the cooling demands for all
regular rooms, operating with the air conditioning
system schedule indicated in Figure 7. The
efficiency of fans used in air conditioning system is
0.6. The room temperature of regular space is set at
25 ℃.
Table 3: Specifications of chillers.
No. CH1 CH2 CH3
Capacity (RT) 540 540 250
Power consumption
(kW)
384 384 198
Inlet/outlet chilled
water temp. (℃)
12/7 12/7 12/7
Inlet/outlet cooling
water temp. (℃)
32/37 32/37 32/37
Figure 8: Chillers, chilled water pumps and regional
chilled water pumps.
Figure 9: Chillers, cooling water pumps and cooling
towers.
SMARTGREENS 2017 - 6th International Conference on Smart Cities and Green ICT Systems
154
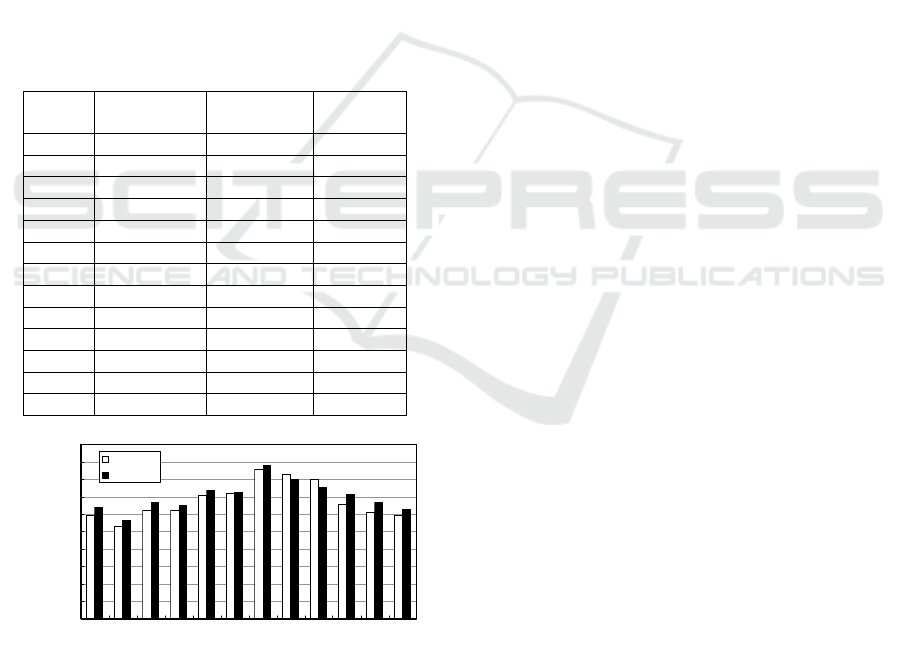
2.6 Baseline Model
A building model with above settings including
construction and materials, internal loads, schedules
and air conditioning system is simulated using
EnergyPlus software. The simulation result of
electricity consumption of this building is compared
with measured electricity consumption in 2015,
listed in Table 4. The deviation of total annual
electricity consumption between simulation and
actual measured data is about 3.64% and the trends
of monthly electricity usages of both are similar and
closed. The allowable difference between predicted
and measured data is that the annual simulated
energy usage should be within 10% of metered data,
while a difference of less than 25% is acceptable on
a seasonal basis (Rahman et al, 2010). From the
simulation result, it is indicated that this building
model can be the baseline for retrofit evaluations in
terms of total annual electricity consumption.
Table 4: Comparison between actual and simulation data.
Month Actual
(kWh)
Simulation
(kWh)
Deviation
(%)
1 595,832 638,165 7.10
2 528,308 566,942 7.31
3 621,872 669,196 7.61
4 620,990 653,532 5.24
5 707,569 739,281 4.48
6 720,664 723,314 0.37
7 855,248 881,724 3.10
8 827,073 799,616 -3.32
9 801,520 752,193 -6.15
10 657,216 715,404 8.85
11 612,632 668,029 9.04
12 590,675 628,319 6.37
Total 8,139,599 8,435,715 3.64
0
100,000
200,000
300,000
400,000
500,000
600,000
700,000
800,000
900,000
1,000,000
123456789101112
Month
Energy consumption (kWh)
Acutal
Simulated
Figure 10: Simulation result and comparison with
measured data.
3 EVALUATION OF ENERGY
SAVING MEASURES
Based on baseline energy model of this hospital
building, calculations of energy saving and pay-back
period of investment of energy saving measures
applied on air conditioning system, ventilation
system, lighting system, internal electrical
equipment, building materials and energy
management are conducted as follows.
Baseline: The EnergyPlus building model with
current internal system, which has been calibrated
with the monthly electricity consumptions of the
hospital building in 2015.
Measure 1: The original chiller of 250 RT with
COP = 4.0 is replaced by a new chiller of 250 RT
with COP = 5.0. After this improvement, total
annual energy consumption is 8,115,158 kWh,
saving 3.8% of electricity about reduction of 31,022
USD (US Dollar). If cost of this improvement is
80,646 USD, the return on investment (ROI) will be
2.6 years.
Measure 2: This measure is to increase outlet
chilled water temperature of chillers from 7
o
C to 8
o
C.
According to the required working condition of air
handling units, the apparatus dew point is 13.5
o
C.
Generally, the temperature difference between inlet
and outlet chilled water of the chiller is 5
o
C.
Therefore, when outlet chilled water temperature of
chillers is from 7
o
C to 8
o
C, the apparatus dew point
can reach to 13.5
o
C. It means that this change will
not influence the working condition of cooling coils
of air handling units. This measure can be
implemented easily by changing the temperature
setting value on the control panel of the chiller.
After this setting, total annual energy consumption is
8,345,617 kWh, saving 2.1% of electricity about
reduction of 17,438 USD. Since cost of this
improvement is 0 USD, the return on investment
(ROI) is 0 year.
Measure 3: Decreasing inlet cooling water
temperature of chillers from 32
o
C to 31
o
C is applied
to save energy. Based on the consideration of
capacity of current cooling tower, properties of
chiller and outdoor wet-bulb temperature without
significant deviations from the standard operation
conditions suggested by manufacturers, slightly
decreasing 1
o
C on inlet cooling water temperature of
chillers is proposed to observe the variation of total
energy consumption. This measure can be carried
out by simply changing the setting values of inlet
cooling water temperature on the control panel of
chillers. After this change, total annual energy
consumption is 8,365,667 kWh, saving 1.1% of
An Assessment of Feasibility of Energy Saving Measures Applied for a Hospital
155
electricity about reduction of 8,720 USD. Since cost
of this improvement is 0 USD, the return on
investment (ROI) is 0 year.
Measure 4: Employing the tinted window film on
window glass of the building as thermal insulation,
the solar heat gain coefficient (SHGC) of window
glass with tinted film is reduced from 0.81 to 0.51.
After this improvement, total annual energy
consumption is 8,365,667 kWh, saving 0.8% of
electricity about reduction of 6,780 USD. Since cost
of this improvement is 92,746 USD (total glass area
is 2395.94 m
2
and cost is 38.7 USD/m
2
), the return
on investment (ROI) is 13.7 years.
Measure 5: The original lighting systems for
existing building using T-8 fluorescent lamps are
replaced by T-5 fluorescent lamps. Therefore, by
this energy saving measure, the average lighting
density in all spaces will be 0.85 times of the
original lighting density. After this improvement,
total annual energy consumption is 8,112,018 kWh,
saving 3.8% of electricity about reduction of 31,326
USD. Since cost of this improvement is 222,161
USD, the return on investment (ROI) is 7.1 years.
Measure 6: High-performance appliances are
applied to reduce energy consumption of internal
electrical equipment. By this measure, energy
consumption of internal electrical equipment is
estimated to be 0.94 times of original one. If this
improvement is conducted, total annual energy
consumption will be 8,300,822 kWh, saving 1.6 %
of electricity about reduction of 13,054 USD. Since
cost of this improvement is 70,000 USD, the return
on investment (ROI) is 5.36 years.
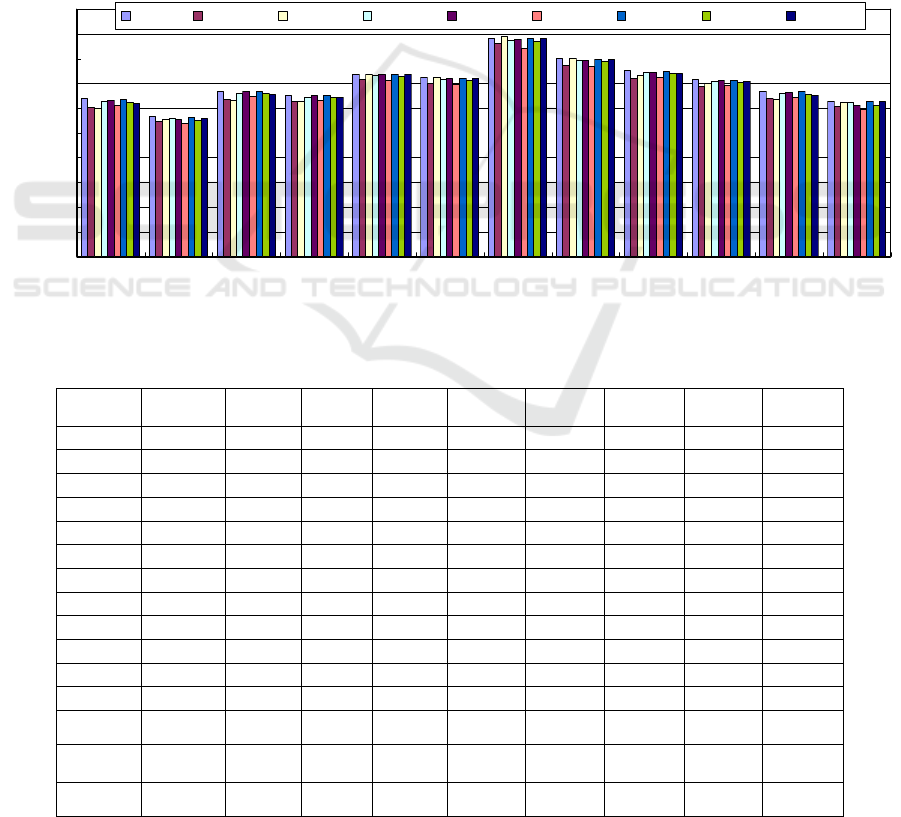
Figure 11: Simulation results of energy saving measures and comparison with baseline data.
Table 5: Results of energy saving measures.
Month
Baseline
(MWh)
Measure
1(MWh)
Measure
2(MWh)
Measure
3(MWh)
Measure
4(MWh)
Measure
5(MWh)
Measure
6(MWh)
Measure
7(MWh)
Measure
8(MWh)
1 638.17 605.07 598.83 628.38 630.55 611.38 636.33 624.65 621.67
2 566.94 544.17 554.79 558.89 554.14 540.88 565.18 553.55 560.57
3 669.20 636.65 632.63 660.16 667.35 647.42 667.89 659.46 654.75
4 653.53 624.92 627.20 646.13 651.03 633.43 652.22 643.97 643.18
5 739.28 716.11 736.84 732.91 736.11 713.28 737.91 728.77 736.13
6 723.31 701.41 725.10 716.68 719.20 697.67 721.97 713.00 721.03
7 881.72 859.65 889.26 874.86 877.68 840.54 880.37 871.29 879.43
8 799.62 775.21 800.33 792.46 794.21 769.42 798.22 788.71 796.02
9 752.19 722.16 733.26 743.80 745.46 724.79 750.84 741.66 740.47
10 715.40 686.17 699.36 709.06 711.67 691.73 714.05 705.13 709.56
11 668.03 637.07 635.45 659.73 666.20 645.88 666.76 658.57 653.79
12 628.32 606.59 622.48 622.55 612.08 595.60 626.08 612.08 625.89
Total 8435.72 8115.16 8255.52 8345.62 8365.67 8112.02 8417.82 8300.82 8342.48
Energy
saving (%)
-- 3.8 2.1 1.1 0.8 3.8 1.6 0.2 1.11
ROI (year) -- 2.6 0 0 13.7 7.1 5.36 37.3 0
0
100,000
200,000
300,000
400,000
500,000
600,000
700,000
800,000
900,000
1,000,000
123456789101112
Month
Energy consumption (kWh)
Baseline Measure 1 Measure 2 Measure 3 Measure 4 Measure 5 Measure 6 Measure 7 Measure 8
SMARTGREENS 2017 - 6th International Conference on Smart Cities and Green ICT Systems
156

Measure 7: This measure is to improve the fan
efficiency in the ventilation systems from 0.6 to 0.7.
If this improvement is conducted, total annual
energy consumption will be 8,417,819 kWh, saving
0.2% of electricity about reduction of 1,732 USD.
Since cost of this improvement is 64,516 USD, the
return on investment (ROI) is 37.3 years.
Measure 8: The temperatures of regular spaces
such as offices, lobby, outpatient clinic and general
wards inside the hospital building are increased from
25
o
C to 26
o
C. The room temperatures of special
spaces remain unchanged. Therefore, by this energy
saving measure, energy consumption will be
8,342,484 kWh, saving 1.11% of electricity about
reduction of 9,022 USD. Since cost of this
improvement is 0 USD, the return on investment
(ROI) is 0 years.
4 CONCLUSIONS
In this study, the building energy software
EnergyPlus was used to calculate annual energy
consumptions of the hospital building under various
energy saving measures. The feasibilities of energy
saving measures have been evaluated in terms of
annual savings and pay-back period of the
investment. The pay-back periods of the investment
of energy saving measures such as replacement of a
high-performance chiller of 250 RT, increasing
outlet chilled water temperature of chillers by 1
o
C,
decreasing inlet cooling water temperature of
chillers by 1
o
C, and increasing room temperature of
regular spaces by 1
o
C are less than 5 years, which
are recommended to implement first. By simulations,
those analyses could be beneficial to establish a
feasible retrofit plan for energy performance of this
hospital building.
ACKNOWLEDGEMENTS
The authors would like to thank the Bureau of
Energy of the Ministry of Economic Affairs of
Taiwan for sponsoring this research work.
REFERENCES
Ascione, F., Bianco, N., De Masi, R.F., de Rossi, F., De
Stasio, C., Vanoli, G.P., 2016. Energy audit of health
care facilities: dynamic simulation of energy
performances and energy-oriented refurbishment of
system and equipment for microclimatic control.
American Journal of Engineering and Applied
Sciences, in press.
ASHRAE, 2011. Procedures for commercial building
energy audit.
Bonnema, E., Studer, D., Parker, A., Pless, S., Torcellini,
P., 2010. Large hospital 50% energy savings: technical
support document. National Renewable Energy
Laboratory, U.S. Department of Energy.
Bureau of Energy of Taiwan, 2015. Energy audit annual
report for non-productive industries.
Chen, P.H., Kan, M.S., 2014. Integrating energy
simulation in energy saving analysis of Taiwan’s
green hospital buildings. In 2014 Proceedings of the
31
st
International Symposium on Automation and
Robotics in Construction and Mining, Sydney,
Australia. pages 561-567.
Rahman, M.M., Rasul, M.G., Khan, M.M.K., 2010.
Energy conservation measures in an institutional
building in sub-tropical climate in Australia. Applied
Energy, 87: 2994-3004.
Saipi, N., Schuss, M., Pont, U., Mahdavi, A., 2014.
Comparison of simulated and actual energy use of a
hospital building in Austria. Advanced Materials
Research, 899: 11-15.
Shchuchenko, V., Lie, B., Harsem, T.T., 2013. Influence
of building form of hospital on its energy
performance. European Scientific Journal, 3: 286-295.
Taipower Company, 2011. Report of electricity
development of Taipower company in Taiwan.
U.S. Department of Energy, 2014. EnergyPlus engineering
reference, version 8.1.
An Assessment of Feasibility of Energy Saving Measures Applied for a Hospital
157
